Acta Scientiarum
http://www.uem.br/acta ISSN printed: 1806-2636 ISSN on-line: 1807-8672
Doi: 10.4025/actascianimsci.v37i3.25725
Propolis extract and sodium monensin on ruminal fermentation and
hematological parameters in sheep
Fernanda Gomes Bezerra da Silva*, Sandra Mari Yamamoto, Eva Mônica Sarmento da Silva, Mario Adriano Ávila Queiroz, Layse Araújo Gordiano and Marcela Almeida Formiga
Universidade Federal do Vale do São Francisco, Rod. BR-407, km 12, 56300-990, Petrolina, Pernambuco, Brazil. *Author for correspondence. E-mail: [email protected]
ABSTRACT. This study evaluated the effects of different concentrations of 30% propolis ethanol extract (PEE) and sodium monensin on the intake of dry matter, nutrient digestibility and ruminal fermentation and hematological parameters in sheep. Six adult castrated male sheep fistulated in the rumen were assigned to a 6 x 6 Latin square design. The addition of PEE or sodium monensin to the diet did not change the digestibility coefficients of dry matter (79.4%), crude protein (77.0%), neutral detergent fiber (76.1%), acid detergent fiber (69.7%), hemicellulose (80.9%), and organic matter (79.4%). Sheep fed diets with inclusion of sodium monensin showed 11.3% reduction in dry matter intake (1.76 kg day-1) compared
to those which received PEE (2.00 kg day-1). The inclusion of additives to the diet influenced ruminal pH:
higher values were observed in sheep fed sodium monensin (6.1). Mean levels of ammonia nitrogen (7.3 mg dL-1) were similar between treatments. Biochemical serum parameters of glucose (59.4 mg dL-1),
urea (8.9 mg dL-1) total protein (6.8 g dL-1) and albumin (2.5 g dL-1) were within the reference range for
the ovine species. Sodium monensin was more efficient to maintain ruminal pH at higher levels and to reduce the dry matter intake. However, the addition of PEE did not affect the nutrient digestibility in sheep fed 50:50 forage: concentrate ratio.
Keywords: nutrition, ionophores, bacteria, rumen, sheep blood.
Extrato de própolis e monensina sódica sobre os parâmetros de fermentação ruminal e
hematológicos de ovinos
RESUMO. Este trabalho foi realizado para avaliar os efeitos do extrato etanólico de própolis a 30% (EEP) e da monensina sódica sobre a ingestão de matéria seca, digestibilidade de nutrientes e parâmetros de fermentação ruminal e hematológicos de ovinos. Seis ovinos machos castrados e canulados no rúmen foram distribuídos em um delineamento quadrado latino 6 x 6. A adição do EEP ou monensina sódica na dieta não alterou os coeficientes de digestibilidade da matéria seca (79,4%), proteína bruta (77,0%), fibra em detergente neutro (76,1%), fibra em detergente ácido (69,7%), hemicelulose (80,9%) e materia orgânica (79,4%). Ovinos alimentados com adição de monensina apresentaram redução de 11,3% na ingestão de matéria seca (1,763 kg dia-1) em relação aos que receberam EEP (2,00 kg dia-1). A inclusão dos aditivos
influenciou o pH ruminal: os valores mais elevados foram observados nos ovinos alimentados com monensina (6,1). Níveis médios de nitrogênio amoniacal (7,3 mg dL-1) não foram afetada os pelos
diferentes tratamentos. Os parâmetros bioquímicos séricos de glicose, ureia, proteínas totais e albumina mantiveram-se dentro dos níveis de referência para a espécie ovina. A monensina sódica foi mais eficiente ao manter o pH ruminal em níveis mais elevados e diminuir a ingestão de matéria seca em ovinos alimentados com dietas com relação volumoso concentrado 50:50.
Palavras-chave: nutrição, ionóforos, bactérias, rúmen, sangue ovino.
Introduction
The use of feed additives, mainly ionophore antibiotics, has become common aiming to increase meat production, reduce or prevent diseases, reduce the age at slaughter and, consequently, improve the quality of animal derived foods (Prado, 2010a; Valero et al., 2011; Zawadzki et al., 2011a and b). According to Stradiotti
Currently, consumers search for safe foods, derived from animals, which have not been fed antibiotics or growth promoters. Considering this situation, according to Ghisalberti (1979), propolis is a safe alternative given its pharmacological properties, including its antimicrobial, antimycotic and antiprotozoal activities (Prado et al., 2010b).
Antimicrobial activity of propolis occurs through the inhibition of gram-positive bacteria (Ghisalberti, 1979; Park et al., 2000). Considering this characteristic, it is expected an inhibition of proteolytic bacteria through the inclusion of propolis in the animal diet (Hino & Russell, 1987) and, as consequences, an inhibition of protein deamination, proteolysis and production of gases, providing an increase of alimentary efficiency and feed digestibility (Aguiar et al., 2012; Prado, 2010a, c; Zawadzki et al., 2011a). Besides these factors, propolis has advantages compared to antibiotics for being a natural product, easy to obtain, economically feasible and generally considered as safe both for humans and animals. The determination of the real activity of propolis on the sheep rumen and its effect on alimentary efficiency makes it possible to use propolis as a substitute of certain medicinal compounds, increasing the production of ruminants by the reduction of the time of breeding and producing animals, whose meat will be safer for consumers.
The goal of this study was to evaluate the effects of propolis ethanol extract and sodium monensin on the intake and digestibility of feeds, on parameters of ruminal fermentation and on hematological parameters in sheep.
Material and methods
The experiment was conduct in the Sheep Breeding Area, Agricultural Science campus, UNIVASF – Universidade Federal do Vale do São Francisco, in the municipality of Petrolina, Pernambuco State, Brazil. The campus is located at 9°09’ South latitude and 40°22’ West longitude, average altitude of 365 m asl and annual rainfall index of 300 mm.
Crude propolis was purchased from the local association of beekeepers, and was cleaned to remove gross impurities. The extraction was performed as described by Stradiotti Júnior et al. (2004): crude propolis was ground and 100 mL 70% ethanol were added to 30 grams of it. After ten days, the extract was filtered through filter paper, obtaining 30% propolis ethanol extract (PEE). Chemical analysis of this PEE was made according to the methods described by Bertoncelj et al. (2011), who identified the presence of the flavonoids naringenin and apigenin by chromatographic analysis.
Six adult castrated male sheep, average weighing 62 kg, fistulated in the rumen were kept in individual pens with drinkers and feeding trough. Animals were assigned to s 6 x 6 Latin Square experimental design: six animals, six experimental periods and six treatments: T1: control, with no addition of propolis and sodium monensin in the concentrate; T2: 6 mL PEE per day; T3: 12 mL PEE per day; T4: 24 mL PEE per day; T5: 36 mL PEE per day and T6: 30 mg sodium monensin per kg concentrate. Any experimental period lasted 19 days: 14 for the adaptation of the animals to the treatments and five days for samplings.
We used a commercial product containing 20% sodium monensin. This product was included to concentrate feed at 15 g for 100 kg of feed, in order to obtain a final concentration of 30 mg sodium monensin per kg of concentrate. PEE was included to feed upon feed supply. The experimental diet consisted of 50% of elephant grass (Pennisetum purpureum) as forage and 50% of concentrate (corn, soybean meal, vitamin and mineral nucleo) (Table 1). Diet was formulated according to NRC (2007) suggestions for adult sheep in maintenance. Feed was supplied as a complete mixture allowing for leftovers at 15%.
Table 1. Chemical composition of the feed ingredients (elephant grass and concentrate) and of the complete feed formulation.
Constituent Elephant grass Concentrate Feed
DM (%) 28,11 92,42 60,27
OM (g 100g-1DM) 90,09 92,11 91,10
MM (g 100g-1DM) 9,91 7,89 8,90
CP (g 100g-1DM) 5,49 21,56 13,52
NDFap (g 100g-1DM) 68,84 40,82 54,83
ADFap (g 100g-1
DM) 41,73 6,54 24.13
HEM (g 100g-1DM) 27,11 34,28 30,70
DM: Dry matter; OM: Organic matter; MM: Mineral matter; CP: Crude protein; NDFap: Neutral detergent fiber corrected for ash and protein; ADFap: Acid detergent fiber corrected for ash and protein; HEM: Hemicellulose.
Animals were weighed at the beginning and at the end of each period, in order to adjust the amount of feed provided. Feed was daily weighed on a digital scale and provided twice a day, at 8h00 am and 4h00 pm. Water was provided ad libitum. The amount of nutrients ingested was estimated from chemical analysis. At the beginning of any study period, feed were sampled to provide composite samples for chemical analysis.
Total collection of feces was performed from day 15 to day 19 of each experimental period, using an adapted plastic bag. Feces were collected by the morning, at 8h00 am, weighed and homogenized. From these samples, we separated 10% to form composite samples for each animal and sampling time.
Própolis and sodium monensin in the diet of ruminant 275
were ground in mills with 1 mm sieve. In all these samples, we measured dry matter (DM), crude protein (CP) and mineral matter (MM) according to the methods described by Silva and Queiroz (2002). Organic matter (OM) was determined by the equation: MO = 100-MM. Neutral detergent fiber (NDF) and acid detergent fiber (ADF) were determined according to Van Soest (1994). For the determination of the digestibility coefficient (DC), we used the equation described by Schneider and Flatt (1975): DC = [(ingested nutrient – excreted nutrient)/ingested nutrient] x 100.
Parameters of ruminal fermentation were evaluated by ruminal pH and ammonia nitrogen. Rumen liquid was collected on the last experimental day, every two hours for 24 hours after feeding. pH readings were performed immediately after samplings, using a digital pH-meter. For the determination of ammonia Nitrogen (N-NH3), rumen liquid was filtered through a double gauze layer and centrifuged at 500 rpm, distilled with potassium hydroxide.
Blood samples were taken for the determination of hematological parameters at the beginning and end of each period before feed supply. Blood samples of nine mL were collected from the jugular vein and divided into three mL fractions: the first sample, with 10% EDTA (Ethylene diaminetetra acetic acid) anticoagulant, for blood smear and hemogram; further three mL of blood, with fluorine anticoagulant, were used for glucose measurement and the last three mL, with no anticoagulant, were used for the production of serum and further serological biochemical analysis.
Statistical analysis was run with the aid of the Statistical Analysis System (SAS, 2004). Data normality was evaluated by the Shapiro-Wilk test (PROC UNIVARIATE) and variances compared by
orthogonal contrasts, with significance level of 5% by PROC GLM. In the case of significant results, we determined the parameters of regression equations by the estimate statement of PROC MIXED. As the levels between doses of propolis ethanol extract were not equidistant, we used PROC IML to generate the vectors of each contrast.
Results and discussion
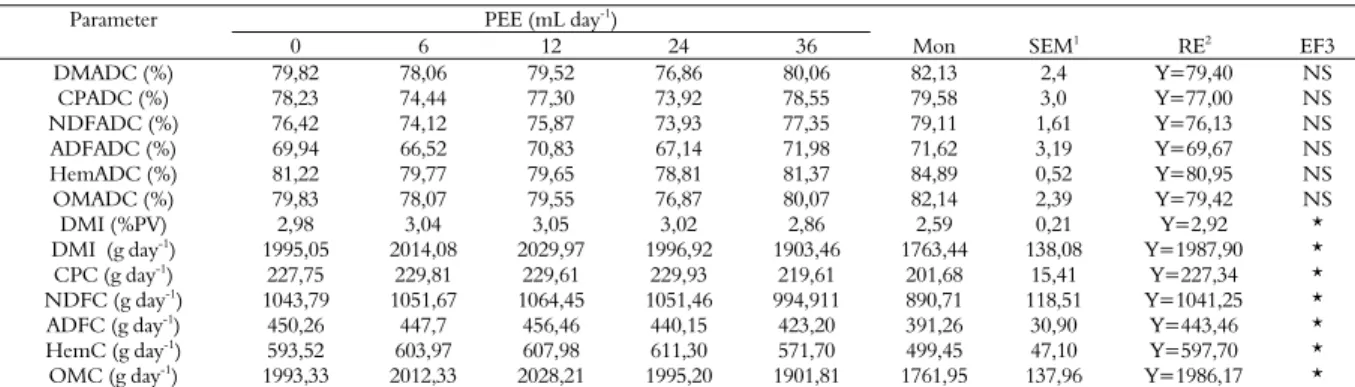
No effect (p > 0.05) was detected for PEE or sodium monensin on apparent digestibility of dry matter (DMADC), crude protein (CPADC), neutral detergent fiber (NDFADC), acid detergent fiber (ADFADC), hemicellulose (HemADC) and organic matter (OMADC) (Table 2).
The results observed are different from those obtained by Prado et al. (2010a), who evaluated the effect of including propolis or sodium monensin on in vitro digestibility of dry matter in diets with 50:50 forage concentrate ratio. These authors found a DMADC of 53.0% in control experiment; an 8.3% increase (p < 0.05) of in vitro DMADC according to the inclusion of propolis based product (DMADC 57.3%) and a 6.2% DMADC increase according to the addition of sodium monensin (DMADC 54%).
In respect of protein and fiber digestibility, the results in previous studies are contradictory. Prado et al. (2010a) analyzed bulls in feedlot feeding forage based feed and found a better CPADC, NDFADC and ADFADC in the control diet (59.7; 47.9 and 44.8% respectively), compared to the diet added with propolis based product LLOSC® (59.7, 47.9 and 44.8%) or
sodium monensin (63.1, 49.53 and 46.1%). In water buffalos feeding a forage based diet, Prado et al. (2010c) registered an increase (p < 0.05) in NDFADC and ADFADC for the LLOSC® treatments, compared to
controls and sodium monensin.
Table 2. Intake and digestibility of the nutrients of feeds containing different concentrations of propolis ethanol extract (PEE) or sodium monensin in sheep.
Parameter PEE (mL day-1
)
0 6 12 24 36 Mon SEM1 RE2 EF3
DMADC (%) 79,82 78,06 79,52 76,86 80,06 82,13 2,4 Y=79,40 NS
CPADC (%) 78,23 74,44 77,30 73,92 78,55 79,58 3,0 Y=77,00 NS
NDFADC (%) 76,42 74,12 75,87 73,93 77,35 79,11 1,61 Y=76,13 NS
ADFADC (%) 69,94 66,52 70,83 67,14 71,98 71,62 3,19 Y=69,67 NS
HemADC (%) 81,22 79,77 79,65 78,81 81,37 84,89 0,52 Y=80,95 NS
OMADC (%) 79,83 78,07 79,55 76,87 80,07 82,14 2,39 Y=79,42 NS
DMI (%PV) 2,98 3,04 3,05 3,02 2,86 2,59 0,21 Y=2,92 *
DMI (g day-1
) 1995,05 2014,08 2029,97 1996,92 1903,46 1763,44 138,08 Y=1987,90 * CPC (g day-1) 227,75 229,81 229,61 229,93 219,61 201,68 15,41 Y=227,34 *
NDFC (g day-1
) 1043,79 1051,67 1064,45 1051,46 994,911 890,71 118,51 Y=1041,25 * ADFC (g day-1) 450,26 447,7 456,46 440,15 423,20 391,26 30,90 Y=443,46 *
HemC (g day-1) 593,52 603,97 607,98 611,30 571,70 499,45 47,10 Y=597,70 *
OMC (g day-1
) 1993,33 2012,33 2028,21 1995,20 1901,81 1761,95 137,96 Y=1986,17 *
DMADC = apparent digestibility of dry matter; CPADC = apparent digestibility of crude protein; NDFADC = apparent digestibility of neutral detergent fiber; ADFADC = apparent digestibility of acid detergent fiber; HemADC = apparent digestibility of hemicellulose; OMADC = apparent digestibility of organic matter; DMI = Dry matter intake; CPC = Crude protein intake; NDFC = Neutral detergent fiber intake; ADFC = Acid detergent fiber intake; HemC = Hemicellulose intake; OMC = Organic matter intake; PEE Propolis ethanol
extract; Mon = Sodium monensin; SEM1 = Alpha'sStandard Errorstandard error; ER2 = Regression equation for the different levels of propolis ethanol extract; EF3 = Effect of
Stradiotti Júnior et al. (2004) observed that propolis is more efficient in inhibiting in vitro microorganisms, monensin is more efficient in vivo, due to some factor which is still unknown. This reduction of the in vivo effect of propolis is probably related to the attachment of the product to feed, by the neutralization of its effect by the saliva, to some ruminal microorganism, or to the dilution of the product. Forage: concentrate ratio and animal species may also affect the role of propolis based product in ruminant feeding.
High digestibility of neutral detergent fiber (NDFADC) found in this work (76.1%) is probably associated to forage the species used, as elephant grass was cut at intervals shorter than 60 days. This digestibility value was higher than that found by Silva et al. (2007) (53.7 to 72.4%), which studied in vivo digestibility (NDFADC) of elephant grass at different re-growth ages in cattle.
Different levels of PEE included in feed had no effect (p > 0.05) on intake. On the contrary, our data showed a significant effect of sodium monensin on this parameter (p < 0.05) (Table 2). Average values of dry matter intake (DMI), represented as percentage of body weight (%BW), were higher than those recommended by NRC (2007) for animals in maintenance, which is between 1.8 and 2.5% BW.
Those animals fed diet containing sodium monensin ingested less dry matter, crude protein, neutral detergent fiber, acid detergent fiber, hemicellulose and organic matter. The average value of dry matter intake was 2.59% BW, corresponding to 1,763.44 g DM day-1. This value is 11.3% lower
than that of the animals receiving control feed. The mechanisms associated with reduced DM intake in animals treated with sodium monensin are still unknown. According to Stradiotti Júnior et al. (2004), this reduction highlights the better exploitation of the energy available in feed caused by the effect of the additive on gram positive bacteria, with suppression of caloric losses, mainly caused by the reduction of gas production, reduction of amino acid deamination and increased propionate production.
Many studies, such as those conducted by Vargas et al. (2001) and Oliveira et al. (2007), proved reduction of dry matter intake by animals fed diets containing sodium monensin. Herein, we detected a lower reduction in DM intake (11.3%) compared to the data presented by Stock et al. (1995), who described 15% reduction in feed intake according to the inclusion of ionophore additive in the diet. The same authors observed that feed intake returned to 90% of the original amount, as the time went on. The results of other
studies on the effect of propolis on dry matter intake are contradictory. Similar results were obtained by Lana et al. (2007), who studied dairy goats and Ítavo et al. (2011), who investigated lambs, that is, the inclusion of propolis did not affect dry matter intake.
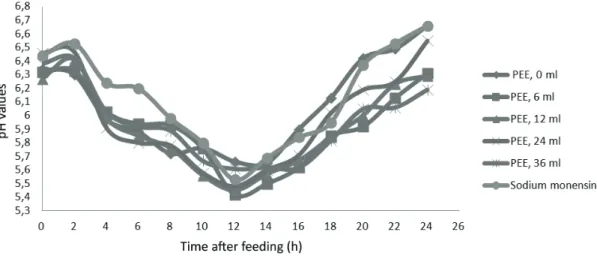
In relation to ruminal pH, we detected effect (p < 0.05) of sodium monensin and cubic effect (Y=5.99-0.02x+0.001x²-0.00002x³) of the inclusion of propolis ethanol extract (Table 3).
Several studies described no effect of PEE or sodium monensin on ruminal pH, as presented by Stradiotti Júnior et al. (2004), evaluating the effect of propolis on ruminal fermentation of bovines, or Prado et (2010a, c) comparing the effect of including sodium monensin or a propolis based product (LLOSC1®) to the diets of bovines and water
buffalos fed on a forage based diet.
On the other hand, this study demonstrated little variations in the mean ruminal pH (6.4-6.7) measured at the first sampling of the day, before feeding the animals which received the different treatments.
pH reduction to values below 6.2 may cause a reduction in cellulolytic bacteria, impairing fiber degradation in the rumen (Russell & Wilson, 1996). Silva and Leão (1979) stated that pH between 5.5 and 7.0 induces proper ruminal fermentation.
Figure 1, a greater reduction in pH was found 12 hours after feeding and animals fed sodium monensin showed a more gradual reduction in pH than the others. This situation was expected, since sodium monensin reduces feed intake and increases feeding frequency (Araújo et al., 2006; Owens et al., 1998), ruminal pH decrease is related to the increase in lactic acid concentration, which increases ruminal osmolality, promoting an increase in water flow from intra- and extra cellular compartments toward the interior of the digestive tract.
The minimum pH value of the animals which received PEE in feed was between 5.4 and 5.6, causing no damage to fiber digestion (Table 2). Lana et al. (2007) used propolis as additive for multiparous and dry goats fed on a diet containing 67% of corn silage and 33% of concentrate based on corn meal, and obtained pH from 6.6 to 5.6, nine hours after feeding.
The concentration of ammonia nitrogen, lowest N-NH3 observed value was 5.2 mg 100 mL -1, were
found in sheep receiving 36 mL PEE day-1, 22 hours
after feeding (Figure 2). This value is higher than the minimal concentration allowing microbial activity (5 mg N-NH3 100 mL -1) mentioned by
Própolis and sodium monensin in the diet of ruminant 277
Table 3. Mean values of ruminal pH and of ammonia nitrogen concentration (N-NH3; mg N 100 mL-1) on sheep fed diets with different levels of PEE or sodium monensin.
PEE (mL day-1
) P value
Parameter 0 6 12 24 36 MON L Q C DC EFM ASE RE
pH 6,07 5,93 5,91 5,98 5,94 6,13 NS NS 0.04 NS 0.001 0.05 Y=5.99-0.02x+0.001x²-0.00002x³ N-NH3 (mg 100 mL-1) 8,04 7,58 6,68 7,09 7,28 7,33 NS NS NS NS NS 0.31 Y = 7.33
PEE = Propolis ethanol extract; MON = Sodium monensin; Value of P for the orthogonal polynomial test L = linear; Q = quadratic; C = cubic; DC = deviation from the cubic; EFM = Effect of sodium monensin by orthogonal polynomial test; SEM = standard error of the mean; RE = regression equation for the levels of PEE; Significant effect as p < 0.05.
Figure 1. Ruminal pH variation over time after feeding in sheep fed diets with different levels of PEE or sodium monensin.
Figure 2. N-NH3 (mg 100mL) ruminal concentration over time after feeding in sheep fed diets with different levels of PEE or sodium monensin.
The highest N-NH3 concentration was 11.7
mg 100 mL-1 at the moment of feeding animals of
the control group (untreated). This value is higher than the N-NH3 concentration presented
by Van Soest (1994) as optimal for microbial
fermentation (10 mg 100 mL-1). High N-NH
3
levels may suggest higher levels of protein degradation, which may cause losses of nitrogen as ammonia and, as a consequence, higher energy
costs associated with the production of urea in the liver (Russell & Strobel, 1989).
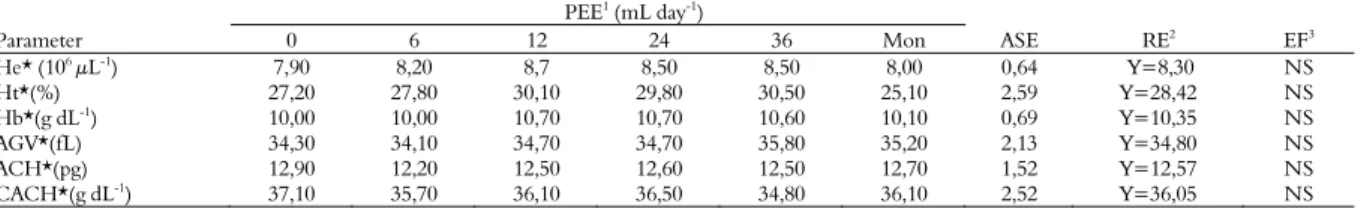
As presented in Table 4, erythrogram showed no differences between (p > 0.05) the groups of sheep which received the different treatments.
little differences between groups and was within normal levels (9 to 15 g Dl-1), as indicated by
Garcia-Navarro Garcia-Navarro and Pachaly (1994).
Hemocyte count (He) was low in all treatments (means: 8.3 x 10⁶ cells μL-1), compared to the
normal value (12 x 106 cells μL) described by
Garcia-Navarro (2005).
Hematocrit, hemoglobin and hemocytes together are used for the diagnosis of anemia (Garcia-Navarro & Pachaly, 1994). In case of anemia, hematocrit is low, independent if hemocyte count is low or not (Garcia-Navarro & Pachaly, 1994). Mean globular volume (AGV) was within the physiologic range for sheep, between 28 and 40 fL.
Leukogram (total leukocytes, eosinophilic cells, lymphocytes and monocytes) showed no difference (p > 0.05) for sheep between different treatments (Table 5). All values were normal, according to reference values cited by Garcia-Navarro (1994): 4,000 to 12,000 total leukocytes μL-1; until 10%
eosinophilic cells; 40 to 70% lymphocytes and 6% monocytes.
Segmented neutrophils were above normal values (10 to 50% according to Garcia-Navarro (1994), in animals which received PEE, but not in those fed sodium monensin (50.8%). The primary function of neutrophils is the phagocytosis and elimination of microorganisms. According to Latimer et al. (1992), these cells represent one of the main defenses of animals against invading pathogens, mainly bacteria. Neutrophils may also cause tissue damage and cytotoxic effect, as much as antiparasitic and antitumor activities. By analyzing our results, we may suppose that the animals could have undergone some subclinical infection during the experiment and sodium monensin might have helped (even in a limited way) to fight the infection.
There were no differences (p > 0.05) in blood biochemical parameters of animals which received the different treatments (Table 6). The values observed are consistent with reference parameters for the ovine species described by Garcia-Navarro (1994): glucose between 50 and 80 mg dL; urea between 8.0 and 20.0 mg dL-1; total protein
between 6.0 and 7.9 g dL and albumin between 2.4 and 3.0 g dL.
Table 4. Erythrogram of sheep fed different levels of PEE and sodium monensin.
Parameter
PEE1 (mL day-1)
0 6 12 24 36 Mon ASE RE2 EF3
He* (106μL-1) 7,90 8,20 8,7 8,50 8,50 8,00 0,64 Y=8,30 NS
Ht*(%) 27,20 27,80 30,10 29,80 30,50 25,10 2,59 Y=28,42 NS
Hb*(g dL-1
) 10,00 10,00 10,70 10,70 10,60 10,10 0,69 Y=10,35 NS
AGV*(fL) 34,30 34,10 34,70 34,70 35,80 35,20 2,13 Y=34,80 NS
ACH*(pg) 12,90 12,20 12,50 12,60 12,50 12,70 1,52 Y=12,57 NS
CACH*(g dL-1) 37,10 35,70 36,10 36,50 34,80 36,10 2,52 Y=36,05 NS
1PEE = propolis ethanol extract; MON = sodium monensin; SEM = standard error of the mean; RE2 = Regression equation for the levels of PEE; EF3 = Effect of sodium monensin
by orthogonal polynomial test, NS = Non-significant (p < 0.05). He = Hemocytes; Ht = Hematocrit; Hb = Hemoglobin; GV = globular volume; CH = corpuscular hemoglobin; CACH = corpuscular hemoglobin concentration.
Table 5. Leukogram of sheep fed different levels of PEE or sodium monensin.
Parameter
PEE1 (mL day-1)
0 6 12 24 36 Mon ASE RE2 EF3
LEUK* (106/μl) 6812 6882 6488 6616 6965 6548 511 Y=6719 NS
SEG*(%) 54,2 54,5 52,5 53,2 55,0 50,8 1,25 Y=53,37 *
EOS*(%) 0,80 1,50 1,70 1,60 2,00 3,20 0,56 Y=1,8 NS
LIMP*(%) 40,6 40,5 42,2 41,2 40,2 41,8 1,98 Y=41,08 NS
MON*(%) 4,00 3,40 3,40 4,00 2,70 3,80 0,90 Y=3,55 NS
1PEE = Propolis ethanol extract; Mon = sodium monensin; SEM = standard error of the mean; RE2 = Regression equation for the levels of PEE; EF3 = Effect of sodium monensin
by orthogonal polynomial test; NS = non-significant (p < 0.05) *= Significant effect (p < 0.05); LEUK = Leukocytes; SEG = Segmented neutrophils; EOS = eosinophilic cells; LIMP = Lymphocyte; MON = Monocytes.
Table 6. Blood biochemical parameters in sheep fed different levels of PEE or sodium monensin.
Parameter
PEE (mL day-1)
0 6 12 24 36 Mon SEM RE2 EF3
Glucose (mg dL) 58,40 57,90 58,90 63,10 59,40 58,90 2,91 Y=59,43 NS Urea ( mg dL) 8,80 9,50 9,20 8,50 8,80 8,70 1,22 Y=8,91 NS Total protein (g dL) 6,90 6,60 6,80 6,80 6,90 6,70 0,22 Y=6,78 NS Albumin (g dL) 2,50 2,30 2,50 2,40 2,40 2,60 0,12 Y=2,45 NS
PEE = Propolis ethanol extract; Mon = Sodium monensin; SEM = standard error of the mean; RE2 = Regression equation for the levels of PEE; EF3 = Effect of sodium monensin by
by orthogonal polynomial test; NS = Non-significant (p < 0.05).
Própolis and sodium monensin in the diet of ruminant 279
Conclusion
Sodium monensin is more efficient than propolis ethanol extract to maintain ruminal pH at higher levels and to reduce dry matter intake. Nevertheless, the addition of propolis ethanol extract has no negative effect on nutrient digestibility in sheep fed diets containing 50:50 forage concentrate ratio.
References
Aguiar, S. C., Zeoula, L. M., Moura, L. P. P., Prado, I. N., Paula, E. M. & Samensari, R. B. (2012). Performance, digestibility, microbial production and carcass characteristics of feedlot young bulls fed diets containing propolis. Acta Scientiarum. Animal Sciences, 34(4), 393-400. Araújo, J., Pérez, J., Paiva, P., Peixoto, E., Braga, G.,
Oliveira, V. & Valle, L. (2006). Efeito da monensina sódica no consumo de alimentos e pH ruminal em ovinos. Archives of Veterinary Science, 11(1), 39-43. Bertoncelj, J., Polak, T., Kropf, U., Korošec, M. & Golob,
T. (2011). LC-DAD-ESI/MS analysis of flavonoids and abscisic acid with chemometric approach for the classification of Slovenian honey. Food Chemistry, 127(1), 296-302.
Garcia-Navarro, C. E. & Pachaly, J. R. (1994). Manual de
hematologia veterinária (Vol. 1). São Paulo: Varela.
Ghisalberti, E. (1979). Propolis: a review. Bee World, 60, 59-84.
Hino, T. & Russell, J. B. (1987). Relative contributions of ruminal bacteria and protozoa to the degradation of protein in vitro. Journal of Animal Science, 64(1), 261-270.
Ítavo, C., Morais, M. G., Costa, C., Ítavo, L. C. V., Franco, G. L., Silva, J. A. & Reis, F. A. (2011). Addition of propolis or monensin in the diet: behavior and productivity of lambs in feedlot. Animal Feed
Science and Technology, 165(3), 161-166.
Lana, R. P., Camardelli, M. M. L., Rodrigues, M. T., Eifert, E. C., Oliveira, M. V. M., Stradiotti Júnior, D. & Oliveira, J. S. (2007). Óleo de soja e própolis na alimentação de cabras leiteiras: consumo de matéria seca e de nutrientes e parâmetros de fermentação ruminal. Revista Brasileira de Zootecnia, 36(1), 191-197. Latimer, K. S., Meyer, D. & Ettinger, S. (1992). Os
leucócitos na saúde e na moléstia. In S. J. Ettinger (Ed.), Tratado de Medicina Interna Veterinária (Vol. 4, pp. 2616-2664). São Paulo: Manole.
NRC. (2007). Nutrient requirements of small ruminants: sheep,
goats, cervids, and new world camelids (7th rev. ed.).
Washington: Natl. Acad. Press, Washington, DC. Oliveira, M. V. M., Lana, R. P., Eifert, E. C., Luz, D. F.,
Pereira, J. C. & Pérez, J. R. O. (2007). Influência da monensina sódica no consumo e na digestibilidade de dietas com diferentes teores de proteína para ovinos.
Revista Brasileira de Zootecnia, 36(3), 643-651.
Owens, F. N., Secrist, D. S., Hill, W. J. & Gill, D. R. (1998). Acidosis in cattle: a review. Journal of Animal
Science, 76(1), 275-286.
Park, Y. K., Ikegaki, M. & Alencar, S. (2000). Classificação das própolis brasileiras a partir de suas características físico-químicas e propriedades biológicas. Mensagem
doce, 58(9), 3-7.
Prado, O. P. P., Zeoula, L. M., Moura, L. P. P., Franco, S. L., Prado, I. N. & Gomes, H. C. C. (2010a). Digestibilidade e parâmetros ruminais de dietas à base de forragem com adição de própolis e monensina sódica para bovinos.
Revista Brasileira de Zootecnia, 39(6), 1336-1345.
Prado, O. P. P., Zeoula, L. M., Moura, L. P. P., Franco, S. L., Paiva, S. B. & Arcuri, P. B. (2010b). Isolation and expeditious morphological, biochemical and kinetic characterization of propolis-tolerant ruminal bacteria.
Revista Brasileira de Zootecnia, 39(9), 2048-2054.
Prado, O. P. P., Zeoula, L. M., Moura, L. P. P., Franco, S. L., Prado, I. N. & Jacobi, G. (2010c). Efeito da adição de própolis e monensina sódica na digestibilidade e características ruminais em bubalinos alimentados com dieta à base de forragem. Revista Brasileira de
Zootecnia, 39(9), 2055-2065.
Russell, J. B. & Strobel, H. J. (1989). Effect of ionophores on ruminal fermentation. Applied and Environmental
Microbiology, 55(1), 1-6.
Russell, J. B. & Wilson, D. B. (1996). Why are ruminal cellulolytic bacteria unable to digest cellulose at low
pH? Journal of Dairy Science, 79(8), 1503-1509.
SAS. (2004). SAS/STAT User guide, Version 9.1.2. Cary, NC, USA: SAS Institute Inc.
Satter, L. & Slyter, L. (1974). Effect of ammonia concentration on rumen microbial protein production
in vitro. British Journal of Nutrition, 32(2), 199-208.
Schneider, B. H. & Flatt, W. P. (1975). The evaluation of
feeds through digestibility experiments. USA: University of
Georgia Press.
Silva, D. J. & Queiroz, A. C. (2002). Análise de alimentos:
métodos químicos e biológicos (3 ed.). Viçosa, Minas
Gerais, Brasil: Universdiade Federal de Viçosa. Silva, J. & Leão, M. (1979). Fundamentos de nutrição de
ruminantes (Vol. 1). Piracicaba: Livroceres.
Silva, P., Valadares Filho, S., Valadares, R., Cecon, P., Detmann, E. & Paixão, M. (2007). Valor energético do capim-elefante em diferentes idades de rebrota e estimativa da digestibilidade in vivo da fibra em detergente neutro. Arquivo Brasileiro de Medicina
Veterinaria e Zootecnia, 59(3), 711-718.
Stock, R., Laudert, S., Stroup, W., Larson, E., Parrott, J. & Britton, R. (1995). Effect of monensin and monensin and tylosin combination on feed intake variation of feedlot steers. Journal of Animal Science, 73(1), 39-44. Stradiotti Júnior, D., Queiroz, A. C., Lana, R. P., Pacheco,
C. G., Camardelli, M. M. L., Detmann, E., ... Oliveira, M. V. M. (2004). Ação do extrato de própolis sobre a fermentação in vitro de diferentes alimentos pela técnica de produção de gases. Revista Brasileira de
Zootecnia, 33(4), 1093-1099.
propolis extract in the diet of crossbred (½ Red Angus vs. ½ Nellore) bulls finished in feedlot: chemical composition and fatty acid profile of the
Longissimus muscle. Semina: Ciências Agrárias, 32(4),
1617-1626.
Van Soest, P. J. (1994). Nutritional ecology of the ruminant
(Vol. 1). Ithaca, NY, USA: Cornell University Press. Vargas, L. H., Lana, R. P., Mâncio, A. B. & Campos, J. M.
S. (2001). Influência de Rumensin®, óleo de soja e
níveis de concentrado sobre o consumo e os parâmetros fermentativos ruminais em bovinos. Revista
Brasileira de Zootecnia, 30(5), 1650-1658.
Zawadzki, F., Prado, I. N., Marques, J. A., Zeoula, L. M., Prado, R. M., Fugita, C. A., ... Maggioni, D. (2011a). Sodium monensin or propolis extract in the diet of Nellore bulls finished in feedlot: chemical
composition and fatty acid profile of Longissimus
muscle. Semina: Ciências Agrárias, 32(4), 1627-1636. Zawadzki, F., Prado, I. N., Marques, J. A., Zeoula, L. M.,
Rotta, P. P., Sestari, B. B., ... Rivaroli, D. C. (2011b). Sodium monensin or propolis extract in the diets of feedlot-finished bulls: effects on animal performance and carcass characteristics. Journal of Animal and Feed
Sciences, 20(1), 16-25.
Received on November 18, 2014. Accepted on May 19, 2015.