Artigo
*e-mail: [email protected]
ANTIFUNGAL ACTIVITY AGAINST POSTHARVEST FUNGI BY EXTRACTS FROM COLOMBIAN PROPOLIS
Erick A. Meneses, Diego L. Durango y Carlos M. García*
Facultad de Ciencias,Escuela de Química, Universidad Nacional de Colombia, Calle 59ª 63-020 Autopista Norte, AA 3840, Medellín, Colombia
Recebido em 10/7/08; aceito em 24/4/09; publicado na web 22/9/09
ANTIFUNGAL ACTIVITY AGAINST POSTHARVEST FUNGI BY EXTRACTS FROM COLOMBIAN PROPOLIS. The aims of the present study were to evaluate the antifungal properties of Colombian propolisextracts against Colletotrichum gloeosporioides and Botryodiplodia theobromae, and to isolate and identify the main constituents from the active extracts. Therefore, propolis samples were thoroughly extracted with n-hexane/methanol (EPEM), dichloromethane, ethyl acetate, and methanol. Experimental results indicated that mycelial growth of all selected microorganisms was reduced in culture media containing EPEM and dichloromethane fractions. Furthermore, through antifungal bioassay-guided fractionation, three known labdane-type diterpenes: isocupressic acid (1), (+)-agathadiol (2) and epi-13-torulosol (3) were isolated as the main constituents from the active fractions.
Keywords: antifungal activity; diterpenes; Colletotrichum.
INTRODUCTION
Anthracnose (caused by Colletotrichum gloeosporioides) and stem-end rot (caused by Botryodiplodia theobromae) are two important post-harvest diseases, which affects many tropical and subtropical fruits,1,2 including papaya (Carica papaya L.), avocado (Persea americana) and mango (Mangifera indica L.). The use of synthetic chemicals as fungicides is the primary method of control of postharvest fungal decay caused by both diseases. However, several fungicides are not used for postharvest treatment or have been remo-ved from the market due to possible toxicological risks.3 Therefore, there is a need to develop new and acceptable post- and pre-harvest disinfestation methods. In this way, the use of natural products, either directly as crude preparations, or as pure compounds, can be a very attractive method for postharvest disease control of mango, papaya and avocado fruits.
Propolis (or bee glue) is a natural resinous substance produced by Apis mellifera bees made up from parts of the plants, buds and exudates. In the beehive, propolis is thought to be used to seal ho-les, exclude draught and protect against external invaders. Its main function, however, is to prevent the decomposition of organic matter (i.e. creatures that have been killed by bees after an invasion) within the hive by inhibiting microbial growth.4 Therefore, the presence of propolis may provide an environment not suitable for the growth of fungi and other microorganisms, and consequently to keep the hive environment aseptic.5 In this way, one of the most frequent applications of bee glue is its antimicrobial activity against many gram-positive and gram-negative bacteria, yeasts and fungi, most of them associated with varying degrees of pathogenicity in humans.6,7 However, the action of propolis against phytopathogenic fungi has received little attention.4 Thus, this natural antifungal agent could be potentially exploited in controlling the growth of phytopathogenic fungi during post- and pre-harvest.
Reports by several authors support the fact that the chemical composition and biological activities of propolis depends on many different factors such as the geographical region, collecting time, and plant source.8,9 Thus, propolis originating from temperate zones (West Asia, Europe, and North America) possesses a quite
different chemistry from that of tropical propolis.10 In temperate-zone propolis, exudates of poplar trees (Populus spp.) and horse-chestnut trees (Aesculus hippocastanum) are mentioned as the main sources of European and North American propolis. However, in tropical regions, there are no Populus spp., and bees use other plant sources for the production of propolis.11,12 Thus, different compounds have been reported in tropical propolis, such as terpe-noids and prenylated derivatives of p-coumaric acids in Brazilian propolis,13,14 lignans in Chilean propolis,15 and polyisoprenylated benzophenones in Venezuelan, Brazilian, and Cuban propolis.10,16-19 Propolis from Colombia, however, has only recently begun to be studied; therefore, information concerning to its chemical com-position, phytochemical origins, and phytotherapeutic properties is still especially limited. The Colombian lora presents a great biodiversity with a high percentage of endemic plant species and consequently the chemical investigation of Colombian propolis appeared to be very interesting. Moreover, although propolis is produced and used in Colombia in folk medicine, in cosmetology and in the food industry, its chemical composition and biological activities have little been evaluated.
Considering that only a few studies have been reported on the composition of Colombian propolis, and even less about its in vitro effect against phytopathogenic fungi, the objective of this work was to evaluate the chemical composition and antifungal potential of their constituents on the growth of Colletotrichum gloeosporioides (Penz.) Sacc and Botryodiplodia theobromae,two well-known pre- and postharvest pathogens that give rise to important plant diseases and considerable crop economic losses.
EXPERIMENTAL
Propolis samples
General experimental procedure
Thin-layer (TLC) and column (CC) chromatography
TLCwas achieved on precoated Merck Kieselgel 60 F254 (0.25 or 0.50 mm thickness); the compounds were visualized by spraying plates with aqueous solution 5% FeCl3 and/or 1% vanillin in 96% sulfuric acid followed by brief heating (~120 °C, 1 min). Column chromatography (CC) was performed over Sephadex LH-20 (Amer-sham Bioscience, Sweden) or Silica gel 60 (0.040-0.063 mm; Merck). Preparative high performance liquid chromatography (HPLC)
Preparative HPLC (Agilent 1100 UV/Vis, model LC-20) was used with a Zorbax SB-CN column for the separation of two of the isolated main compounds. HPLC separation was done with an iso-cratic method using n-hexane-EtOAc, 85:15 at 4.0 mL/min as eluent. Detection was achieved at 254, 280 and 310 nm.
Gas chromatography-mass spectrometry (GC-MS) analysis GC-MS analysis was performed on a Hewlett-Packard 6890 gas chromatograph (Agilent Technologies) coupled to an Agilent MSD 5973 mass detector under electron impact ionization. The separation was carried out using a 30 m x 0.25 mm x 0.25 μm DB-35MS column (Agilent Technologies). Propolis samples were analyzed after derivati-zation using a method described by Silici and Kutluca.20 Briely, about 1mg of the propolis samples was mixed with 50 μL of dry pyridine and 100 μL bis(trimethylsilyl)triluoracetamide (BSTFA) and 1% trimethylchlrosilane (TMCS) in a sealed glass tube for 30 min at 100 °C. Sample volume of 1 μL was injected and analyzed by GC-MS with the column held initially at 100 °C for 5 min and then increased to 150 °C and then kept at 150 °C for 2 min. Finally, temperature was increased to 280 °C with a 2 °C/min heating and the temperature was kept 280 °C for 60 min for samples. The injection was carried out in split mode at 250 °C. The GC was operated in constant low mode (1 mL/min) with helium (99.996% purity) as carrier gas. The GC-MS peaks were identiied by comparison with data from literature and the proiles from the Nist 02 mass spectral database.
Structure elucidation
Infrared (IR) spectra of the isolated compounds were recorded on a Bruker spectrophotometer (model IFS 28/55), in the frequency range 4000-400 cm-1. Nuclear magnetic resonance, NMR, spectra (1H, 13C, COSY, DEPT, HMQC and HMBC) were determined with a Bruker AMX 300 spectrometer with 300.12 MHz for 1H- and 75.42 MHz for 13C-nuclei. Tetramethylsilane (TMS) was used as internal standard for NMR spectra measured in deuterochloroform (CDCl3); chemical shifts are expressed in ppm units downield from TMS and coupling constants (J) are in Hz. Electron impact mass spectra (EI-MS) measurements of isolated and derivatized compounds were obtained using GC-MS. Chromatographic conditions were the same as described above. All chemicals were analytical grade and used without further puriication.
Extraction and isolation of the main compounds from active extracts
Propolis samples were ground and thoroughly extracted (in the ab-sence of bright light, at room temperature) successively with n-hexane, dichloromethane, ethyl acetate and methanol for 24 h by percolation. The extract in n-hexane was further fractionated with methanol and iltered through Whatman no. l ilter paper, to obtain the methanol-soluble fraction from n-hexane extract (EPEM). This treatment allowed discarding a wax, insoluble in methanol. All extracts were evaporated to dryness under vacuum using a rotary evaporator at 40 °C and weighed.
The CH2Cl2-soluble fraction (10.26 g), which showed the greatest antifungal activity according to established statistics parameters, was subjected to Si gel column chromatography with n-hexane-EtOAc gradient and further then ethanol and methanol to give six fractions [fraction A, n-hexane and 90% n-hexane-EtOAc eluate, 2.6710 g; fraction B, 80% n-hexane-EtOAc eluate, 1.5214 g; fraction C, 70% n-hexane-EtOAc eluate, 0.4796 g; fraction D, 50% n-hexane-EtOAc eluate, 1.2483 g; fraction E, ethanol eluate, 2.1456 g; fraction F, methanol eluate, 1.5688 g].
In the same way, the methanol-soluble fraction from n-hexane extract (EPEM, 10.29 g) was chromatographed on silica gel; elution was performed with a n-hexane-EtOAc gradient system and further ethanol and methanol. Several fractions were collected and separated into ten groups (A-J), by TLC: fraction A and B: n-hexane eluate, 0.1119 g; fraction C, D and E: 5% EtOAc-n-hexane eluate, 4.9506 g; fraction F: 10% EtOAc-n-hexane eluate, 0.5871 g; fraction G: 20% EtOAc-n-hexane eluate, 0.342 g; fraction H e I, ethanol eluate, 2.3443 g; fraction J: MeOH eluate, 1.129 g. Fractions were monitored by TLC and antifungal assay.
Sub-fractions selected on the basis of its activity in the antifungal bioassays were: fraction C from CH2Cl2 extract and fraction I from EPEM. The fraction C (379.6 mg) from dichlorometane extract was fractionated by size-exclusion column chromatography over Sephadex LH-20 (100 x 2 cm) using n-hexane-CH2Cl2-MeOH (50:25:25, v/v) as eluent (10 fractions were obtained). Samples 5, 6 and 7 were assembled (88.2 mg) according with its similar composition and repeated column chromatography of this resultant fraction over silica gel, followed by preparative TLC (n-hexane, EtOAc, ethyl ether: 85:15:40 as eluent), yielded the compounds: (1) (11.7 mg) and (2) (6.5 mg).
Fraction I (0.5818 g) obtained from EPEM extract through CC using ethanol as eluent was applied in succession to column chromatography on Sephadex LH-20 with n-hexane-CH2Cl2-MeOH 2:1:1 (20 fractions) and further on Si gel with a n-hexane-EtOAc gradient (0, 1, 2, 5, 10, 20, 50, 100% EtOAc) of sub-fractions 11-14 (43.5 mg) yielding seven fractions of increasing polarity. Subsequent puriication from sub-fractions 3-5 by preparative HPLC using n-hexane, EtOAc, 85:15 as solvent system, afforded the compounds (1) (7.0 mg) and (3) (14.3 mg).
Isocupressic acid (1) was obtained as a colorless semisolid. FT-IR (KBr, cm-1): 3376, 3084, 2933, 2849, 1701, 1643, 1445, 1377, 1226, 1179, 887. 1H NMR (CDCl
3, 300 MHz): δ 5.39 (1H, t , J = 6.9, H-14), 4.86 (1H, s, H-17b), 4.53 (1H, s, H-17a), 4.16 (2H, d, J = 6.9, H-15), 2.39 (2H, m, H-7), 2.13 (2H, m, H-12), 1.90-1.83 (6H, m, H-1, H-2, H-3, H-4, H-5, H-9), 1.68 (3H, s, Me-16), 1.63-1.25 (3H, m, H-2, H-11), 1.24 (3H, s, Me-18), 1.05-0.65 (2H, m, H-1, H-3), 0.60 (3H, s, Me-20); 13C NMR (CDCl
3, 75 MHz): δ184.1 (C-19), 148.4 (C-8), 140.9 (C-13), 123.3 (C-14), 106.9 (C-17), 59.8 (C-15), 56.7 (C-5), 56.0 (C-9), 44.6 (C-4), 40.9 (C-10), 39.6 (C-1), 39.2 (C-7), 38.8 (C-3), 38.4 (C-12), 29.4 (C-18), 26.5 (C-6), 22.4 (C-11), 20.3 (C-2), 16.8 (C-16), 13.2 (C-20); EIMS: m/z (%) 302 (M+-18: 5), 287 (M+-18-15: 30), 121 (100), 107 (65), 81 (74).
Agathadiol (2) was obtained as a white semisolid. FT-IR (KBr, cm-1): 3287, 2931, 1646, 1457, 1027. 1H NMR (CDCl
3, 300 MHz): 5.39 (1H, t , J = 6.9, H-14), 4.83 (1H, s, H-17b), 4.52 (1H, s, H-17a), 4.16 (2H, d, J = 6.9, H-15), 3.76 (1H, d, J = 10.8, H-19a), 3.39 (1H, d, J = 10.8, H-19b), 2.37 (1H, m, H-7), 1.93 (1H, m, H-12), 1.85-1.80 (6H, m, H-1, H-2, H-3, H-6, H-7, H-9), 1.67 (3H, s, Me-16), 1.60-1.28 (6H, m, H-1, H-2, H-5, H-6, H-11), 0.98 (3H, s, Me-18), 0.88-0.85 (1H, m, H-3), 0.65 (3H, s, Me-20); 13C NMR (CDCl
Epi-13-torulosol (3) was isolated as a white amorphous powder. FT-IR (KBr, cm-1): 3425, 3293, 3068, 2936, 1600, 1585, 1239. 1H NMR (CDCl3, 300 MHz): δ 5.92 (1H, dd , J = 17.4, J = 10.8, H-14), 5.21 (1H, dd, J = 17.4, J = 1.2, H-15a), 5.06 (1H, dd, J = 10.8, J = 1.2, H-15b), 4.82 (1H, s, H-17b), 4.53 (1H, s, H-17a), 3.76 (1H, d, J = 10.9, H-19a), 3.39 (1H, d, J = 10.9, H-19b), 1.29 (3H, s, Me-18), 0.98 (3H, s, Me-16), 0.65 (3H, s, Me-20); 13C NMR (CDCl
3, 75 MHz): δ 148.6 (C-8), 145.7 (C-14), 112.1 (C-15), 107.2 (C-17), 74.1 (C-13), 65.5 (C-19), 57.8 (C-9), 56.8 (C-5), 41.8 (C-12), 40.2 (C-1), 39.4 (C-4), 39.3 (C-10), 39.1 (C-7), 35.9 (C-3), 28.1 (C-16), 27.5 (C-18), 24.9 (C-6), 19.4 (C-2), 18.3 (C-11), 15.7 (C-20). EIMS: m/z (%) 288 (M+-18: 5), 257 (53), 107 (79), 95 (97), 81 (100), 43 (89).
Antifungal assays of extracts and fractions
Colletotrichum gloeosporioides was originally obtained from anthracnose diseased fruits of papaya (Carica papaya) and mango (Mangifera indica). Botryodiplodia theobromae was isolated from avo-cado (Persea americana) fruits infected with stem-end rot. Fungi were morphological and molecularly characterized and pleasantly provide by Phytopathology Laboratory of National University of Colombia (Medellín). The microorganisms used for the bioassays were selected among some of the most economically important fungus to control in Colombia. The effects of plant crude extracts and fractions on colony growth of C. gloeosporioides and B. theobromae were performed by the agar dilution method. Briely, antifungal activity was evaluated on these fungi at propolis extract concentrations of: 100, 250, 500 and 1000 mg of propolis extract/L of culture medium (all subfractions, however, were only evaluated at the concentration of 250 mg/L against phytopa-thogenic fungus C. gloeosporioides isolated from mango). Fungal plugs (0.4mm in diameter) were obtained and placed at the center of Petri dishes in a potato–dextrose–agar (PDA) culture media with extracts (fractions or sub-fractions) dissolved in ethanol:tween 60, 1:1 (v/v) at the various concentrations. PDA plates containing only ethanol:tween 60, 1:1 (v/v) were used as control plates. The cultures were incubated at 24 ± 2 °C and the radial growth of mycelia measured daily during 7 days for C. gloeosporioides and 2 days for B. theobromae. The second one presented a fastradial growth of mycelium and reached the edge of the platesafter 2 d of inoculation. The radial mycelial growth was measured daily, and the percentage of inhibition was calculated on the basis of growth in control plates as:
Percentage of mycelial growth inhibition
x 100
The antifungal effect was measured under a random design with three replications.
Antifungal assays of isolated compounds
Antifungal activity of isolated compounds was evaluated by the paper disk-agar diffusion method. Test plates (diameter: 15 cm) were prepared with PDA agar medium and inoculated in surface with a spore suspension of fungi (the concentration was adjusted to 106 CFU/mL). Sterile paper disks (diameter: 1 cm, Whatman no 1) were impregnated with the substances until to reach concentrations of 1.0 x 10⁴ and 5.0 x 10⁴ mg/kg of paper, or with the commercial fungi-cides, Chlorothalonil (50% active ingredient) and Mancozeb (80% active ingredient) as standard antifungal agents. Impregnated disks were placed on the assay plates. Discs soaked in sterilised distilled water without extracts were used as negative control. The fungi were cultivated in Potato Dextrose (PD) agar at 25 °C. After 24-72 h
incu-bation, zones of inhibition (mm in diameter) were recorded. For each compound, two replicate trials were conducted against each fungus. Statistical analysis
Analysis of variance was performed. To determine differences in radial growth between samples and controls, Duncan’s and Tukey’s multiple pairwise comparisons tests were applied to the results (p -levels at 0.01 and below were considered signiicant).
RESULTS AND DISCUSSION
Extraction yield
Table 1 shows an overview of the propolis used, as well as the extraction yields, for the extracts. Bee glue samples, PROP1 and PROP2, were collected during the dry (April-October, 2006) and rainy (December-March, 2006) seasons, respectively. The extraction yields ranged from 0.4% for EtOAc-extract to 36.1% for CH2Cl2-extract, both proceeding from PROP 1. EtOAc-extracts from both propolis samples gave the lowest yields; 0.4 and 0.5% for PROP1 and PROP2, respectively. According to the results of the TLC and GC screening, the qualitative chemical composition for both propolis was very similar. EPEM fractions revealed a complex chemical composition with various peaks at diffe-rent retention times whereas CH2Cl2 fraction presented few compounds (Figure 1S, supplementary material). However, the GC chromatogram pattern of EPEM and CH2Cl2 extracts from dry season was very similar from those of samples collected on rainy season. Thus, seasonal variations in bee glue composition are not signiicant and only minor quantitative differences were detected. Some main peaks observed on GC-MS were identiied by comparison with Nist database corresponding to aromatic acids, fatty acids, sesqui- and diterpenes, lavonoids, among others. The most signiicant constituents detected in propolis extracts using GC-MS were: fatty acids and their esters (palmitic acid, stearic acid, oleic acid), aromatic acids (cinnamic acid, dihydrocinnamic acid, and p -methoxycin-namic acid), sesquiterpenes (δ-cadinene, β-caryophyllene, β-gurjunene, aromadendrene), diterpenes ((+)-totarol, ferruginol, manool), triterpenes (lupeol), lavonoids (naringenin, sakuranetin) among others. Consequen-tly, propolis extracts proceeding from propolis collected during the dry and rainy seasons were combined according to polarity in order to obtain only four extracts in a suitable amount for subsequent analysis.
In vitro antifungal activity
The effect of different concentrations of the four extracts of Co-lombian propolis against phytopathogenic fungi is shown in Table 2. The reduction in radial mycelial growth of fungi in culture PDA media with CH2Cl2 and EPEM extracts was higher than those with EtOAc and Table 1. Extraction yield for Colombian propolis collected during the dry (PROP1) and rainy seasons (PROP2)
Extracts
PROP1 (145 g) Composition
PROP2 (62 g) Composition
Grams Percent Grams Percent
Waxes 40.60 28.0 18.15 29.3
Fraction EPEM 31.80 21.8 15.80 25.5
Fraction CH2Cl2 52.60 36.1 17.00 27.5
Fraction EtOAc 0.52 0.4 0.30 0.5
Fraction MeOH 5.00 3.4 3.60 5.8
MeOH extracts. The phytopathogenic fungi, C. gloeosporioides, isola-ted from papaya and mango, as well as B. theobromae were sensitive to both active extracts. In addition, antifungal activities of CH2Cl2 and EPEM samples were found to enhance with the increase in concentra-tion of the extracts. The maximum inhibiconcentra-tion level was 47.6% achieved by CH2Cl2-soluble fraction against C. gloeosporioides from mango.
The dichloromethane extract was found to possess higher degree of antifungal activity than EPEM extract against C. gloeosporioides (both strains) at each concentration between 250 and 1000 mg/L. Particularly, at 500 mg/L, CH2Cl2 fraction was observed to possess signiicantly (Tukey, p≤0.01) higher (30.8%) antifungal activity against the strain proceeding from papaya than that of EPEM extract (24.0%). The phytopathogenic fungus B. theobromae, however, was more sensitive to EPEM extract.
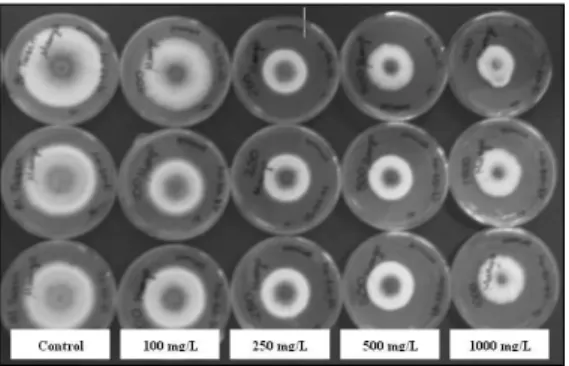
Culture PDA media with CH2Cl2-soluble fraction resulted in sig-niicant (Tukey and Duncan, p≤0.01) reduction on colony development of C. gloeosporioides isolated from mango (Figure 1) between 100 and 1000 mg/L and for the fungus C. gloesporioides from papaya, the same parameter was also signiicant between 250 and 1000 mg/L. Howe-ver, comparing the myceliar growth inhibition for each concentration evaluated revealed that the strain derived from mango was the most sensitive fungus to the treatments with the above mentioned propolis sample. Otherwise, CH2Cl2 extract showed lower degree of antifungal activity against B. theobromae than that observed with both strains of C. gloeosporioide; at 1000 mg/L concentration, phytopathogenic fungi from mango and papaya were inhibited 47.6 and 38.1%, respectively, while that proceeding for avocado had the lower inhibition at this con-centration, being 23.5%. Several common compounds, corresponding mainly to aromatic acids, were identiied in CH2Cl2 soluble fraction by GC-MS analysis: the three majority peaks were identiied as cinnamic acid (Rt = 20.48 min), p-methoxycinnamic acid (Rt = 57.46 min) and dihydrocinnamic acid (Rt = 34.28 min).
Additionally, EPEM fraction demonstrated signiicant myce-lial growth inhibition of the fungus B. theobromae (Tukey and Duncan, p≤0.01) at concentrations between 250 and 1000 mg/L. The concentration of 100 mg/L was not statistically different from the control. On the other hand, concentrations from 100 to 1000 mg/L of EPEM, showed signiicant antifungal activity against both strains of C. gloeosporioides, (Tukey and Duncan, p≤0.01). Radial growth was inhibited above 39 and 23% at 500 mg/L against the phytopathogenic fungus C. gloesporioides, from mango and papaya, respectively. The maximum inhibition level achieved by EPEM fraction was 39.8% against C. gloeosporioides from mango. The chromatographic proiles of the EPEM extract showed a wide range of compounds of varying polarity. The GC-MS analysis allowed the identiication of fatty acids and their esthers (peaks with retention times, Rt, from 35.0 to 53.0 min), sesqui- and diterpenes, princi-pally. EPEM sample obtained during rainy season presented as main components fatty acid methyl esters (palmitic acid methyl ester, Rt = Table 2. Effect of propolis extracts on mycelial growth of C. gloeosporioides from mango and papaya, and B. theobromae from avocado Propolis
extracts
Concentration (mg/L)
Radial mycelial growth (mm) Inhibition of mycelia growth (%)
C. gloeosporioides (mango)
C. gloeosporioides
(papaya) B. theobromae
C. gloeosporioides (mango)
C. gloeosporioides
(papaya) B. theobromae
EPEM
CH2Cl2
EtOAc MeOH 100 250 500 1000 control 100 250 500 1000 control 100 250 500 1000 control 100 250 500 1000 Control 40.1* 32.3* 29.2* 29.1* 48.3 34.2* 33.4* 29.2* 26.2* 50.0 48.1 48.1 47.1 46.2 49.4 41.1 40.2* 40.1* 38.3* 42.5 40.1* 38.1* 35.2* 34.2* 46.3 49.0 40.1* 36.0* 32.2* 52.0 52.0 50.0 48.1* 48.1* 54.4 43.1 43.0 42.0 42.1 44.4 43.2 36.0* 35.1* 34.1* 48.0 42.0 40.1* 38.2* 35.2* 46.0 36.0 36.1 34.1 35.0 37.1 43.1 43.1 41.0 41.0 43.1 17.0 33.1 39.5 39.8 0 31.6 33.2 41.6 47.6 0 2.6 2.6 4.7 6.5 0 3.3 4.4 5.7 9.9 0 13.4 17.7 24.0 26.1 0 5.8 22.9 30.8 38.1 0 4.4 8.1 11.6 11.6 0 2.9 3.2 5.4 5.2 0 10.0 25.0 26.9 29.0 0 8.7 12.8 17.0 23.5 0 3.0 2.7 8.1 5.7 0 0 0 4.9 4.9 0 Values represent means of measurements made on three independent plates per treatment. * p≤0.01 vs. respective control.
36.05 min and stearic acid methyl ester, Rt = 44.69 min). Otherwise, EPEM extract obtained from propolis collected in the dry period presented as majority peaks those corresponding to (+)-totarol (Rt = 57.88 min) and manool (Rt = 52.98 min).
However, EtOAc and MeOH extracts demonstrated a slight fun-gistatic activity even at the highest concentrations evaluated, 500 and 1000 mg/L. Results showed that, for these fractions, there were no signiicant differences between samples with 100 and 250 mg/L of extracts and the control. Therefore, high polarity fractions obtained from the partition between immiscible solvents showed the lowest values of percentage of inhibition.
The dichloromethane fraction that showed the highest antifungal activity was further fractioned (6.0 g) into six fractions (fractions A–F) on silica gel CC eluting with petroleum ether–ethyl acetate (9:1, 8:2, 7:3, 1:1, v/v), ethanol and methanol. All sub-fractions were control-led by TLC (Figure 2, right) and samples C-G were only tested for antifungal activities against C. gloeosporioides isolated from mango (fractions A and B collected with petroleum ether-ethyl acetate, 9:1 and 8:2, were discarded because they were mainly constituted of waxes). The antifungal effect of the fractions was only measured against this fungus because its radial growth was shown to be more homogeneous (colonies were completely circular and compact) than that on C. glo-esporioides proceeding from papaya, and B. theobromae.Activity was determined under a random design with two replications. TLC plates showed few spots for each subfraction evaluated with retention factor values of components varying in a narrow range. As can be seen from Figure 2 (left), all subfractions (C-F) exhibited considerable antifungal activity; culture PDA media with samples C-F, resulted in signiicant (Tukey and Duncan, p≤0.01) reduction on colony development of fungus at 250 mg/L. However, the sub-fraction C collected with the elution system petroleum ether-ethyl acetate, 7:3 v/v, demonstrated the highest antifungal activity (40% of mycelial growth inhibition).
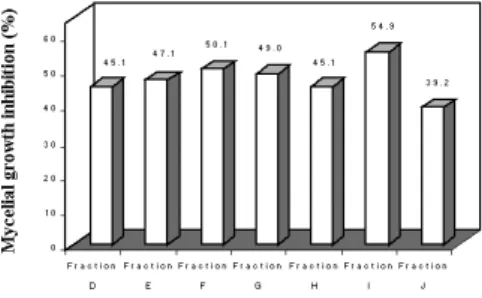
In the same way, the methanol-soluble fraction from n-hexane (EPEM) that showed signiicant antifungal activity against the phyto-pathogenic fungi evaluated, was fractioned into ten fractions (fractions A–J) on silica gel CC eluting with petroleum ether, petroleum ether– ethyl acetate (9.5:0.5, 9:1, 8:2, v/v), ethanol and methanol. Fraction A and B, collected using the elution system petroleum ether, and fraction C obtained with petroleum ether-ethyl acetate (9.5:0.5, v/v) were not evaluated (mostly waxy nature substances). Samples D-J exhibited signiicant antifungal activity (Tukey and Duncan, p≤0.01), at the concentration of 250 mg/L, against C. gloeosporioides, isolated from mango (Figure 3). The mycelial growth inhibition varies from 39.2 % (fraction J) to 54.9% (fraction I).
Main compounds from antifungal fractions
Sub-fraction C from dichloromethane extract that showed very good antifungal activity at low concentrations was loaded onto si-lica gel column and the two major compounds were isolated. Their physical and spectral data are as follows.
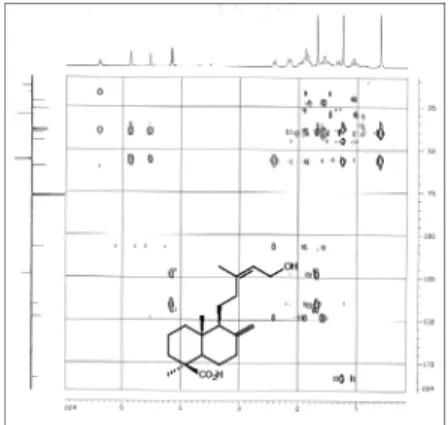
Compound (1) was isolated as a colorless semisolid. The mole-cular formula of unknown compound (1) was assigned as C20H32O3 by its NMR spectroscopic analyses and EIMS measurements. Retention time on GC was 26.19 min at the same chromatographic conditions described above. EIMS: m/z (%) 302 (M+-18: 5), 287 (M+-18-15: 30), 121 (100), 107 (65), 81 (74). IR absorptions at 3376 and 1701 cm-1 showed the presence of a carboxylic group. The 1H NMR spectrum of (1) displayed characteristic signals of a bicyclic labdane-type diterpene, particularly an allylic alcohol moiety R2C=CHCH2OH characterized by the oleinic proton signal at δ 5.39 (1H, t, J = 6.9), the secondary alcohol resonances appearing at δ 4.16 (2H, d, J = 6.9), three singlet methyl groups at δ 0.60, 1.24 and 1.68, and an exocyclic double bond at δ 4.86 (s) and 4.53 (s) (the HMQC experiment identi-ies that both protons were directly attached to the same carbon at δ
106.9). In its 13C NMR spectrum, 20 resonances were subclassiied by DEPT experiments into three methyls, nine methylenes (one sp2 methylene), three methines (one sp2 methine), and ive quaternary carbons (three sp2 carbons; two oleinic and one carboxylic carbons). All signals in the above spectra showed that compound (1) had a ske-letal structure indicated as 15-hydroxylabda-8(17),13E-dien-19-oic acid. This was further conirmed by HMQC and HMBC experiments. Thus (1) was designated as isocupressic acid. These data are in good agreement with those observed in the literature.21-23
Compound (2) was isolated as a white semisolid. The molecular formula C20H34O2 of compound (2) was assigned by NMR spectros-copic analyses and EIMS measurements. Retention time on GC was 25.08 min at the same chromatographic conditions described above. EIMS: m/z (%) 291 (M+-15; 10), 257 (50), 189 (37), 121 (40), 95 (100), 81 (78). The IR spectrum of (2) showed the absorptions of both hydroxyl groups at 3287 cm-1. The 1H NMR spectrum of (2) indicated three methyl groups (singlet at δ 1.67, 0.98 y 0.65), an exocyclic methylene group (δ 4.83 and 4.52), an allylic alcohol moiety similar than those on isocupressic acid characterized by the oleinic proton signal at δ 5.39 (1H, t, J = 6.9) and the secondary alcohol resonances appearing at δ 4.16 (2H, d, J = 6.9) (the 1H-1H COSY spectrum shows a correlation between these two protons). In addition, the 1H NMR of compound (2) showed resonances at
δ 3.76 (1H, d, J = 10.8) and 3.39 (1H, d, J = 10.8) corresponding to one primary alcohol; the HMQC experiment identiies that both protons were directly attached to the same carbon, C-19. The 13C NMR spectrum of (2) displayed 20 resonances, attributable to three methyls, ten methylenes (two oxygenated methylenes and one sp2 Figure 2. Antifungal activities (left) and TLC chromatogram (right) of
dichlo-romethane subfractions (left). All fractions were evaluated at the concentration of 250 mg/L against phytopathogenic fungus C. gloeosporioides isolated from mango. The results are means of two different experiments. TLC was developed in n-hexane/ethyl acetate 70:30 sprayed with 5% ferric chloride and 1% vanillin in 96% sulfuric acid followed by brief heating
reasons; irstly, it has been previously shown in the literature that a single propolis component does not have an activity greater than that of the extract and its inhibitory effect depends on the synergism of many compounds.13,27 Secondly, due to the low recovery of the labdane-type diterpenes, the compounds were consequently tested at very low concentrations. Thirdly, it can be argued that the lack of effective fungi mycelial growth inhibition is a result of the paper disc retaining the active components and thereby preventing its diffusion into the PDA agar media. This assumption is in agreement with the fact that chloratalonil, a commercial antifungal agent commonly used to control anthracnose, was not active against Colletotrichum sp. in the paper disc assay. Chlorothalonil had previously demonstrated a potent antifungal activity against both strains of Colletotrichum sp. in the agar dilution method with a MIC (minimum inhibitory concentration which completely inhibited mycelial growth) between 400 and 450 mg/L (Data not shown). However, this result was not evident in the paper disc assay presumably for the reasons stated above. Due to the insuficient quantity of the isolated compounds, antifungal assays testing these hypotheses were not performed. Hence, paper disk-agar diffusion method is not suitable for comparison of antifungal activity of labdane-type diterpenes since the concentration of compounds that permitted measurement of the diameter of the inhibition zone is relatively high, and diterpenes samples display deicient diffusion. Due to insuficient quantity of the isolated compounds an antifungal assay considering these factors was not done.
CONCLUSIONS
The increasing social and economic repercussions of fungi food contamination require the development of new antifungal agents to provide safer foods. Thus propolis are promising natural antifungal agents. The present results are the irst to show that extracts from Co-lombian propolis can act as antifungal agents against Colletotrichum sp. and Botryodiplodia sp. Labdane-type diterpenes could play role in the antifungal effect of EPEM and dichloromethane propolis extracts. SUPPLEMENTARY MATERIAL
Available in http://quimicanova.sbq.org.br. ACKNOWLEDGEMENT
This work was supported by a project of DIME (Dirección Nacio-nal de Investigaciones de la Universidad NacioNacio-nal de Colombia-Sede Medellín)-Grant No. 030802735. We grateful to Drs. L. F. Echeverri, Winston W. Fletcher and L. F. Torres (L.Q.O.P.N./University of An-tioquia) for recording the NMR spectra. The authors also would like to thank Dr. T. Lobo E. for proofreading the manuscript.
REFERENCES
1. Prusky, D.; Annu. Rev. Phytopathol. 1996, 34, 413.
2. Snowdon, A. L.; Color Atlas of Postharvest Diseases and Disorders of Fruit and Vegetables, CRC Press Inc.: Boca Raton, 1990, vol. 1. 3. Adaskaveg, J. E.; Förster, H.; Sommer, N. F.; Postharvest Technology
of Horticultural Crops, University of California Publication: California, 2002, vol. 3311, p. 163.
4. Quiroga, E. N.; Sampietro, D. A.; Soberón, J. R.; Sgariglia, M. A.; Vattuone, M. A.; J. Appl. Microbiol. 2006, 101, 103.
5. Kartal, M.; Yýldýz, S.; Kaya, S.; Kurucu, S.; Topçu, G.; J. Ethnopharmacol. 2003, 86, 69.
6. Burdock, G. A.; Food Chem. Toxicol. 1998, 36, 347.
7. Kujumgiev, A.; Tsvetkova, I.; Serkedjeva, Y.; Banskova, V.; Christov, R.; methylene), three methines (one sp2 methine), and four quaternary
carbons (two sp2 carbons) through a DEPT experiment. Thus (2) was assigned as a labdane-type diterpene. The skeletal structure of (2) was conirmed on the basis of its HMQC and HMBC spectra. By spectroscopic methods and comparing the IR, 1H- and 13C-NMR and MS spectral information with known compounds, (2) was identiied as (+)-agathadiol, [labda-8(17),13-diene-15,19-diol].24,25
In addition, fraction I from EPEM extract was submitted to frac-tionation by column chromatography on Sephadex LH-20 and further silica gel, followed by preparative HPLC to yield compounds (1) and (3). The molecular formula C20H34O2 of compound (3) was assigned by NMR spectroscopic analyses. The analyses of 1H NMR spectrum indicated the existence of mono-substituted oleinic proton resonances at δ 5.92 (1H, dd, J = 17.4, 10.8), 5.21 (1H, dd, J = 17.4, 1.2) and 5.06 (1H, dd, J = 10.8, 1.2), exocyclic oleinic proton signals at δ 4.82 (s) and 4.53 (s), one primary alcohol proton resonance at δ 3.76 (1H, d, J = 10.9) and 3.39 (1H, d, J = 10.9) and three singlet methyls at δ
1.29, 0.98 and 0.65. In its 13C NMR spectrum, 20 resonances were subclassiied by DEPT experiments into three methyls, ten methylenes (one oxygenated methylene and two sp2 methylenes), three methines (one sp2 methine), and four quaternary carbons (one oxygenated and one sp2 carbons). All signals in the above spectra showed that compound 3 had a bicyclic-labdane diterpenoid skeleton with one allylic hydroxyl group, RC(CH3)(OH)CH=CH2, which was further conirmed by HMQC and HMBC experiments. Also the structure was proposed on the basis of mass spectra, using typical fragments and molecular ions, and as well as by comparison of their mass spectra with literature spectra. EIMS m/z (%): 288 (M+-18: 5), 257 (53), 107 (79), 95 (97), 81 (100), 43 (89). On the basis of spectral examination and comparison with literature data, the compound (3) was identiied as epi-13-torulosol, [8(17),14-1abdadien-13S, 19-diol].26
Antifungal activities of isolated compounds
It was not possible to demonstrate antifungal effect of the isolated compounds and at evaluated concentrations by means of the paper disc assay. The mean zone of inhibition of the compounds assayed against the phytopathogenic fungi ranged between 3 and 5 mm. Yet no statisti-cally signiicant differences were observed with respect to the negative control. Among the commercial fungicides tested as positive control, the mancozeb showed the best inhibition with a signiicant antifungal activity (Tukey and Duncan, p≤0.01) against the three phytopathogenic fungi. The produced zones of inhibition using mancozeb ranged from 26 to 32 mm. However, the chloratalonil antifungal positive control produced zones of inhibition that ranged from 6 to 8 mm.
Popov, S.; J. Ethnopharmacol. 1999, 648, 235.
8. Bankova, V.; Popova, M.; Bogdanov, S.; Sabatini, A. G.; Z. Naturforsch. 2002, 57c, 530.
9. Sforcin, J. M.; Fernández, A.; Lopes, C. A. M.; Banskova, V.; Funari, S. R. C.; J. Ethnopharmacol. 2000, 73, 243.
10. Cuesta-Rubio, O.; Piccinelli, A. L.; Campo, M.; Márquez, I.; Rosado, A.; Rastrelli, L.; J. Agric. Food Chem. 2007, 55, 7502.
11. Bankova, V.; Castro, S. L.; Marcucci, M. C.; Apidologie 2000, 31, 3. 12. Park, Y. K.; Alencar, S. M.; Aguiar, C. L.; J. Agric. Food Chem.2002,
50, 2502.
13. Marcucci, M.; Curr. Top. Phytochem. 1995, 2, 115.
14. Bankova, V.; Dyulgerov, A.; Popov, S.; Marekov, N. A.; Z. Naturforsch. 1987, 42, 147.
15. Valcic, S.; Montenegro, G.; Timmermann, B.; J. Nat. Prod.1998, 61, 771. 16. Tomás-Barberán, F. A.; García-Viguera, C.; Vit-Olivier, P.; Ferreres, F.;
Tomás-Lorente, F.; Phytochemistry 1993, 34, 191.
17. Trusheva, B.; Popova, M.; Naydenski, H.; Tsvetkova, I.; Rodriguez, J. G.; Bankova, V.; Fitoterapia 2004, 75, 683.
18. Porto, A. L. M.; Machado, S. M. F.; De Oliveira, C. M. A.; Bittrich, V.; Amaral, M. C. E.; Marsaioli, A. J.; Phytochemistry 2000, 55, 755. 19. Marquez, I.; Campo, M.; Cuesta-Rubio, O.; Piccinelli, A. L.; Rastrelli,
L.; J. Nat. Prod. 2005, 68, 931.
20. Silici, S.; Kutluca, S.; J. Ethnopharmacol.2005, 99, 69.
21. Yamamoto, H.; Chida, T.; Abe, T.; Hanari, N.; Ono, Y.; Bull. Col. Edu. Ibaraki Univ. (Nat. Sci.) 2006, 55, 1.
22. Chiang, Y. M.; Liu, H. K.; Lo, J. M.; Chien, S. C.; Chan, Y. F.; Lee, T. H.; Su, J. K.; Kuo, Y. H.; J. Chin. Chem. Soc.(Taipei) 2003, 50, 161. 23. Fang, J. M.; Chen, Y. C.; Wang, B. W.; Cheng, Y. S.; Phytochemistry
1996, 41, 1361.
24. Enzell, C.; Acta Chem. Scand. 1961, 15, 1303.
25. Tanaka, K.; Guo, H.; Kiuchi, Y.; Nakajima, J.; Kurosawa, M.; Yano, Y.; Hanari, N.; Yada, Y.; Yamamoto, H.; Bull. Col. Edu. Ibaraki Univ. (Nat. Sci.). 2007, 56, 23.
26. Su, W.; Fang, J.; Cheng, Y.; Phytochemistry 1994, 37, 1109.
Material Suplementar
*e-mail: [email protected]
ANTIFUNGAL ACTIVITY AGAINST POSTHARVEST FUNGI BY EXTRACTS FROM COLOMBIAN PROPOLIS
Erick A. Meneses, Diego L. Durango y Carlos M. García*
Facultad de Ciencias,Escuela de Química, Universidad Nacional de Colombia, Calle 59ª 63-020 Autopista Norte, AA 3840, Medellín, Colombia
Figure 1S. GC chromatograms of CH2Cl2, EPEM extracts and isolated compounds from Colombian propolis
Figure 2S. 1H NMR for compound (3) (300 MHz, CDCl 3)
Figure 3S. 13C (JMOD) NMR for compound (3) (75 MHz, CDCl 3)
Figure 4S. 1H-1H COSY for compound (3) (300 MHz, CDCl 3)
Figure 5S. HMBC for compound (3) (1H/13C NMR 300 MHz/75 MHz, CDCl 3)
Figure 7S. EIMS for compound (3)
Figure 8S. 1H NMR for compound (1) (300 MHz, CDCl 3)
Figure 9S. 13C (JMOD) NMR for compound (1) (75 MHz, CDCl 3)
Figure 10S. HMQC for compound (1) (1H/13C NMR 300 MHz/75 MHz, CDCl 3)
Figure 11S. 1H-1H COSY for compound (1) (300 MHz, CDCl 3)
Figure 12S. HMBC for compound (1) (1H/13C NMR 300 MHz/75 MHz, CDCl 3)
Figure 13S. EIMS spectrum for compound (1)
Figure 15S. 1H NMR for compound (2) (300 MHz, CDCl 3)
Figure 16S. 13C (JMOD) NMR for compound (2) (75 MHz, CDCl 3)
Figure 17S. EIMS for compound (2)
Figure 18S. 1H-1H COSY for compound (2) (300 MHz, CDCl 3)
Figure 19S. HMQC for compound (2) (1H/13C NMR 300 MHz/75 MHz, CDCl 3)
Figure 20S. HMBC for compound (2) (1H/13C NMR 300 MHz/75 MHz, CDCl 3)