Sectoral Business Cycle Synchronization in
the European Union
*António Afonso,
#$Davide Furceri
+♦January 2007
Abstract
This paper analyses sectoral business cycle synchronization in an enlarged European Union using annual data for the period 1980-2005. In particular, we try to identify which sector for each country is driving the aggregate output business cycle synchronization. Overall, the sectors that provide the most relevant contribution are Industry, Building and Construction, and Agriculture, Fishery and Forestry. In contrast, the Services sector, the largest one in terms of valued added share, shows a relative low business cycle synchronization and volatility, implying that it contributes only marginally to the aggregate output business cycle synchronization.
JEL: E32; F15; F41; F42
Keywords: EMU Enlargement, Stabilisation, Synchronization, Sectoral Business Cycle.
*
We are grateful to Vito Tanzi for helpful suggestions and Renate Dreiskena for research assistance. The opinions expressed herein are those of the authors and do not necessarily reflect those of the the ECB or the Eurosystem.
#
European Central Bank, Directorate General Economics, Kaiserstraße 29, D-60311 Frankfurt am Main, Germany, email: antonio.afonso@ecb.int.
$
UECE – Research Unit on Complexity in Economics; Department of Economics, ISEG/TULisbon - Technical University of Lisbon, R. Miguel Lupi 20, 1249-078 Lisbon, Portugal. UECE is supported by FCT (Fundação para a Ciência e a Tecnologia, Portugal), email: aafonso@iseg.utl.pt.
+ University of Palermo, Department of Economics, Italy.
1. Introduction
On 1 May 2004 the European Union (EU) welcomed ten new members: the Czech Republic, Estonia, Cyprus, Latvia, Lithuania, Hungary, Malta, Poland, Slovenia and Slovakia. In addition, two other countries, Bulgaria and Romania, will join the EU on January 2007, and other countries are at various stages of candidacy for membership in the EU. It is likely that all these countries will benefit from joining in the future the European and Monetary Union (EMU) in terms of inflation bias reduction, higher exchange rate stability, lower interest rates, and higher growth. Therefore, a relevant question is whether these economies should also expect to have high costs from EMU membership. The theory of the Optimum Currency Area, first developed by Mundell (1961), and including the classical contributions of McKinnon (1963) and Kenen (1969) stresses the importance of international linkages between the members of the monetary union to face the loss of the country-independent monetary policy to smooth output fluctuations.1
To the extent that the monetary policy would have contributed to stabilization of cyclical fluctuations in the past, the loss of the exchange rate control and of the independent monetary policy can be seen as the stabilisation cost in joining a monetary union. Moreover, it has been shown in the literature that this stabilisation cost is a decreasing function of the correlation between the cyclical output of the member country and the cyclical output of the anchor country (in this case the EMU as a whole). Intuitively, if the business cycle of a country is very highly correlated with the EMU-wide cyclical output, then countercyclical monetary policy conducted by the European Central Bank will be a very close substitute for the country independent monetary policy. Moreover, business cycle synchronization also has important implications for the ability to implement a common monetary policy.
The main purpose of this paper is to analyse sectoral business cycle synchronization in an enlarged European Union. In particular, we first ask whether the business cycles of the new EU countries are synchronized and compare them with those of EMU members, using annual data for the period 1980-2005. Second we analyse how business cycle
1
synchronization evolves over time. Third, we try to identify which sector for each country is driving the aggregate output business cycle synchronization.
The results of the paper show that while for some countries (such as Cyprus, Hungary and Malta) EMU membership will be not costly, for the other countries with negative or negligible business cycle synchronization the stabilization cost could be relevant, at least in the short-run. However, business cycle synchronization seems to have increased over time, suggesting that these costs could be become not relevant in the next future. In terms of sectoral decomposition, the results suggest that, although for each country is possible to identify which sector is able to explain more the aggregate output business cycle synchronization, overall, Industry, Building and Construction, and Agriculture, Fishery and Forestry sectors provide the most relevant contribution. On the other hand, the Services sector depicts relatively low business cycle synchronization.
The remainder of the paper is organized as follows. In Section Two we present a brief literature review of the importance of business-cycle synchronization, particularly for the EMU. In Section Three, we present the empirical methodology used to evaluate aggregate and sectoral output business cycle synchronization. Section Four reports the results obtained, and finally, Section Five summarises the paper’s main findings.
2. Literature Review
production in seven European countries for the period 1957-1998, finds that several of these countries have aligned business cycles.
Other studies have looked at changes in correlation patterns over time. Angeloni and Dedola (1999) found that the output correlation between Germany and other European countries has clearly increased during 1993-1997. Fatás (1997), using annual employment growth rates for regions of France, Germany, Italy, and the UK, found that the average correlation with aggregate EU-12 employment growth has increased from 1966-1979 to 1979-1992. Furceri and Karras (2006), analyzing cyclical output for the EU-15 countries found that business cycle synchronization has also increased for many countries after the creation of the EMU. In particular, this increase in synchronization is present in all components of aggregate demand, as well as two supply-side variables, but it is more pronounced in the trade components (imports and, particularly, exports). They also showed that the increase in trade within the EMU area is at least partly responsible for the increase in cyclical synchronization.
The literature has also considered the implications of the EMU for fiscal policy. In fact, unlike other monetary unions, the EMU does not have a central fiscal authority, and stabilisation of shocks is left to the responsibility of the domestic fiscal policies of the EMU members. However, the literature has shown that the ability of the EMU members’ national fiscal policies to smooth shocks is very modest.2 One implication of this is that business-cycle synchronization is extremely important in the EMU not only because it reduces the probability of asymmetric shocks, but also because it makes it plausible to expect the European Central Bank (ECB) to respond to aggregate shocks and to implement stabilising interventions with greater ease.
The literature is much thinner on the analysis of sectoral business cycle synchronization. We believe that this is an important element and it would provide useful policy indications, since it would enable to identify which sector for each country is driving the aggregate output to be more or less synchronized with EMU-wide business cycle. Thus, the analysis carried out in the following of this paper has the purpose to extend the literature and provide some insights in understanding business cycle synchronization.
2
3. Empirical Methodology
We obtain the output business cycle measures by detrending the series of real GDP. Four different methods are used to detrend the output series of each country i and estimate its cyclical component. The first measure is simple differencing (growth rate of the real GDP).
The second and the third method use the Hodrick-Prescott (HP) filter, proposed by Hodrick and Prescott (1980). The second method consists of using the value recommended by Hodrick and Prescott for annual data for the smoothness parameter (λ) equal to 100. The third method consists to consider the smoothness parameter (λ) equal to 6.25. In this way, as pointed out by Ravn and Uhlig (2002), the Hodrick-Prescott filter produces cyclical components comparable to those obtained by the Band-Pass filter. The fourth method makes use of the recently popular Band-Pass (BP) filter proposed by Baxter and King (1999), and evaluated by Stock and Watson (1999) and Christiano and Fitzgerald (2003) that also compares its properties to those of the HP filter.3
While minor differences among the results obtained by the three filters are not difficult to detect (for example, differencing generally produces the most volatile series, while the BP the smoothest), the main characteristics are remarkably similar. This robustness will be formally assessed by the estimations of the empirical section.
In practice, we measure GDP busyness cycle synchronization for each country as the correlation between the country’s cyclical component, ci, and the EMU’s cyclical
component, cEMU:
(
ci cEMU)
corr , . (1)
Successively, in order to identify which sector j for each country i is mainly responsible for the aggregate output business cycle synchronization, we first compute the country’s sectoral cyclical components, cij, and then we compute the correlation between these components and the EMU’s cyclical component:
3
(
EMU)
j i c
c
corr , . (2)
Moreover, to determine the relative weight of each sector in the computation of the aggregate output business cycle synchronization, we compute the standard deviations of the country’s sectoral cyclical components. It is clear in fact, that the higher is the volatility of a given sector, the more relevant is this sector in the computation of the aggregate output business cycle synchronization.
In particular, if we could approximate4 the country’s GDP cyclical component ci as the
sum of the sectoral value added cyclical components
j i i
j
c ≅
∑
c , (3)then we could decompose the correlation between the country’s cyclical component and the EMU’s cyclical component, as a weighted average of the correlations between the country’s sectoral cyclical components cij and the EMU’s cyclical component:
(
)
≅∑
(
)
j
EMU j i j i EMU
i c w corrc c
c
corr , , . (4)
The weights, j i
w , are represented by the share of output business cycle volatility (measured
by the standard deviation of the cyclical components) attributable to each sector:
i j i j i
w σ σ
= . (5)
4. Empirical Analysis
4.1. Data
We use data from the European Commission Annual Macro-economic Database
(AMECO).5 Our dataset covers 28 countries (the 12 current EMU countries, the 3 old EU
4
Which is not possible due to the nonlinearity of the filtering methods. 5
countries which have not adopted the euro, the 10 new EU members, and 3 prospective members, Bulgaria, Romania and Turkey)from 1980 to 2005.
The income variable we use to determine output business cycle synchronization is real GDP in 2000 constant prices. We use data for Gross Value Added for the Industry (not including Building and Construction), Agriculture, Forestry and Fishery, Building and Construction, and Services sectors to decompose output synchronization into sectoral business cycle synchronization.6
4.2. Output Business Cycle Synchronization
We calculate the correlation coefficient of each country’s cyclical component of real GDP with that of EMU,as a whole, using the HP filter with smoothness parameter equal to 6.25. Even though the estimated correlations vary according to the detrending method used, the implied rankings are very similar, regarding the overall period, the highest Spearman’s rank correlation coefficients is 0.936 (BP, HP6.25) and the lowest is 0.776 (Diff, HP100), as can be seen from Table 1.
[Insert Table 1 here]
Table 2 considers three different periods of analysis. The first is from 1980 to 1992 and considers the EU15 countries. The second is from 1993 to 2005 and applies to all 28 countries. The third is the overall period from 1980 to 2005. In relation to the overall period, we can see that for most EMU countries business cycle is relatively well synchronized, even if for some countries (namely Finland) there is an almost zero correlation with the EMU economy as a whole.
[Insert Table 2 here]
Looking at the period 1993-2005, France shows an almost perfect correlation with the EMU economy. However, comparing the 12 euroized countries with the 3 (old) non-euro economies, it is difficult to establish a systematic relationship. In fact, Denmark, Sweden
6
and the UK appear to be more synchronized with the EMU-wide cycle than some euro area members, such as Greece and Finland.
The new EU countries show a generally higher synchronization with the EMU than the candidate countries. In particular, there are some new EU countries (such as Cyprus, Hungary and Malta) already well synchronized with the EMU, and with correlations comparable to, or even higher than, those of some of the old members. On the other hand, several new EU countries (such as Estonia, Lithuania and Slovakia) exhibit negative correlations, as do two of the three prospective EU members (Romania and Turkey). The other new EU and accession countries (namely, Czech Republic, Latvia, Poland, Slovenia and Bulgaria) show a very negligible, even if positive, correlation. Overall, we can argue that while for some countries as Cyprus, Hungary and Malta, EMU membership will be not costly, for the other countries with negative or negligible business cycle synchronization the stabilisation cost could be relevant, at least in the short-run.
Focusing on the 1980-2005 period is only fully feasible for the old EU members, but this can be used to indicate how the correlations have changed for these countries, and how they could change for the prospective Member States. The most striking fact to emerge from this exercise is that the degree of synchronization with EMU has remarkably increased for all countries (with the exception of Germany, where it remained broadly similar). This result can be largely attributed to the achievement of a more integrated market since 1992, and to an increase in trade as pointed out by Furceri and Karras (2006). But, perhaps more interestingly, the results show that the increased synchronization has been at least as large in the non-euro area as in the euro area economies.
Thus, it is likely to be the case that as the intra-EMU share of trade for the new EU members increases, business cycles will become more synchronized.7 Moreover as pointed out by Frankel and Rose (1998), Rose and Engel (2002), and Rose (2005), the business cycle synchronization between the candidate countries and the currency union (or the anchor country) is endogenous, and it will tend to increase once the country will be part of the currency union.
7
4.3. Sectoral Business Cycle Synchronization
Industry (excluding Building and Construction)
In Table 3, we calculate for each country the correlation coefficient between the industry value added cyclical component and that of the EMU-wide GDP, and the standard deviation of the Industry value added cyclical component (using the HP filter with smoothness parameter equal to 6.25 for consistency). For each country, we report also the share of total value added generated by the Industry sector. We also consider in Table 3 three different periods of analysis: the first is from 1980 to 1992 and considers the EU15 countries: the second is from 1993 to 2005 and applies to all 28 countries; and the third is the overall period from 1980 to 2005.
[Insert Table 3 here]
Looking at the shares of this sector we can see that industry generated around one fourth of the total valued added (looking at the period where data for all 28 countries are available, it ranges from 13.0 percent for Cyprus to 32.4 percent for Ireland). Moreover, comparing the two sub periods it emerges clearly that this share is diminishing over time (in favour of the service sector as we will see in the following of our analysis).
In relation to the overall period, we can see that for some countries such as France, Germany, Ireland, Italy and Spain, the Industry sector synchronization with the EMU-wide GDP is relatively high. Moreover a sizeable volatility of this sector in these countries contributes to provide a significant contribution in the total GDP synchronization. In contrast, for other countries such as Austria, Greece and Netherlands, the industry valued added cyclical component is weakly correlated with the EMU-wide business, and in the case of Greece it is also worsen by the relative high volatility.
Finally analyzing the period 1993-2005 where the results for all 28 countries are available, we can see that while the new EU and candidate members show a higher volatility in the Industry sector, there is no particular difference between EU and EMU countries. In fact, while some of them (such as Cyprus and UK) are more synchronized than most of the EMU members, other countries (Hungary, Slovakia, Czech Republic and Estonia) show a negative correlation.
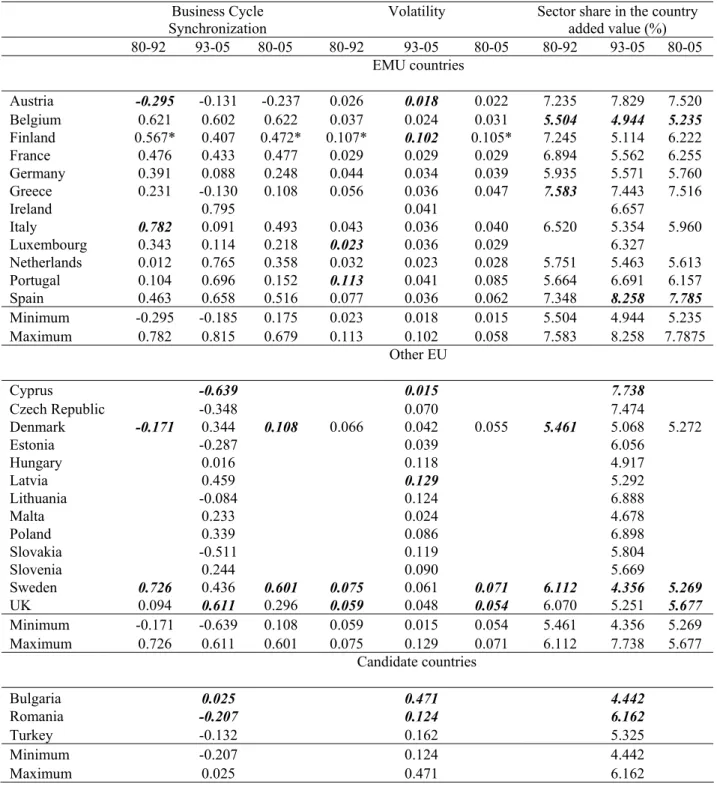
Building and Construction
In Table 4, we present the results in terms of business cycle synchronization, volatility and share of total value added for the Building and Construction sector. Looking at the shares we can see that the valued added contribution generated by the Building and Construction sector is relatively small around 6%. Moreover, comparing the two sub periods it emerges that for many EU15 countries (with the exception of Spain, Austria and Portugal) this share is diminishing over time.
[Insert Table 4 here]
In relation to the overall period, we can see that for some countries such as Ireland, Belgium and Sweden, the Building and Construction sector is well synchronization with the EMU-wide GDP is relatively high and relatively volatile, providing a significant contribution in the total GDP synchronization. In contrast, for other countries such as Austria, this sector is negatively synchronized with the EMU-wide GDP, and for many other countries the correlation is negligible.
Looking at the two sub periods we can not observe, as in the case of the Industry sector, a systematic increase in business cycle synchronization (with the exception of Ireland, Spain, the UK, and Portugal). Additionally, analyzing the period 1993-2005, we can see that while the new EU and candidate members show a higher volatility in the Building and Construction sector, they have lower business cycle synchronization. In fact, most of them show a negative or quite negligible correlation.
and Construction, this sector contributes significantly and positively to the computation of total GDP business cycle synchronization.
Agriculture, Fishery and Forestry
In Table 5, we present the results in terms of business cycle synchronization, volatility and share of total value added for the Building and Construction sector. In terms of the share of this sector in total added value, we can see that it is quite small (with the exception of Greece, Portugal, Ireland, and Spain), and is decreasing over time.
In relation to the overall period, we can see that for most of the EU15 countries the Agriculture, Fishery and Forestry sector synchronization with the EMU-wide GDP is relatively small. However, it is more than compensated, in terms of relevance in the computation of the aggregate output business cycle synchronization, by a high volatility (compared to the other sectors).
[Insert Table 5 here]
Looking at the two sub periods we can see that while synchronization increased for some countries (for example, Austria and Germany) it decreased for many others (especially Ireland). In contrast business cycle volatility seems to have remained quite stable.
Services
In Table 6, we present the same set of results analyzed for the Services sector. In terms of the share in total valued added, we can observe that the Services sector is the most relevant sector in the European Union, around 60 percent, and its share is increasing over time.
[Insert Table 6 here]
Analysing the result in terms of GDP business cycle synchronization, in relation to the overall period, we can see that for Italy, Spain and Sweden the Services sector is well synchronization with the EMU-wide GDP. For the other countries the correlation is either negative (as in the case of Austria, Netherlands and Denmark) or negligible. Volatility is also is relatively low compared to the other sectors, implying a low weight in the contribution of the aggregate output business cycle synchronization.
Looking at the two sub periods we can see that while synchronization increased for some countries (especially France, and the Netherlands), significant decreases were recorded for Greece and Italy. For the period 1992-2005, where the results for all 28 countries are available, we can see that the new EU and candidate members show an higher volatility in the Services sector (as in the other three sectors), but again there is no particular difference between EU and EMU countries in terms of sectoral synchronization. In fact, while countries such as Cyprus, Malta, and the UK are more synchronized than most of the EMU members, other countries (such as Hungary, Slovakia, Czech Republic and Estonia) show a negative correlation.
Overall, it seems that due to the low business cycle synchronization and the relative low volatility, this sector is the one that (compared to the other three sectors) contributes less to the aggregate output business cycle synchronization.
relative low business cycle synchronization and volatility, implying that it contributes only marginally to the aggregate output business cycle synchronization.8
5. Conclusion
The new EU member states are expected to join in the future the single currency. It is likely, that all these countries will receive benefits in terms of inflation bias reduction, higher exchange rate stability, lower interest rates, and higher growth from joining the EMU. The theory of the Optimum Currency Area stresses the importance of business cycle synchronization (the business-cycle correlation between the candidate’s economy and that of the euro area as a whole) to face the loss of the country-independent monetary policy to smooth output fluctuations.
The results of the paper show that there are some new EU countries (such as Cyprus, Hungary and Malta) already well synchronized with the EMU, and with correlations comparable to, or even higher than, those of some of the old members. On the other hand, several new EU countries (such as Estonia, Lithuania and Slovakia) exhibit negative correlations, as do two of the three prospective EU members (Romania and Turkey). However, it is worthwhile mentioning that this analysis can give useful indications in terms of stabilization costs only in the short-medium term. In fact, as it has been shown by Frankel and Rose (1998), business cycle synchronization is likely to increase for the EU countries once they would join the EMU, as EU membership could increase intra-EMU trade allowing business cycles to become more synchronized. It is significant that our analysis also shows that business cycle synchronization has increased for all the EU15 countries after the achievement of the Single Market (1991).
Successively, we tried to identify for each country which sector is driving the aggregate output business cycle synchronization. In particular, we considered four sectors: Industry (not including Building and Construction); Agriculture, Forestry and Fishery; Building and Construction; and Services sectors.
8
For each of this sector we computed the total valued added shares, the sectoral business cycle synchronization and volatility. Overall, it seems that while the Services sector is the largest one in terms of valued added share, it shows relative low business cycle synchronization and volatility, implying that it contributes only marginally to the aggregate output business cycle synchronization. In contrast, the other three sectors are overall quite synchronized and relatively volatile, implying a higher and more relevant contribution.
References
Afonso, A and Furceri D. (2006). “EMU enlargement, stabilization cost and insurance mechanisms”. Manuscript.
Alesina, A. and Barro, R. (2002). “Currency unions”, Quarterly Journal of Economics
117, 409-436.
Alesina, A.; Barro, R. and Tenreyro, S. (2002). “Optimal currency areas”, NBER Working Papers, 9072.
Angeloni, I. and Dedola, L. (1999). “From the ERM to the Euro: nee evidence on economic and policy convergence among EU countries”, European Central Bank Working Paper 4.
Artis, M. and Zhang, W. (1997). “International business cycles and the ERM: Is there a European business cycle,” International Journal of Finance and Economics, 2 (1), 1-16. Bayoumi, T. and Eichengreen B (1993) Shocking aspects of the European monetary integration, in: Torres F, Giavazzi F (Ed.) Adjustment and Growth in the European Monetary Union. Cambridge University Press: Cambridge, 193-229.
Baxter, M. and King, R. (1999). “Measuring Business Cycles: Approximate Band-Pass Filters for Economic Time Series”, Review of Economics and Statistics, 81 (4), 575-593.
Christiano, L. and Fitzgerald, T. (2003). “The Band Pass Filter,” International Economic Review, 4 (2), 435-465.
Clark, T. and Van Wincoop, E. (2001). “Borders and business cycles”, Journal of International Economics, 55, 59-85.
Clark, T. and Shin, K. (1998). “The sources of fluctuations within and across countries”, Federal Reserve Bank of Kansas City, Research Working Paper 4.
Corsetti, G. and Pesenti, P. (2002) “Self-validating optimum currency areas,” NBER Working Papers, 8783.
Fatás, A. (1997). “EMU: countries or regions: lessons from the EMS experience,”
European Economic Review, 41 (3-5), 743-751.
Furceri, D. and Karras, G. (2006). ”Business Cycle Synchronization in the EMU”, Applied Economics (forthcoming).
Galì, J and Perotti, R. (2003). “Fiscal Policy and Monetary Integration in Europe”,
Economic Policy,18, 533-572.
Frankel, J. and Rose, A. (1998). “The Endogeneity of the Optimum Currency Area Criteria,” Economic Journal 108, 1009-1025.
Kenen, R. (1969) “The theory of optimum currency area: an eclectic view,” in: R. Mundell and A. Swoboda, (eds.), Monetary problems of the international economy, Chicago, Univeristy of Chicago Press.
Kydland, F. and Prescott. E. (1977). ”Rules Rather Than Discretion: The Inconsistency of Optimal Plans,” Journal of Political Economy, 85, 473-490.
McKinnon, R. (1963). “Optimum currency areas,” American Economic Review 53, 717-725.
Mundell, R. (1961) “A theory of optimum currency areas,” American Economic Review
82, 942-963.
Peiró, A. (2004). “Are Business Cycle Asymmetric? Some European Evidence”, Applied Economics,36, 335-342.
Ravn, M. and Uhlig, H. (2002). “On Adjusting the Hodrick-Prescott Filter for the Frequency of Observations”. Review of Economics and Statistics, 84 (2), 371-380.
Rose, A. and Stanley, T. (2005) “A meta analysis of the effect of common currencies on international trade,” Journal of Economic Surveys, 19 (3), 347-365.
Rose, A. and Engel, C. (2002). “Currency unions and international integration,” Journal of Money, Credit and Banking 34, 1067-1089.
Stock, J. and Watson, M. (1999). “Business Cycle Fluctuations in U.S. Macroeconomic Time Series”, in Taylor, J. and Woodford, M. (eds.), Handbook of Macroeconomics, vol 1, 3-64, Elsevier.
Wynne, M. and Koo, J. (2000). “Business cycles under monetary union: a comparison of the EU and US”, Economica, 67, 347-374.
Table 1 – Spearman’s rank correlation matrix
HP6.25 HP100 BP Diff
HP6.25 1.000
HP100 0.936 1.000 BP 0.847 0.855 1.000
Diff 0.839 0.776 0.788 1.000
Table 2 – Business cycle synchronisation (vis-à-vis EMU)
1980-1992 1993-2005 1980-2005
EMU countries
Austria 0.534 0.793 0.647
Belgium 0.692 0.832 0.762
Finland 0.582* 0.478 0.509*
France 0.615 0.977 0.786
Germany 0.763 0.678 0.696
Greece 0.601 0.441 0.554
Ireland 0.285 0.645 0.465
Italy 0.539 0.810 0.674
Luxembourg 0.419 0.745 0.570
Netherlands 0.542 0.875 0.692
Portugal 0.341 0.733 0.507
Spain 0.506 0.871 0.662
Other EMU
Czech Republic 0.031
Denmark 0.043 0.569 0.258
Estonia -0.220
Cyprus 0.541
Latvia 0.238
Lithuania -0.032
Hungary 0.789
Malta 0.698
Poland 0.247
Slovenia 0.412
Slovakia -0.673
Sweden 0.164 0.695 0.443
UK -0.137 0.594 0.042
Candidate countries
Bulgaria 0.342
Romania -0.242
Turkey -0.273
Note: Hodrick-Prescott Filter with smoothness parameter equal to 6.25.
Table 3 – Industry (excluding Building and Construction) contribution to business cycle synchronisation (vis-à-vis EMU)
Business Cycle Synchronization
Volatility Sector share in the country added value (%) 80-92 93-05 80-05 80-92 93-05 80-05 80-92 93-05 80-05
EMU countries
Austria -0.169 0.706 0.284 0.014 0.017 0.015 26.054 22.612 24.402
Belgium 0.174 0.453 0.349 0.025 0.023 0.023 26.333 21.970 24.239 Finland 0.464* 0.430 0.447* 0.055* 0.061 0.058* 27.361 26.628 27.009
France 0.569 0.815 0.679 0.020 0.016 0.018 22.311 17.704 20.100
Germany 0.501 0.801 0.668 0.017 0.016 0.016 32.747 25.135 29.093
Greece 0.418 -0.185 0.175 0.047 0.021 0.036 20.119 14.690 17.513
Ireland 0.527 0.040 32.428
Italy 0.669 0.342 0.547 0.027 0.031 0.030 27.434 23.518 25.554
Luxembourg 0.135 0.592 0.313 0.035 0.028 0.031 13.624 Netherlands -0.001 0.490 0.196 0.023 0.019 0.020 24.459 19.825 22.235 Portugal 0.585 0.233 0.379 0.047 0.027 0.039 22.116 20.033 21.116 Spain 0.617 0.442 0.563 0.041 0.030 0.037 26.578 20.909 23.857 Minimum -0.169 -0.185 0.175 0.014 0.016 0.015 20.119 14.690 17.513 Maximum 0.669 0.815 0.679 0.055 0.061 0.058 32.747 32.428 29.093
Other EU
Cyprus 0.656 0.007 13.003
Czech Republic -0.108 0.052 31.315
Denmark 0.021 0.586 0.325 0.025 0.023 0.024 20.831 20.257 20.556
Estonia -0.060 0.028 21.908
Hungary -0.193 0.081 26.623
Latvia 0.173 0.054 21.002
Lithuania 0.428 0.109 25.239
Malta 0.510 0.049 23.080
Poland 0.009 0.088 25.704
Slovakia -0.122 0.031 28.767
Slovenia 0.350 0.080 30.468
Sweden 0.393 0.349 0.374 0.039 0.062 0.051 24.841 24.093 24.482
UK 0.043 0.633 0.303 0.036 0.047 0.041 30.831 22.660 26.909
Minimum 0.021 -0.193 0.025 0.007 0.024 20.831 13.003 20.556 Maximum 0.393 0.656 0.039 0.109 0.051 30.831 31.315 26.909
Candidate countries
Bulgaria -0.005 0.384 24.757
Romania -0.070 0.114 30.783
Turkey -0.201 0.124 23.740
Minimum -0.201 0.114 23.740
Maximum -0.005 0.34 30.783
Note: Hodrick-Prescott Filter with smoothness parameter equal to 6.25.
Table 4 – Building and Construction contribution to business cycle synchronisation (vis-à-vis EMU)
Business Cycle Synchronization
Volatility Sector share in the country added value (%) 80-92 93-05 80-05 80-92 93-05 80-05 80-92 93-05 80-05
EMU countries
Austria -0.295 -0.131 -0.237 0.026 0.018 0.022 7.235 7.829 7.520
Belgium 0.621 0.602 0.622 0.037 0.024 0.031 5.504 4.944 5.235
Finland 0.567* 0.407 0.472* 0.107* 0.102 0.105* 7.245 5.114 6.222
France 0.476 0.433 0.477 0.029 0.029 0.029 6.894 5.562 6.255 Germany 0.391 0.088 0.248 0.044 0.034 0.039 5.935 5.571 5.760 Greece 0.231 -0.130 0.108 0.056 0.036 0.047 7.583 7.443 7.516
Ireland 0.795 0.041 6.657
Italy 0.782 0.091 0.493 0.043 0.036 0.040 6.520 5.354 5.960
Luxembourg 0.343 0.114 0.218 0.023 0.036 0.029 6.327
Netherlands 0.012 0.765 0.358 0.032 0.023 0.028 5.751 5.463 5.613 Portugal 0.104 0.696 0.152 0.113 0.041 0.085 5.664 6.691 6.157
Spain 0.463 0.658 0.516 0.077 0.036 0.062 7.348 8.258 7.785
Minimum -0.295 -0.185 0.175 0.023 0.018 0.015 5.504 4.944 5.235 Maximum 0.782 0.815 0.679 0.113 0.102 0.058 7.583 8.258 7.7875
Other EU
Cyprus -0.639 0.015 7.738
Czech Republic -0.348 0.070 7.474
Denmark -0.171 0.344 0.108 0.066 0.042 0.055 5.461 5.068 5.272
Estonia -0.287 0.039 6.056
Hungary 0.016 0.118 4.917
Latvia 0.459 0.129 5.292
Lithuania -0.084 0.124 6.888
Malta 0.233 0.024 4.678
Poland 0.339 0.086 6.898
Slovakia -0.511 0.119 5.804
Slovenia 0.244 0.090 5.669
Sweden 0.726 0.436 0.601 0.075 0.061 0.071 6.112 4.356 5.269
UK 0.094 0.611 0.296 0.059 0.048 0.054 6.070 5.251 5.677
Minimum -0.171 -0.639 0.108 0.059 0.015 0.054 5.461 4.356 5.269 Maximum 0.726 0.611 0.601 0.075 0.129 0.071 6.112 7.738 5.677
Candidate countries
Bulgaria 0.025 0.471 4.442
Romania -0.207 0.124 6.162
Turkey -0.132 0.162 5.325
Minimum -0.207 0.124 4.442
Maximum 0.025 0.471 6.162
Note: Hodrick-Prescott Filter with smoothness parameter equal to 6.25.
Table 5 – Agriculture, Fishery and Forestry contribution to business cycle synchronisation (vis-à-vis EMU)
Business Cycle Synchronization
Volatility Sector share in the country added value (%) 80-92 93-05 80-05 80-92 93-05 80-05 80-92 93-05 80-05
EMU countries
Austria -0.139 0.546 0.183 0.032 0.024 0.028 4.412 2.335 3.415
Belgium 0.239 0.430 0.290 0.038 0.035 0.036 2.283 1.409 1.863
Finland 0.635* 0.431 0.507* 0.090* 0.057 0.074* 6.731 3.957 5.399
France -0.023 0.305 0.083 0.035 0.026 0.030 4.176 3.001 3.612 Germany 0.196 0.530 0.295 0.056 0.046 0.050 1.706 1.233 1.479
Greece 0.150 -0.179 0.032 0.112 0.042 0.084 12.396 8.054 10.312
Ireland -0.010 0.034 4.697
Italy 0.461 0.040 0.316 0.033 0.035 0.035 4.545 2.970 3.789 Luxembourg 0.001 0.220 0.080 0.049 0.045 0.046 0.812 Netherlands 0.124 0.455 0.236 0.030 0.033 0.031 4.079 2.823 3.476 Portugal -0.071 -0.006 -0.054 0.047 0.035 0.041 12.871 4.751 8.974
Spain 0.197 0.052 0.205 0.053 0.041 0.048 5.926 4.422 5.204 Minimum -0.139 -0.179 -0.054 0.032 0.024 0.028 1.706 2.335 1.863 Maximum 0.635 0.546 0.507 0.112 0.057 0.084 12.871 1.409 10.312
Other EU
Cyprus 0.222 0.039 3.992
Czech Republic 0.054 0.054 4.041
Denmark -0.026 0.386 0.180 0.050 0.083 0.066 4.584 2.755 3.706
Estonia -0.061 0.029 6.580
Hungary -0.173 0.084 5.209
Latvia 0.565 0.111 5.992
Lithuania 0.090 0.131 9.361
Malta 0.113 0.037 2.570
Poland 0.055 0.097 6.146
Slovakia -0.092 0.060 5.136
Slovenia 0.251 0.090 3.622
Sweden 0.446 0.188 0.293 0.042 0.058 0.050 3.780 2.189 3.016
UK 0.055 0.073 0.037 0.044 0.028 0.036 1.867 1.298 1.594
Minimum -0.026 -0.173 0.037 0.042 0.028 0.036 1.867 1.298 3.706 Maximum 0.446 0.386 0.293 0.050 0.131 0.066 4.584 9.361 1.594
Candidate countries
Bulgaria -0.064 0.270 15.367
Romania -0.307 0.116 15.823
Turkey -0.274 0.165 13.945
Minimum -0.307 0.116 13.945
Maximum -0.064 0.270 15.823
Note: Hodrick-Prescott Filter with smoothness parameter equal to 6.25.
Table 6 – Services contribution to business cycle synchronisation (vis-à-vis EMU)
Business Cycle Synchronization
Volatility Sector share in the country added value (%) 80-92 93-05 80-05 80-92 93-05 80-05 80-92 93-05 80-05
EMU countries
Austria -0.338 0.286 -0.074 0.017 0.016 0.016 63.614 66.748 65.119
Belgium 0.092 0.370 0.203 0.021 0.014 0.018 65.842 71.675 68.642 Finland 0.464* 0.303 0.368* 0.041* 0.051 0.046* 59.543 65.516 62.410
France 0.254 0.507 0.360 0.012 0.010 0.011 66.619 73.732 70.034
Germany 0.197 0.170 0.171 0.019 0.015 0.017 59.807 69.222 64.326 Greece 0.226 -0.235 0.039 0.049 0.018 0.037 60.036 69.839 64.741
Ireland -0.127 0.029 56.218
Italy 0.787 0.217 0.527 0.026 0.031 0.029 61.502 68.159 64.697
Luxembourg -0.236 0.250 0.012 0.018 0.024 0.020 80.403
Netherlands -0.414 0.444 -0.019 0.020 0.014 0.017 65.270 71.813 68.410
Portugal 0.428 0.550 0.311 0.066 0.022 0.049 60.686 68.554 64.463
Spain 0.643 0.586 0.576 0.044 0.019 0.036 61.480 62.045 61.752
Minimum -0.414 -0.235 -0.074 0.017 0.010 0.011 59.543 56.218 61.752 Maximum 0.787 0.586 0.576 0.066 0.051 0.049 65.270 80.403 70.034
Other EU
Cyprus 0.840 0.015 75.267
Czech Republic -0.235 0.035 57.159
Denmark -0.292 0.152 -0.062 0.016 0.008 0.013 69.093 71.921 70.450
Estonia -0.102 0.018 60.771
Hungary -0.225 0.106 58.816
Latvia 0.520 0.062 66.786
Lithuania 0.432 0.110 58.635
Malta 0.647 0.034 66.745
Poland 0.073 0.077 58.814
Slovakia -0.402 0.049 60.293
Slovenia 0.297 0.073 60.225
Sweden 0.797 0.325 0.535 0.041 0.049 0.045 65.268 69.361 67.233
UK 0.340 0.568 0.411 0.034 0.046 0.040 61.231 70.219 65.546
Minimum -0.292 -0.402 -0.062 0.016 0.008 0.024 61.231 58.814 65.546 Maximum 0.797 0.840 0.535 0.041 0.110 0.051 69.093 75.267 70.450
Candidate countries
Bulgaria 0.027 0.426 55.109
Romania -0.140 0.089 47.233
Turkey -0.196 0.147 56.956
Minimum -0.196 0.089 47.233
Maximum 0.027 0.426 55.109
Note: Hodrick-Prescott Filter with smoothness parameter equal to 6.25.
Appendix 1 – Filtering Methods
Lettingyi,t =ln
( )
Yi,t , the first measure is simple differencing (growth rate of the real GDP):ci,t = yi,t − yi,t−1. (1) The second and the third method used in the empirical analysis make use of the Hodrick-Prescott (HP) filter, proposed by Hodrick and Hodrick-Prescott (1980). The filter decomposes the series into a cyclical
( )
ci,t and a trend( )
gi,t component, by minimizing with respect tot i
g, , for the smoothness parameterλ >0 the following quantity:
(
)
(
)
∑
∑
= − = + − − + − T t T t t i t i t i ti g g g
y 1 1 2 2 1 , 1 , 2 ,
, λ . (2) The fourth method makes use of the recently very popular Band-Pass (BP) filter proposed by Baxter and King (1995), and evaluated by Stock and Watson (1998) and Christiano and Fitzgerald (1999) that also compares its properties to those of the HP filter. The low pass (LP) filter α(L), which forms the basis for the band pass filter, selects a finite number of moving average weights αh to minimize:
∫
−
= π
π δ ω dω
Q ( )2 ,
where =
∑
K=−K h
h hL
L α
α( ) and =
∑
K=− −K h h i h K e ω α ω
α ( ) .
The LP filter uses αK(ω) to approximate the infinite MA filter β(ω). Defining )
( ) ( )
(ω β ω α ω
δ ≡ − , and then minimizing Q, we minimize the discrepancy between the
ideal LP filterβ(ω) and its finite representation αK(ω) at frequency ω. The main objective of the BP filter as implemented by Baxter and King (1995) is to remove both the high frequency and low frequency component of a series, leaving the business-cycle frequencies. This is obtained by subtracting the weights of two low pass filters. We define
L
ω and ωH, the lower and upper frequencies of two low pass filters as respectively eight and two for annual data. We therefore remove all fluctuations shorter than two or longer than eight years. The frequency representation of the band pass weights becomes
) ( )
( H K L
K ω α ω
Appendix 2 – Within Country Sectoral Synchronization
It is easy to show that the sectoral business cycle synchronization within country is linked with the EMU-sector (j) synchronization via the EMU-country (i) synchronization. Indeed,
we computed ( , ) ( , )
EMU i
EMU i EMU i
c c
c c
corr c c σ
σ σ
= and ( , ) ( , )
j EMU i
j j EMU i EMU i
c c
c c
corr c c σ
σ σ
= , but we can also
disaggregatecorr c( EMU,cij)as follows:
( , ) ( , )
( , ) ( , )
( , ) ( , )
i i
j
j EMU i
EMU i j
EMU i i i j c EMU i c i i
c c
corr c c
c c c c
corr c c corr c c
σ
σ σ
σ σ
= (A2.1)
which allows highlighting the contributions of both ( , j)
i i
corr c c and of corr c( EMU, )ci to ( EMU, ij)
corr c c . Therefore, we also computed the within country sectoral business cycle
Table A1– Within Country Sectoral Synchronization: Industry; Building and Construction
Industry Building and Construction 80-92 93-05 80-05 80-92 93-05 80-05
EMU countries
Austria 0.611 0.617 0.605 0.352 0.301 0.310 Belgium 0.543 0.707 0.614 0.693 0.599 0.644 Finland 0.922* 0.742 0.839* 0.769* 0.900 0.813*
France 0.193 0.865 0.495 0.172 0.407 0.300
Germany 0.505 0.427 0.453 0.754 0.598 0.680 Greece 0.517 0.271 0.490 0.593 0.121 0.495
Ireland 0.831 0.789
Italy 0.848 0.390 0.618 0.358 0.096 0.271 Luxembourg 0.450 0.334 0.398 0.213 0.236 0.233 Netherlands 0.471 0.214 0.356 0.163 0.592 0.320
Portugal 0.611 0.713 0.647 0.773 0.887 0.760 Spain 0.647 0.737 0.702 0.801 0.835 0.805
Minimum 0.193 0.21 0.36 0.163 0.10 0.23 Maximum 0.922 0.86 0.84 0.801 0.0 0.81
Other EU
Cyprus 0.437 -0.276
Czech Republic 0.752 0.442
Denmark 0.837 0.670 0.763 0.743 0.498 0.658
Estonia 0.646 0.635
Hungary -0.193 -0.012
Latvia 0.195 0.223
Lithuania 0.829 0.658
Malta 0.830 0.229
Poland -0.344 -0.149
Slovakia 0.323 0.755
Slovenia 0.852 0.784
Sweden 0.667 0.841 0.783 0.351 0.688 0.529
UK 0.189 0.536 0.262 0.519 0.576 0.504
Minimum 0.189 -0.344 0.26 0.351 -0.276 0.504 Maximum 0.837 0.852 0.78 0.743 0.784 0.658
Candidate countries
Bulgaria 0.345 0.370
Romania 0.677 0.640
Turkey 0.668 0.676
Minimum 0.345 0.370
Maximum 0.677 0.676
Note: Hodrick-Prescott Filter with smoothness parameter equal to 6.25.
Table A2 – Within Country Sectoral Synchronization: Agriculture; Services
Agriculture, Fishery and Forestry
Services
80-92 93-05 80-05 80-92 93-05 80-05
EMU countries
Austria 0.056 0.218 0.124 0.220 0.199 0.186 Belgium 0.336 0.356 0.346 0.038 0.242 0.107 Finland 0.719* 0.584 0.682* 0.611* 0.791 0.677*
France 0.286 0.412 0.328 0.050 0.432 0.202 Germany -0.004 0.412 0.087 0.696 0.664 0.649
Greece 0.499 0.350 0.483 0.212 0.506 0.253
Ireland -0.089 0.465
Italy 0.186 0.113 0.185 0.570 0.174 0.383 Luxembourg -0.146 0.191 0.009 0.072 0.006 0.037
Netherlands 0.122 0.296 0.223 -0.134 0.314 0.018
Portugal 0.442 0.172 0.363 0.691 0.801 0.684
Spain 0.664 0.284 0.545 0.532 0.773 0.595 Minimum -0.146 -0.08 0.009 -0.134 0.006 0.018 Maximum 0.719 0.584 0.682 0.696 0.801 0.684
Other EU
Cyprus 0.441 0.470
Czech Republic 0.632 0.165 Denmark 0.079 0.459 0.273 0.805 0.342 0.641
Estonia 0.627 0.664
Hungary -0.196 -0.256
Latvia 0.195 0.027
Lithuania 0.887 0.658
Malta 0.160 0.652
Poland -0.338 -0.634
Slovakia 0.464 0.514
Slovenia 0.628 0.798
Sweden 0.487 0.760 0.669 0.144 0.639 0.458
UK 0.443 0.466 0.441 -0.030 0.212 0.045
Minimum 0.079 -0.338 0.273 -0.030 -0.634 0.641 Maximum 0.487 0.887 0.669 0.805 0.798 0.045
Candidate countries
Bulgaria 0.302 0.355
Romania 0.703 0.431
Turkey 0.749 0.716
Minimum 0.302 0.355
Maximum 0.749 0.716
Note: Hodrick-Prescott Filter with smoothness parameter equal to 6.25.
Annex – Data Sources
Table B1 – Data sources
Original series AMECO codes *
Gross domestic product at 2000 market prices - National currency: Data at constant prices.
1.1.0.0.OVGD Price deflator gross domestic product at market prices - National currency; 2000 =
100. Ratio: Data at current prices/Data at constant prices 3.1.0.0.PVGD Gross Value Added at current prices; agriculture, forestry and fishery products –
National currency: Data at current prices 1.0.99.0.UVG1 Gross value added at current prices; industry excluding building and construction –
National Currency: Data at current prices 1.0.99.0.UVG2 Gross value added at current prices; building and construction – National Currency:
Data at current prices 1.0.99.0.UVG4
Gross value added at current prices; services – National currency: Data at current
prices 1.0.99.0.UVG5
Note: * series from the EC AMECO database.
Table B2 – Data availability
GDP I BC AFF S
Austria 1980 1980 1980 1980 1980
Belgium 1980 1980 1980 1980 1980
Finland 1980 1980 1980 1980 1980
France 1980 1980 1980 1980 1980
Germany 1980 1980 1980 1980 1980
Greece 1980 1980 1980 1980 1980
Ireland 1980 1990 1990 1990 1990
Italy 1980 1980 1980 1980 1980
Luxembourg 1980 1985 1985 1985 1985
Netherlands 1980 1980 1980 1980 1980
Portugal 1980 1980 1980 1980 1980
Spain 1980 1980 1980 1980 1980
Cyprus 1990 1995 1995 1995 1995
Czech Republic 1990 1990 1990 1990 1990
Denmark 1980 1980 1980 1980 1980
Estonia 1993 1993 1993 1993 1993
Hungary 1991 1991 1991 1991 1991
Latvia 1990 1992 1992 1992 1992
Lithuania 1990 1992 1992 1992 1992
Malta 1990 1990 1990 1990 1990
Poland 1990 1991 1991 1991 1991
Slovakia 1992 1993 1993 1993 1993
Slovenia 1990 1991 1991 1991 1991
Sweden 1980 1980 1980 1980 1980
United Kingdom 1980 1980 1980 1980 1980
Bulgaria 1991 1996 1996 1996 1996
Romania 1990 1995 1995 1995 1995
Turkey 1980 1980 1980 1980 1980
Note: In the table is reported the first year where the data is available.
GDP=gross domestic product; I= gross value added - industry excluding building and construction;