SY
STEMA
TIC REVIEW
352
Dynamic Movement Assessment and Functional
Movement Screening for injury prediction: a
systematic review
Dynamic Movement Assessment e Functional Movement Screen para predição de lesões: uma
revisão sistemática
Dynamic Movement Assessment y Functional Movement Screen para la predicción de la
lesión: una revisión sistemática
Priscila dos Santos Bunn
1,2, Elirez Bezerra da Silva
1Corresponding address: Priscila dos Santos Bunn – Universidade do Estado do Rio de Janeiro – Rua São Francisco Xavier, 524, 9th floor – Rio de Janeiro (RJ), Brazil – Zip Code: 20550-900
– E-mail: [email protected] – Finance source: Nothing to declare – Conflict of interests: Nothing to declare – Presentation: Feb. 2th,2018 Accepted for publication: Apr. 24th, 2018.
Study conducted by the Graduate Program in Exercise and Sport Sciences at the Universidade do Estado do Rio de Janeiro (UERJ), Brazil.
1Programa de Pós-Graduação em Ciências do Exercício e do Esporte, Universidade do Estado do Rio de Janeiro (UERJ), Rio de
Janeiro, Brazil.
2Centro de Educação Física Almirante Adalberto Nunes (Cefan), Marinha do Brasil, Rio de Janeiro (RJ), Brazil.
ABSTRACT | Dynamic Movement Assessment™ (DMA™) and Functional Movement Screening™ (FMS™) are tools to predict the risk of musculoskeletal injuries in individuals who practice physical activities. This systematic review aimed to evaluate the association of DMA™ and FMS™ with the risk of musculoskeletal injuries, in different physical activities, categorizing by analysis. A research without language or time filters was carried out in November 2016 in MEDLINE, Google Scholar, SciELO, SCOPUS, SPORTDiscus, CINAHL and BVS databases using the keywords: “injury prediction”, “injury risk”, “sensitivity”, “specificity”, “functional movement screening”, and “dynamic movement assessment”. Prospective studies that analyzed the association between DMA™ and FMS™ with the risk of musculoskeletal injuries in physical activities were included. The data extracted from the studies were: participant’s profile, sample size, injury’s classification criteria, follow-up time, and the results presented, subdivided by the type of statistical analysis. The risk of bias was performed with Newcastle-Ottawa Scale for cohort studies. No study with DMA™ was found. A total of 20 FMS™ studies analyzing one or more of the following indicators were included: diagnostic accuracy (PPV, NPV and AUC), odds ratios (OR) or relative risk (RR). FMS™ showed a sensitivity=12 to 99%; specificity=38 to 97%; PPV=25 to 91%; NPV=28 to 85%; AUC=0.42 to 0.68; OR=0.53 to 54.5; and RR=0.16-5.44. The FMS™ has proven
to be a predictor of musculoskeletal injuries. However, due to methodological limitations, its indiscriminate usage should be avoided.
Keywords | Cumulative Trauma Disorders; Athletic Injuries;
Movement.
viés foi realizado com a Escala Newcastle-Ottawa para estudos de coorte. Não foi encontrado nenhum estudo sobre a DMA™. Foram incluídos 20 estudos, que analisaram um ou mais dos seguintes indicadores: acurácia diagnóstica (VPP, VPN e AUC), razão de chances (OR) ou risco relativo (RR). O FMS™ apresentou sensibilidade=12-99%; especificidade=38-97%; VPP=25-91%; VPN=28-85%; AUC=0,42-0,68; OR=0.53-54.5; e RR=0,16-5,44. O FMS™ apresentou-se como um método preditor de lesões musculoesqueléticas. Entretanto, devido às limitações metodológicas dos estudos, seu uso indiscriminado deve ser evitado.
Descritores | Transtornos Traumáticos Cumulativos;
Traumatismos em Atletas; Movimento.
RESUMEN | Evaluación Dinámica del Movimiento™ (DMA™) y Detección del Movimiento Funcional ™ (FMS™) son herramientas para predecir el riesgo de lesiones musculoesqueléticas en individuos que practican actividades físicas. Esta revisión sistemática tuvo como objetivo evaluar la asociación de DMA™ y FMS™ con el riesgo de lesiones musculoesqueléticas en diferentes actividades físicas y categorizarlas por análisis. En noviembre de 2016 se llevó a cabo una investigación sin filtros de idioma o de tiempo en las bases de datos MEDLINE, Google Scholar,
SciELO, SCOPUS, SPORTDiscus, CINAHL y BVS, utilizando las palabras clave: predicción de lesiones, riesgo de lesiones, sensibilidad, especificidad, detección del movimiento funcional y evaluación dinámica de movimientos. Se incluyeron estudios prospectivos que analizaron la asociación entre DMA™ y FMS™ con el riesgo de lesiones musculoesqueléticas en actividades físicas. Los datos extraídos de los estudios fueron: perfil del participante, tamaño de la muestra, criterios de clasificación de la lesión, tiempo de seguimiento y los resultados presentados, subdivididos por el tipo de análisis estadístico. El riesgo de sesgo se realizó con la Escala Newcastle-Ottawa para estudios de cohorte. No se encontró ningún estudio con DMA™. Se incluyeron un total de 20 estudios FMS™ que analizaron uno o más de los siguientes indicadores: precisión diagnóstica (VPP, VPN y ABC), odds ratios (OR) o riesgo relativo (RR). FMS™ mostró una sensibilidad = del 12 al 99%; especificidad = del 38 al 97%; VPP = del 25 al 91%; VPN = del 28 al 85%; ABC = 0,42 a 0,68; OR = 0,53 a 54,5; y RR = 0,16-5,44. El FMS™ ha demostrado ser un predictor de lesiones musculoesqueléticas. Sin embargo, debido a limitaciones metodológicas, se debe evitar su uso indiscriminado.
Palabras clave | Transtornos de Traumas Acumulados; Traumatismos
en Atletas; Movimiento.
INTRODUCTION
Musculoskeletal injuries are one of the main causes of
morbidity in individuals who practice physical exercises
1–3.
Thus, several screening methods have been developed
aiming at classifying the risk of injury. In this context,
functional tests based on subjective evaluations have been
increasingly performed
4to verify the movement patterns
and dysfunctions associated with injuries of the trunk and
lower limbs
5,6. The subjectivity of these evaluations limits
their reliability
7. However, they are a low-cost alternative
in large-scale evaluations and in case of absence of gold
standards
8.
To establish a risk classification tool for
musculoskeletal injuries, Cook et al.
9developed the
Functional Movement Screening™ (FMS™). This
method classifies the risk of injury in the presence of
abnormal movement patterns by performing seven tests/
movements
9,10. Each test can be evaluated from zero to
three points and assess the interactions of kinetic chain
mobility and stability needed to perform fundamental
movement patterns. The score ranges from 0 to 21 points.
Initial studies have shown that soccer players with scores
of 14 or less in the total score have a higher risk of
injury
11. Thus, this method has been used in preseasons
of several modalities of sports to modify movement
patterns that can cause injuries
10,12. However, the efficacy
of FMS ™ to predict injuries is controversial among
authors
13–15, likely justified by the different demands
among sports
13.
Years later, Nessler & Dunn developed the Dynamic
Movement Assessment™ (DMA™)
5. It consists of
filming the individual performing six functional
tests. The video analysis is performed using a
two-dimensional (2D) biomechanical analysis software.
The 2D evaluation allows visualizing movement
dysfunctions in the frontal plane, such as dynamic
valgus
8. Each of the six DMA™ tests is rated with a
deviations or a major deviation with intermediate
magnitude promotes two points. Finally, individuals
who perform the test without clinically important
deviations are classified with three points
5.
Due to the low cost and easy feasibility of the FMS™
and DMA™, their use to evaluate individuals who
practice physical exercises in several groups is attractive.
The main difference between the two methods is that
DMA™ is based on functional tests with unilateral
support (squatting and vertical jump), common in the
sport gesture of several modalities
5.
The fact that the incidence of injuries in people who
practice sports
16,17or occupational physical exercises
1,18,19is
high justifies this review. Getting to know a low-cost and
easy-to-use test that measures fundamental movement
dysfunctions, potentially predicting athletic injuries, may
allow the development of preventive strategies that avoid
the removal of functions involving physical exercises.
Moreover, previous reviews evaluated only the diagnostic
accuracy indicators of prospective studies of FMS™.
Thus, the purpose of this systematic review is to evaluate
the association of DMA™ and FMS™ with the risk of
musculoskeletal injuries.
METHODOLOGY
This systematic review was registered in PROSPERO
(CRD42017068014) and drafted based on the Preferred
Reporting Items for Systematic Reviews and
Meta-Analyses: The PRISMA Statement
20.
Inclusion criteria
The studies included in this systematic review were
prospective studies that used the FMS™ or DMA™ to
classify the risk of musculoskeletal injuries in physical
exercise practitioners of both sexes and without age limits.
More detailed information about FMS™ and DMA™
are found in the studies of Cook et al., and Nessler &
Dunn, respectively
5,9.
Search strategy
A search was conducted in November 2016 in
US National Library of Medicine (MEDLINE),
Scientific Electronic Library Online (SciELO), Google
Scholar, Virtual Health Library (VHL), CINAHL
(EBSCOhost), SPORTDiscus and SCOPUS. The
following keywords were used as descriptors of the
Medical Subject Headings (MeSH): injury prediction,
injury risk, functional movement screening, and
dynamic movement assessment. The sentences used
in this research were done with the Boolean operators
AND (between the descriptors) and OR (between
descriptor’s synonyms). No date limits or language
filters were applied.
Data collection process
The following data were extracted from the selected
studies: profile of the participants, sample size,
classification of musculoskeletal injuries, follow-up
time and type of statistical analysis performed with
its results.
Bias risk analysis
For bias risk analysis, the Newcastle-Ottawa scale
was used
21. The domains considered in this scale are:
(1) selection (representativeness of the exposed cohort,
selection of the unexposed cohort, evaluation of the
exposure and confirmation that the result of interest was
not present at the beginning of the study, (2) comparison
of the cohort based on the study design or analysis
(if results were adjusted for the main confounding
factors and other variables) and (3) outcome (outcome
assessment, sufficient follow-up time, and adequacy of
cohort follow-up). Studies with less than five stars were
classified as a “high risk of bias.” In addition, studies
were considered to have a “risk of uncertain bias” as
they did not score in the “comparison” domain. The
bias risk analysis was performed by only one evaluator.
RESULTS
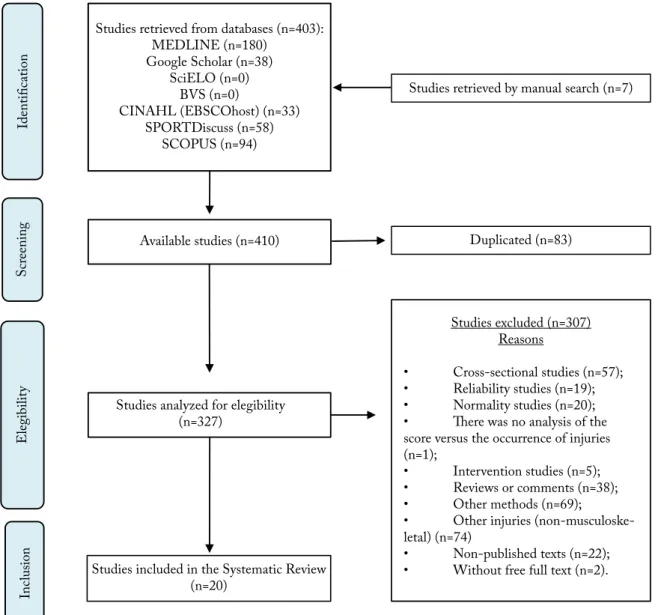
Flow diagram
Studies retrieved from databases (n=403): MEDLINE (n=180)
Google Scholar (n=38) SciELO (n=0)
BVS (n=0)
CINAHL (EBSCOhost) (n=33) SPORTDiscuss (n=58)
SCOPUS (n=94)
Studies retrieved by manual search (n=7)
Identific
atio
n
S
cr
eening
Elegibilit
y
Inc
lusio
n
Available studies (n=410)
Studies analyzed for elegibility (n=327)
Studies included in the Systematic Review (n=20)
Duplicated (n=83)
Studies excluded (n=307) Reasons
• Cross-sectional studies (n=57); • Reliability studies (n=19); • Normality studies (n=20); • There was no analysis of the score versus the occurrence of injuries (n=1);
• Intervention studies (n=5); • Reviews or comments (n=38); • Other methods (n=69);
• Other injuries (non-musculoske-letal) (n=74)
• Non-published texts (n=22); • Without free full text (n=2).
Figure 1. Flow diagram
Table 1. Characteristic of included studies
Study Participants Sample
Injury’s classification
criteria
Follow-up time
Bushman et al., 201522 Military
personnel
n=2476 soldiers;
Age=18 – 57 years old. I 6 months
Lisman et al., 201323 Military
personnel
n=447 (ST) and n=427 (LT) marine officer’s students;
Age=22.4±2.7 years old.
I
6 (n=427) or 10 weeks (n=447), according with course (ST or
LT).
Kodesh et al., 201524 Military
personnel
n=158 female soldiers from the Combat Fitness Instructor Course (CFIC) – Israel Defense Forces (IDF);
Age=19.0 (18.1 – 20.2) years old.
I Three months
Butler et al., 201325 Military
personnel
n=108 firefighter training course students;
Age=NR. III* 4 months
McGill et al., 201526 Military
personnel
n=53 men, elite police department;
Age=37.9±5 years old. I, II 5 years
O’Connor et al., 201127 Military
personnel
n=874 marine officer’s students;
Age=18 – 30 years old. I, III**
6 (n=427) or 10 weeks (n=447), according with course (ST or
LT).
Study Participants Sample
Injury’s classification
criteria
Follow-up time
Warren et al., 201528 Athletes n=167 college athletes;
Age=18 – 24 years old. I One Season
Kiesel et al., 200711 Athletes n=46 football players;
Age=NR. III* 4,5 months
Tee et al., 201629 Athletes n=62 rugby players;
Age=NR. III* 6 months
Azzam et al., 201530 Athletes n=34 basketball players;
Age=NR. III# One season
Clay et al., 201631 Athletes n=45 Division I female collegiate rowers;
Age=at least 18 years of age; III One season
Bardenett et al., 201532 Athletes
n=185 (97 women, 88 men) high school athletes – several modalities;
Age=13 – 18 years old.
II, III One-quarter (autumn)
Hammes et al., 201633 Athletes n=238 football players >32 years old;
Age=44±7 years old. I, III 9 months
Kiesel et al., 201434 Athletes n=238 football players;
Age=NR. I, III One preseason
Chorba et al., 201035 Athletes
n=38 collegiate athletes, women – several modalities;
Age=18 – 26 years old.
I, II One season
Dossa et al., 201436 Athletes n=20 hockey players;
Age=16 – 20 years old. II, III
One season (2013-2014)
Weise et al., 201437 Athletes N=144 collegiate athletes – football;
Age=18.9±1.3 years old. I, II, III One season
Garrison et al., 201538 Athletes n=168 collegiate athletes – several modalities
Age=17 – 22 years old. I, II, III One season
Mokha et al, 201639 Athletes
n=84 (20 men) – several modalities; Age=20.4±1.3 years old (men) and 19.1±1.2 (women).
I, II, III One season
Martin et al., 201640 Athletes n=27 adolescent Cricket Pace Bowlers ;
Age=13 – 18 years old. I, II, III One season
N=sample size; NR=Not reported; TI=traumatic injuries; NTI=nontraumatic injuries; AI=all injuries; ICD=International Code of Diseases; ST=short term course; LT=long term course. Criteria used to define the injuries: I) the diagnosis of the injuries was performed by a healthcare professional; II) The registered injuries were related to the training or competition; and III) Only the musculoskeletal injuries with time-loss longer than 24 hours were considered lesions; III*=time-loss longer than 3 weeks; III**=a severe injury promotes withdrawal from the training program; III#=time-loss longer than 7 days.
Table 2. Statistical analysis Statistical
analysis Author Results
Diagnostic accuracy
Bardenett et al., 201532 AUC=0.49; IG versus NIG (P=0.95); s=0.56; e=0,38, +LR=0.91; -LR=1.14
Bushman et al., 201522
FMS (cutoff=14): NTI: s=37%; e=81%; PPV=43%; NPV=77% AUC: 61%; TI: s=28%; e=77%; PPV =19%; NPV=85% AUC: 54%;
AI: s=33%; e=82% VPP=52%; VPN=68% AUC: 60%
Garrison et al., 201538 FMS (cutoff=14): s=0.67, e= 0.73, +LR=2.51; -LR=0.45;
FMS (cutoff=14) + past injuries: s= 0.65, e=0.89, +LR=5.88; -LR=0.39
Hammes et al., 201633 FMS (cutoff=14): AUC (any injury)=0.56; CI 95%=0.47-0.64; P=0.17; AUC (NTI)=0.55; CI 95%=0.46-0.64, P=0.30)
Kiesel et al., 200711 FMS (cutoff=14): s=0.54 (CI 95%=0.34-0.68); e=0.91 (CI 95%=0.83-0.96), +LR=5.92 (CI 95%=1.97-18.37),
-LR=0.51 (CI 95%=0.34-0.79)
Kiesel et al., 201434 FMS (cutoff=14): s=0.26 (CI 95%=0.18-0.36), e= 0.87 (CI 95%=0.84-0.90;
FMS (cutoff=14)+asymmetry: e=0.87 (CI 95% 0.84-0.90)
Chorba et al., 201035 FMS (cutoff=14): s=0.579 (CI 95%=0.335-0.798); e=0.737 (CI 95%=0.488-0.909); +LR=2.200
(CI 95%=0.945-5.119)
Mokha et al, 201639 FMS (cutoff=14): s=26,3%; e=58.7%
Dossa et al., 201436 s=0.5 (CI 95%=0.189-0.811); e=0.7 (CI 95%=0.348-0.930); +LR=1.67 (CI 95%=0.54-5.17); -LR=0.71
(CI 95%=0.34-1.50); PPV=62.50% (CI 95%=0.25-0.91); NPV=58.33% (CI 95%=0.28-0.85)
McGill et al., 201526 s=0.28 (low back pain) e 0.42 (AI); e=0.76 (low back pain) and 0.47 (AI); P=NR
O’Connor et al., 201127 s=0.452 (AI), 0.12 (severe injury) and 0.13 (NTI).
e=0.782 (AI), 0.939 (severe injury) and 0.901 (NTI). AUC=0.58 (AI), 0.53 (severe injury) and 0.52 (NTI). Table 1. Continuation
Statistical
analysis Author Results
Diagnostic accuracy
Weise et al., 201437
AUC=0.491 (P=0,854), s=0.495;1- e=0.429, +LR=1.154 (P=0.819);
UL injuries (FMS cutoff =17): AUC =0.483 (P=0.769); s=0.500; 1-e=0.464; +LR =1.078 (P=0.765) LL injuries (FMS cutoff =17): AUC=0.486 (p=0.766); s=0.480; 1-e=0.464; +LR =1.035(P=0.762) NTI: AUC=0.490 (P=0.846); s=0.232; 1-e=0.216; RVP=1.075(P=0.843);
Injuries with time-loss > 10 days: AUC=0.422(P=0.194), s=0.996; e=0.974; +LR=0.992(P=0.187) Tee et al., 201629 s=0.83 (CI 95%=0.52-0.98); e=0.46 (CI 95%=0.35-0.48); AUC=0.68 and P=0.049
Warren et al., 201528 s=0.54; e=0.46; AUC=0.48
Kodesh et al., 201524 s=0.42; e=0.63; AUC=0.51
Odds Ratios
Bushman et al., 201522 FMS (cutoff=14): OR=1.96 (P=0.01)
Garrison et al., 201538 FMS (cutoff=14): OR=5.71; CI 95%=2.73-11.51
Kiesel et al., 200711 FMS (cutoff=14): OR=11.67 (CI 95%=2.47-54.52)
Chorba et al., 201035 FMS (cutoff=14): OR=3.850 (CI 95%=0.980-15.13)
Mokha et al, 201639 FMS (cutoff=14): OR=2.07 (P=0.15).
FMS (cutoff=14)+asymmetry: OR=5.27 (CI 95%=1.93-14.40; P=0.001)
O’Connor et al., 201127 OR: AI (OR=2.0; (CI 95%=1.3-3.1, P=0.002), NTI (OR=1.4; CI 95%=0.71-2.6, P=0.35); severe injuries
(OR=2.0; CI 95%=1.0-4.1; P=0.05)
Weise et al., 201437
FMS (cutoff=17): AI-OR =1.425 (P=0.392); CI 95%=NR; UL injuries-OR=1.134 (P=0.793); LL injuries-OR=1.113 (P=0.789);
FMS (cutoff=18): NTI-OR=0.949 (P=0.926); FMS (cutoff=12): Injuries with “time-loss” >10 days: OR=2.154 (P=0.380).
Lisman et al., 201323
ST/FMS (cutoff=14): AI-OR=2.04 (CI 95%=1.32-3.15) and P=0.001; NTI-OR=1.34 (CI 95%=0.70-2.56) and P=0.382; TI–OR=1.92 (CI 95%=1.21-3.02) and P=0.005; LT/FMS (cutoff=14): AI-OR=2.10 (CI 95% =1.34-3.29) and P=0.001; TI-OR=1.80 (CI 95%=1.12-2.89) and P=0.015; NTI: NR.
Butler et al., 201325 OR: 1.21 (CI 95%=1.01-1.42)
Tee et al., 201629 OR=4,3 (CI 95%=0.9-21.0)
Warren et al., 201528 OR=1.01 (CI 95%=0.53-1.91)
Kodesh et al., 201541 OR=0.98 (CI 95%=0.87-1.10)
Relative Risk
Bushman et al., 201522 FMS (cutoff=14): RR=1.86 (NTI) and RR=1.49 (AI) – P=0.01)
Kiesel et al., 201434 FMS (cutoff=14): RR=1.87 (CI 95%=1.20-2.96)
Mokha et al, 201639 FMS (cutoff=14): RR=2.73 (CI 95% =1.36 – 5.44; P=0.001);
FMS (cutoff=18): RR=0.56 (CI 95%=0.34-0.93)
O’Connor et al., 201127
ST – FMS (cutoff=14): RR (AI)= 1.91 (CI 95%=1.21-3.01; P<0.01); LT – FMS (cutoff=14): RR (AI)=1.65 (CI 95%=1.05-2.59; p=0.03); ST+LT: RR (AI)=1.5 (P=0.003)
Azzam et al., 201530 RR=0.86 (CI 95%=0.42-1.76)
Martin et al., 201640 RR=0.59 (CI 95%=0.16-2.20)
Kodesh et al., 201541 RR*=1.49 (CI 95%=0.998-2.23)
P=P-value; NR=Not reported; IG=injured group; NIG=non-injured group; CI 95%=confidence interval to 95%; s=sensibility; e=specificity; PPV=positive predictive value; NPV=negative predictive value; ROC: Receiver Operating Characteristic; AUC=area under the “receive operator curve”; TI=traumatic injuries; NTI=nontraumatic injuries; AI=all injuries; FMS=Functional Movement Screen; +LR=Positive likelihood ratio; -LR=negative likelihood ratio; ICD=International Code of Diseases; UL=upper limbs; LL=lower limbs; ST=short term course; LT=long term course; OR=odds ratios; RR=relative risk.
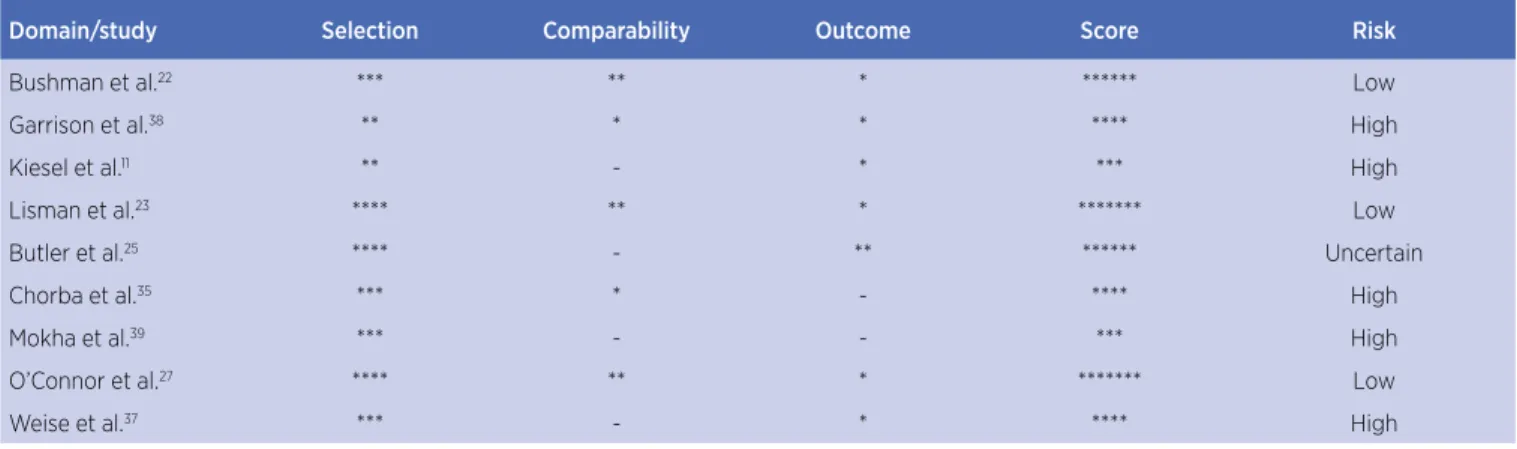
Table 3. Bias risk of studies that evaluated the association of FMS™ with the risk of musculoskeletal injuries with Newclastle-Ottawa Scale (NOS)
Domain/study Selection Comparability Outcome Score Risk
Bushman et al.22 *** ** * ****** Low
Garrison et al.38 ** * * **** High
Kiesel et al.11 ** - * *** High
Lisman et al.23 **** ** * ******* Low
Butler et al.25 **** - ** ****** Uncertain
Chorba et al.35 *** * - **** High
Mokha et al.39 *** - - *** High
O’Connor et al.27 **** ** * ******* Low
Weise et al.37 *** - * **** High
Table 2. Continuation
Domain/study Selection Comparability Outcome Score Risk
Kiesel et al.34 ** - - ** High
Bardenett et al.32 *** - ** ***** Uncertain
Dossa et al.36 ** - * *** High
Hammes et al.33 *** ** * ****** Low
McGuill et al.26 ** - * *** High
Tee et al.29 *** - * **** High
Azzam et al.30 ** - ** **** High
Martin et al.40 *** - ** ***** Uncertain
Warren et al.28 *** - ** ***** Uncertain
Kodesh et al.24 *** - * **** High
Clay et al.31 *** - * **** High
Domains of Newcastle-Ottawa Scale (NOS): Selection (representativeness of the exposed cohort; selection of the nonexposed cohort; ascertainment of exposure and demonstration that the outcome of interest was not present at the beginning of the study); Comparability (principal factor and any additional factor); and Outcome (assessment of outcome; if the follow-up was long enough for producing outcomes; and adequacy of follow-up of cohorts).
Table 3. Continuation
DISCUSSION
This review aimed to evaluate the association between
FMS™ and DMA™ with the risk of musculoskeletal
injuries. No studies with DMA™ were found, probably
due to its recent development
5. Based on the statistical
analysis of most studies evaluated, FMS™ is associated
with the risk of musculoskeletal injuries. Considering the
cohort studies by Bushman et al.
22and O’Connor et al.
27,
which had the lowest risk of bias, this association is
strengthened (Table 3).
According to Table 2, the FMS™ showed sensitivity
values ranging from 26 to 68%; specificity from 38 to 96%;
PPV from 19 to 91%; NPV from 28 to 85%; and AUC
from 0.42 to 0.68 (Table 2). Therefore, it is noticeable
that the indicators of diagnostic accuracy are divergent
between the 12 studies. OR values also ranged from 0.53
to 11.67, which corresponds, according to the literature,
to absent and large effect sizes, respectively
41. Only seven
studies calculated the RR
20, 27, 34, 35, 40, 42, 43, whose results
were RR=1.86 (overuse injuries)
22, RR=1.49 (traumatic
injuries)
22; and RR=-0.5
40to 2.73
39(any injury). Thus, a
low score in FMS™ is associated with higher injury risk,
although this result is limited by the number of studies
that calculate the RR and the high risk of bias in two of
those studies
27,34.
Considering the results of the studies with low
risk of bias (Table 3), it is verified that FMS has a
low sensitivity
20,22,40, a good specificity
20,33, and AUC
values slightly above chance
20,22. Three out of the four
studies with low risk of bias used samples composed
of soldiers
20,33,40. These studies showed a higher
score in the “selection” domain. This observation is
a consequence of a greater representativeness of the
samples in military courses, an adequate selection of the
unexposed cohort (which is part of the same population)
and the monitoring of the exhibition (based on the
analysis of base records, such as military base records).
At the same time, military groups are generally more
homogeneous regarding various characteristics (age,
level of fitness, volume of physical exercise, routine,
etc.). Only six studies analyzed the influence of potential
confounders
20–22,33,40,41. Thus, all other studies have a
“high” or “uncertain” risk of bias, once the influence of
other risk factors on the result obtained was not reported.
Most of the samples used had little representativeness,
especially in studies with athletes. In addition, in many
cases, attrition rates were neither quoted nor justified.
In some cases, the absence of cases was not confirmed
at the beginning of the studies, and it was not clear
whether there was blinding of the participant and the
professional responsible for the follow-up, which limits
the interpretation of the results.
rating of injuries does not follow the same criteria in all
studies. Some authors used the definition proposed by
Hägglund et al.
42, which defines a musculoskeletal injury
when three criteria are related to injuries: association
with athletic participation; necessity for health care;
and time-loss with restrict participation for at least
24 hours. However, some authors included only severe
injuries (with time-loss larger than three weeks)
11or any
injury
19,20,22,24,27,40,41. Third, statistical analysis based on
indicators of diagnostic accuracy or simple calculation
of OR limits the interpretation
41. Diagnostic accuracy
indicators are found in studies evaluating the validity of
an index test compared with a reference standard
43,44. In
injury prediction studies, considering the occurrence of
injuries as a reference pattern may limit the interpretation
of the results, since a high-risk individual may not suffer
an injury, especially if he/she is not exposed to the risk
factor. The use of OR evaluates the chance of a
high-risk individual to develop injuries. However, it does
not consider the injury incidence
41. Therefore, the most
appropriate calculation is the relative risk.
This systematic review was the first to evaluate the
association of FMS™ and DMA™, categorizing by type
of statistical analysis performed. However, the small
number of studies evaluating the RR of FMS™ and the
absence of studies with DMA™ were limitations. In
future studies, the control of some biases is recommended.
Most of the studies did not perform pairing of variables
such as gender, age and other variables of interest, such as
sport modalities
45. In this case, we suggest using logistic
regression analysis. Another critical point was the lack
of confirmation of case of absences in the baseline, as
well the non-blinding of the evaluators responsible for
monitoring the sample. In theory, they should not know
whether the participant belonged to the group exposed to
the risk factor. Finally, the development of studies about
the association of DMA™ with the risk of musculoskeletal
injuries is suggested, since no studies with this method
were found, which uses movements present in several
sport gestures with two-dimensional analysis
5.
CONCLUSION
From the studies of this systematic review, the
conclusion was that movement dysfunction, evaluated by
FMS™, may be associated with the risk of injury in people
who practice physical exercises. No studies evaluating the
association between the DMA™ score and the risk of
injury were found. It is recommended that future studies
carry out greater control of selection, comparison and
outcome biases, and perform a meta-analysis.
ACKNOWLEDGMENTS
We are grateful for the English language support
provided by Lucas de Assis Borges.
REFERENCES
1. Taanila H, Suni JH, Kannus P, Pihlajamäki H, Ruohola J-P, Viskari J, et al. Risk factors of acute and overuse musculoskeletal injuries among young conscripts: a population-based cohort study. BMC Musculoskelet Disord. 2015;16(1):104. doi: 10.1186/s12891-015-0557-7 2. O’Brien J, Finch CF. The implementation of musculoskeletal
injury-prevention exercise programmes in team ball sports: a systematic review employing the RE-AIM framework. Sport Med. 2014:1305-18. doi: 10.1007/s40279-014-0208-4
3. Taanila H, Suni J, Pihlajamäki H, Mattila VM, Ohrankämmen O, Vuorinen P, et al. Aetiology and risk factors of musculoskeletal disorders in physically active conscripts: a follow-up study in the finnish defence forces. BMC Musculoskelet Disord. 2010;11:146. doi: 10.1186/1471-2474-11-146
4. McCunn R, Aus der Fünten K, Fullagar HHK, McKeown I, Meyer T. Reliability and association with injury of movement screens: a critical review. Sport Med. 2015;1-19. doi: 10.1007/s40279-015-0453-1 5. Nessler TD, Dunn EH. Dynamic movement assessment: prevent
injury and enhance performance kindle edition. Publiwide, USA, 2014
6. Parkkari J, Taanila H, Suni J, Mattila VM, Ohrankämmen O, Vuorinen P, et al. Neuromuscular training with injury prevention counselling to decrease the risk of acute musculoskeletal injury in young men during military service: a population-based, randomised study. BMC Med. 2011;9(1):35. doi: 10.1186/1741-7015-9-35
7. Munro A, Herrington L, Carolan M. Reliability of 2-dimensional video assessment of frontal-plane dynamic knee valgus during common athletic screening tasks. J Sport Rehabil. 2012;21:7-11.
8. Gwynne CR, Curran SA. Quantifying frontal plane knee motion during single limb squats: reliability and validity of 2-dimensional measures. Int J Sports Phys Ther. 2014;9(7):898-906. 9. Cook G, Burton L, Hoogenboom B. Pre-participation screening:
the use of fundamental movements as an assessment of function – part 1. N Am J Sports Phys Ther. 2006;1(2):62-72. 10. Schneiders AG, Davidsson A, Hörman E, Sullivan SJ. Functional
movement screen normative values in a young, active population. Int J Sports Phys Ther. 2011;6(2):75-82.
12. McCall A, Davison M, Andersen TE, Beasley I, Bizzini M, Dupont G, et al. Injury prevention strategies at the FIFA 2014 World Cup: perceptions and practices of the physicians from the 32 participating national teams. Br J Sports Med. 2015;49(9):603-8. doi: 10.1136/bjsports-2015-094747
13. Kraus K, Schültz E, Taylor WR, Doyscher R. Efficacy of the functional movement screen: a review. J Strength Cond Res. 2014;28(12):3571-84. doi: 10.1519/JSC.0000000000000556 14. Dorrel BS, Long T, Shaffer S, Myer GD. Evaluation of the
functional movement screen as an injury prediction tool among active adult populations: a systematic review and meta-analysis. Sport Heal A Multidiscip Approach. 2015;7(6):532-7. doi: 10.1177/1941738115607445
15. Krumrei K, Flanagan M, Bruner J, Durall C. The accuracy of the functional movement screenTM to identify individuals with an elevated risk of musculoskeletal injury. J Sport Rehabil. 2014;23(4):360-4. doi: 10.1123/jsr.2013-0027
16. McCall A, Carling C, Davison M, Nedelec M, Le Gall F, Berthoin S, et al. Injury risk factors, screening tests and preventative strategies: a systematic review of the evidence that underpins the perceptions and practices of 44 football (soccer) teams from various premier leagues. Br J Sports Med. 2015;49(9):583-9. doi: 10.1136/bjsports-2014-094104
17. Hoffman MD, Krishnan E. Health and exercise-related medical issues among 1,212 ultramarathon runners: baseline findings from the Ultrarunners Longitudinal TRAcking (ULTRA) Study. PLoS One. 2014;9(1):e83867. doi: 10.1371/journal.pone.0083867 18. Knapik JJ, Ang P, Reynolds K, Jones B. Physical fitness,
age, and injury incidence in infantry soldiers. J Occup Med. 1993;35(6):598-603.
19. Knapik JJ, Graham B, Cobbs J, Thompson D, Steelman R, Jones BH. A prospective investigation of injury incidence and injury risk factors among army recruits in military police training. BMC Musculoskelet Disord. 2013;14. doi: 10.1186/1471-2474-14-32 20. Moher D, Liberati A, Tetzlaff J, Altman DG, Grp P. Preferred
reporting items for systematic reviews and meta-analyses: the PRISMA statement (Reprinted from Annals of Internal Medicine). Phys Ther. 2009;89(9):873-80. doi: 10.1371/journal.pmed.1000097 21. Wells GA, Shea B, Connell DO, Peterson J, Welch V, Losos M,
et al. The Newcastle-Ottawa Scale (NOS) for assessing the quality of nonrandomised studies in meta-analyses [Internet]. 2000.
22. Bushman TT, Grier TL, Canham-Chervak M, Anderson MK, North WJ, Jones BH. The Functional Movement Screen and injury risk: association and predictive value in active men. Am J Sports Med. 2016;44(2):297-304. doi: 10.1177/0363546515614815 23. Lisman P, O’Connor FG, Deuster PA, Knapik JJ. Functional
movement screen and aerobic fitness predict injuries in military training. Med Sci Sports Exerc. 2013;45(4):636-43. doi: 10.1249/MSS.0b013e31827a1c4c
24. Kodesh E, Shargal E, Kislev-Cohen R, Funk S, Dorfman L, Samuelly G, et al. Examination of the effectiveness of predictors for musculoskeletal injuries in female soldiers. J Sport Sci Med. 2015;515-21.
25. Butler RJ, Contreras M, Burton LC, Plisky PJ, Goode A, Kiesel K. Modifiable risk factors predict injuries in firefighters during training academies. Work. 2013;46(1):11-7. doi: 10.3233/WOR-121545
26. McGill SM, Frost DM, Lam T, Finlay T, Darby K, Cannon J. Can fitness and movement quality prevent back injury in elite task force police officers? A 5-year longitudinal study. Ergonomics. 2015;139:1-8. doi: 10.1080/00140139.2015.1035760
27. O’Connor FG, Deuster PA, Davis J, Pappas CG, Knapik JJ. Functional movement screening: Predicting injuries in officer candidates. Med Sci Sports Exerc. 2011;43(12):2224-30. doi: 10.1249/MSS.0b013e318223522d
28. Warren M, Smith CA, Chimera NJ. Association of the Functional Movement Screen with injuries in division I athletes. J Sport Rehabil. 2015;24:163-70. doi: 10.1123/jsr.2013-0141.
29. Tee JC, Klingbiel JFG, Collins R, Lambert M, Coopoo Y. Preseason Functional Movement Screen component tests predict severe contact injuries in professional rugby union players. J Strength Cond Res. 2016; 30(11):3194-203. doi: 10.1519/JSC.0000000000001422
30. Azzam MG, Throckmorton TW, Smith RA, Graham D, Scholler J, Azar FM. The Functional Movement Screen as a predictor of injury in professional basketball players. Curr Orthop Pract. 2015;26(6):619-23. doi: 10.1097/BCO.0000000000000296 31. Clay H, Mansell J, Tierney R. Association between rowing
injuries and the functional movement screen in female collegiate division I rowers. Int J Sports Phys Ther. 2016;11(3):345–9.
32. Bardenett SM, Micca JJ, DeNoyelles JT, Miller SD, Jenk DT, Brooks GS. Functional Movement Screen normative values and validity in high school athletes: can the FMSTM be used as a predictor of injury? Int J Sports Phys Ther. 2015;10(3):303-8. 33. Hammes D, Aus der Fünten K, Bizzini M, Meyer T. Injury prediction
in veteran football players using the Functional Movement ScreenTM. J Sports Sci [Internet]. 2016;34(14):1371-9. Available from: http://www.ncbi.nlm.nih.gov/pubmed/26939907. doi: doi: 10.1080/02640414.2016.1152390
34. Kiesel KB, Butler RJ, Plisky PJ. Prediction of injury by limited and asymmetrical fundamental movement patterns in american football players. J Sport Rehabil. 2014;23(2):88-94. doi: 10.1123/jsr.2012-0130
35. Chorba RS, Chorba DJ, Bouillon LE, Overmyer CA, Landis JA. Use of a functional movement screening tool to determine injury risk in female collegiate athletes. N Am J Sports Phys Ther. 2010;5(2):47-54
36. Dossa K, Cashman G, Howitt S, West B, Murray N. Can injury in major junior hockey players be predicted by a pre-season functional movement screen – a prospective cohort study. J Can Chiropr Assoc. 2014;58(4):421-7.
37. Weise W, Boone J, Mattacola C, McKeon P, Lee T. Determination of the functional movement screen to predict musculoskeletal injury in intercollegiate athletics – PROQUEST. Athl Train Sport Healthc. 2014;6(4):161-9. doi: 10.3928/19425864-20140717-01 38. Garrison M, Westrick R, Johnson MR, Benenson J. Association
between the functional movement screen and injury development in college athletes. Int J Sports Phys Ther. 2015;10(1):21-8.
40. Martin AC, Olivier B, Benjamin N. The Functional Movement Screen in the prediction of injury in adolescent cricket pace bowlers: an observational study. J Sport Rehabil. 2017;26(5):386-95. doi: 10.1123/jsr.2016-0073
41. Chen H, Cohen P, Chen S. How big is a big odds ratio? Interpreting the magnitudes of odds ratios in epidemiological studies. Commun Stat – Simul Comput. 2010;39(4):860-4. doi: 10.1080/03610911003650383
42. Hägglund M, Waldén M, Bahr R, Ekstrand J. Methods for epidemiological study of injuries to professional football players: developing the UEFA model. Br J Sports Med. 2005;39(6):340-6. doi: 10.1136/bjsm.2005.018267
43. Oliveira M, Gomes A, Toscano C. QUADAS and STARD: Evaluating the quality of diagnostic accuracy
studies. Rev S aude Publica. 2011;45(2):416-22. doi: 10.1590/S0034-89102011000200021
44. Leeflang MMG, Deeks JJ, Gatsonis C, Bossuyt PMM. Systematic reviews of diagnostic test accuracy. Ann Intern Med. 2008;149(12):889-97. doi: 10.7326/0003-4819-149-12-200812160-00008
45. Margulis A, Pladevall M, Riera-guardia N, Varas-lorenzo C, Hazell L, Berkman N, et al. Quality assessment of observational studies in a drug-safety systematic review, Comparison of two tools: The Newcastle-Ottawa scale and the RTI item bank. Clin Epidemiol. 2014;6:981-93. doi: 10.2147/CLEP.S66677