Alkalinity, inorganic carbon and CO
2flux variability during extreme
rainfall years (2010-2011) in two polluted tropical estuaries NE Brazil
The susceptibility of coastal environments to shifts in the biogeochemical cycles of carbon and nutrients driven by anthropogenic pressure and climate change is a real challenge for the scientific community. This paper evaluated the effects of an extreme rainfall event over the nutrients and carbonate parameters in two polluted tropical estuaries. Surface water samples were taken seasonally along a salinity gradient in the Capibaribe and Barra de Jangadas estuaries in order to investigate the spatial and seasonal variability of dissolved nutrients, chlorophyll-a, dissolved oxygen, total alkalinity, inorganic carbon, partial pressure of CO2 (pCO2) and CO2 fluxes. The increased riverine influence caused by the fluvial flooding during the extremely rainy season augmented the nitrogen concentrations in the plumes, which also presented reduced salinity, alkalinity and dissolved oxygen values. In the Capibaribe plume it has also shifted the mean CO2 flux value of - 4.01 mmolC m-2 d-1 during the dry season, to a positive mean flux of + 5.7 mmolC m-2 d-1 during the rainy season. Within the estuaries the BOD5,20 and dissolved phosphorus values were higher during the dry season (p<0.0001), they showed positive correlation with the phytoplanktonic blooms that reached a chl-a value of 85 mg m-3 in the Capibaribe. The high alkalinity found in both estuaries, with mean values between dry and wet seasons respectively from 1808 to 1373 µmol kg-1 in the Capibaribe estuary and 1616 to 1058 µmol kg-1 in Barra de Jangadas estuary, may act as a buffer to the process of coastal acidification due to eutrophication. The increased rivers discharge lead to a greater transport of organic matter and nutrients to the coast, decreasing the oxygen availability and shifting the metabolic status of the estuarine plume to heterotrophic, whereas increased the water quality within the estuaries due the flushing promoted by the extreme rainfall event.
A
bstrAct
Felipe Lima Gaspar
1*, Barbara Ramos Pinheiro
1, Carlos Esteban Delgado Noriega
1, Moacyr
Araujo
1, Nathalie Lefèvre
1, Manuel de Jesus Flores Montes
11 Laboratório de Oceanografia Química da Universidade Federal de Pernambuco
(Av. da Arquitetura s/n - Recife - PE 50740540 - PE)
*Corresponding author: [email protected]
Descriptors:
Anthropogenic pollution, Ocean
acidification, Eutrophication, Extreme event.
A suscetibilidade dos ambientes costeiros às mudanças nos
ciclos biogeoquímicos do carbono e nutrientes impulsionados
pela pressão antrópica e mudanças climáticas é um verdadeiro
desafio para a comunidade científica. Este artigo avaliou os efeitos de um evento de precipitação extrema sobre os parâmetros de oxigênio, nutrientes e do sistema carbonato em dois estuários tropicais poluídos. As amostras de água superficial foram retiradas sazonalmente ao longo de um
gradiente de salinidade nos estuários do Capibaribe e Barra de
Jangadas, a fim de investigar a variabilidade espacial e sazonal dos nutrientes dissolvidos, clorofila-a, oxigênio dissolvido,
alcalinidade total, carbono inorgânico, pressão parcial de CO2 (pCO2) e fluxos de CO2. O aumento da influência ribeirinha
causada pelas inundações fluviais durante a estação de precipitação extrema aumentou as concentrações de nitrogênio
nas plumas dos estuários, que também apresentaram valores
reduzidos de salinidade, alcalinidade e oxigênio dissolvido. Na pluma do Capibaribe o valor médio de fluxo de CO2 também mudou, passou de - 4,01 mmolC m-2 d-1 durante a estação seca, para um fluxo médio positivo de + 5,7 mmolC m-2 d-1 durante a estação chuvosa. Dentro dos estuários, os valores de BOD5,20 e fosfato dissolvido foram maiores durante a estação
seca (p<0,0001) e apresentaram correlação positiva com
os blooms fitoplanctônicos que atingiram um valor de chl-a
de 85 mg m-3 no Capibaribe. A alta alcalinidade encontrada
em ambos os estuários, com valores médios entre estações
seca e chuvosa, respectivamente, de 1808 a 1373 μmol kg-1
no estuário Capibaribe e 1616 a 1058 μmol kg-1 no estuário Barra de Jangadas, pode atuar como um amortecedor para
o processo de acidificação costeira devido à eutrofização. O
aumento da descarga dos rios levou a um maior transporte de matéria orgânica e nutrientes para o litoral, diminuindo a
disponibilidade de oxigênio e deslocando o estado metabólico da pluma estuarina para heterotrófico, enquanto aumentou a
qualidade da água dentro dos estuários devido ao aumento de
descarga promovido pela precipitação extrema.
r
esumo
Descritores:
Poluição antrópica, Acidificação
marinha, Eutrofização, Evento extremo.
INTRODUCTION
Estuaries play an essential role in the transportation to and transformation of carbon of continental and atmo-spheric origin in the ocean (Sabine et al., 2004; Chen, 2004; Flores Montes et al., 2011; Travassos et al., 2016; Guenther et al., 2015). Some studies have shown that changes in land use and land cover in river basins can alter the natural balance of bicarbonate ions and contribute to alkalinity inputs into estuaries (Cai and Wang, 1998; Wang and Cai, 2004). However, the effect of the allochtonous and autochtonous inputs on the balance of alkalinity and nutrients in estuaries remains uncertain (Flores Montes et al, 2011). This may affect the magnitude of the capture/ emission of CO2 and lead to changes in the natural balance of production and mineralization of organic matte remains uncertain (Borges, 2011).
The focus of recent studies of inorganic carbon dy-namics are the large rivers and estuaries, especially in mid and high latitudes, despite the significant contribution of small tropical rivers and estuaries, which together cover an area larger than the temperate estuaries (orges). As a re -sult of limited data from tropical regions, current estimates of the global average flux of CO2 are biased (Cai, 2011). Moreover, the CO2 flux to the atmosphere depends on the calculation of the exchange rate k, which shows great vari -ability related to local environmental features such as tide, depth, direction and wind intensity (Raymond and Cole, 2001; Abril and Borges, 2005; Borges et al., 2004).
Anthropogenic pressure adds various stressors such as pollution, overfishing, changes in the land use and cover, amongst others to the coastal environments. These im -pacts are expected to increase in the future with continued changes in the global climate system and increases in hu-man population levels (Howard et al., 2013). According to Trenberth (2011), it is expected that the effect of climate change on winds and precipitation may be moderate, but will vary regionally. Consequently, these climate change effects may alter the magnitude of the CO2 fluxes at the air/ water interface and the water residence time in estuaries, which is an important factor in the regulation of alkalinity in estuarine environments (Cai, 2011).
The Brazilian coast extends for over 8000 km and is home to 50.7 million people, equivalent to 26.6% of the country’s population (IBGE, 2010). Population growth in the coastal region has led to an increase in nutrient export to the coast, due to the release of untreated sew -age into rivers and estuaries (Noriega and Araujo, 2009).
According to Noriega et al. (2013) the estimated average flux for the Capibaribe estuary ranges from 10.95 to 17.52 molCO2 m-2 y-1 during high tide in a regular rainfall year. Those authors also reported the average emissions of ̴ 0.35 Tg C y-1 for estuaries in the Brazilian Northeast.
In the present study, we analyzed the seasonal and spa -tial distribution of nutrients, alkalinity, dissolved inorganic carbon, and pCO2 and CO2 fluxes in two estuaries located in areas of high population density during a seasonal cycle of extremely heavy rainfall using measurements of total alkalinity, pH, temperature, salinity, dissolved inorganic nitrogen, total phosphorus (TP) and silicate.
METHODS
Study site
There are three major rivers in the Recife Metropolitan Region (RMR), which are Capibaribe, Jaboatão and Pirapama, whose waters are used for public water supply and the disposal of industrial effluents and domestic sew -age without appropriate treatment. The land use activity in these watersheds is primarily urban and industrial, includ-ing areas of sugarcane monoculture, and some vestigial ar-eas of Atlantic Forest and mangrove forest (CPRH, 2011). Several studies have identified an increase in nutrient con -centrations, human eutrophication and algal blooms in this region in recent years (Travassos et al., 1993; Koening et al., 1995; Feitosa et al., 1999; Noriega and Araujo, 2009; Noriega and Araujo, 2011; Flores Montes et al., 2011; Guenther et al., 2015) and organic pollution (Paulo et al., 2011; Travassos et al., 2016).
The Capibaribe River watershed covers a drainage area of ≈7,557 km2 and is used by a population of ap-proximately 1,328,361 inhabitants (CPRH, 2011). The Capibaribe estuary has a mean depth of 3m and an ap-proximate area of ≈19 km2 located entirely within the city of Recife.
The estuarine area of the Barra de Jangadas (BJ) is formed by the confluence of the Jaboatão and Pirapama rivers, which together drain an area of approximately 1,022 km² and whose waters are used by a population of approximately 1,347,053 inhabitants (CPRH, 2011). This estuary, covering approximately 14 km2, and has an aver-age depth of 2.6 m and a variable width of approximately 150 m.
forms coastal plains constituted by sandy soils closer to the coast and inland there are the occurrence of yellow-red latosols and podsols, moreover small stretches of alluvial eutrophic soils along river valleys (Silva, 1995).
The river flows are intermittent in the inner semi-arid portions of the Pernambuco state depending on the amount of rainfall, but are permanent where they flow into the Atlantic Ocean. The estuaries located in the RMR come under a semidiurnal tidal regime with present mean ranges of 1.3 m during the neap tide and 1.8 m during spring tide (Araujo et al., 1999).
Sampling
The estuaries were divided into different segments ac -cording to the longitudinal saline gradient classification proposed by McLusky (1992). The upper estuary was de -fined as the area where salinities are <2.5, the medium es -tuary 2.5<S≤30 and the upper es-tuary S>30 . Six sampling campaigns were performed bimonthly between November 2010 and September 2011 at 12 stations distributed across the Capibaribe estuary and 11 stations in the Barra de Jangadas estuary (Fig. 1). There were also four sampling stations located within each estuarine plume.
The samples were taken from the surface layer dur-ing the low-water sprdur-ing tide to assess the influence of the riverine and urban inputs to the coastal areas. The water samples were collected with Niskin oceanographic bottles and sent to the Laboratory of Chemical Oceanography and the Primary Productivity Lab, at the Federal University of Pernambuco (UFPE) where they were processed and analyzed.
Temperature and salinity were determined in situ with a CTD SBE19. pH was measured on board with a Ross combination electrode, measured on the total scale with a precision of ±0.01 units and accuracy of 0.1%.
The monthly meteorological data of precipitation, air temperature, atmospheric pressure and wind speed at 10m above sea surface were obtained from the Pernambuco Agency of Water and Climate (APAC) and the National Institute of Meteorology (INMET). River discharge data were obtained from the National Water Agency (ANA).
Analyses
Dissolved oxygen (DO) was determined using the modified Winkler method (Strickland and Parsons, 1972) with an accuracy of ± 1.3 µmol.L-1. Oxygen saturation was
calculated using temperature and salinity data, in accor-dance with Garcia and Gordon (1992).
Samples for the analysis of the biological oxygen de -mand (BOD) were collected in accordance with the rec -ommendations described in Standard Methods - APHA (1995), and incubated for five days at 20°C (BOD5,20).
The alkalinity was determined in unfiltered water sam -ples by potentiometric titration with H2SO4 0.016 mol L
-1 as described in Radtke et al. (2012) with a precision of 15 μmol kg-1 and an accuracy of 2%.
The samples for determination of total dissolved phos-phorus (TDP) precision 0.1 μmol kg-1 , and accuracy of 1%, dissolved reactive silicate Si(OH)4 – precision 1 μmol kg-1 and accuracy 2% , dissolved inorganic nitrogen (DIN), which is the sum of ammonia-N - (NH4+ + NH
3) precision 0.1 μmol kg-1 and accuracy 2%, nitrite (NO
2
-) precision 0.1 μmol kg-1 and accuracy 1%; and nitrate (NO
3 -) preci-sion 0.5 μmol kg-1 and accuracy 1% , were analyzed by the methods described in Grasshoff et al. (1983) and are expressed in μmol kg-1. The method for determining phy -toplankton biomass (Chl-a) was the spectrophotometric analysis described in UNESCO (1966).
Calculations
Carbon dioxide solubility in the water was calculated in accordance with Weiss (1974). Total inorganic carbon TCO2 = [CO2*] + [HCO
3 -] + [CO
3
2-] and the partial pres-sure of CO2 (pCO2) were calculated with the CO2calc soft-ware, developed by Robbins et al. (2010), using alkalinity, pH, temperature, salinity, TP and reactive silica data. We used the dissociation constants of carbonic acid in accor-dance with Millero et al. (2006), and the dissociation con -stants of borate and sulfate given, respectively, by Dickson (1990a) and Dickson (1990b).
CO2 flux was calculated as follows:
(Eq. 1)
Where F(CO2) is the air/water flux of CO2 (mmol m-2 d-1), k(CO2) is the transfer velocity of CO2, KHCO2 is the sol-ubility of CO2 (Weiss, 1974) and ΔpCO2 is the difference of pCO2 between surface water and the atmosphere. Positive values indicate outgassing towards the atmosphere.
The pCO2 in the atmosphere was calculated as follows:
(Eq. 2)
(
CO
)
(
CO K
).
.
pCO
F
2=
k
2 HCO2T
2.(
)
CO
CO
P
H O
Figure 1. Map of the study area with the respective sampling stations. The numbers indicate the river plume stations. The M indicates
the meteorological stations at which the precipitation, evaporation and wind speed data were recorded.
Where Patm is the atmospheric pressure and xCO2atm is the molar concentration of CO2 in dry air in parts per million, obtained from the NOAA station located in Maxaranguape, 330 km north of Recife. Finally pH2O is the vapor pressure of water at the sea surface.
The gas transfer velocity k(CO2) was calculated using the formula of Raymond and Cole (2001):
(CO) , .exp( . ( )) . ( / )
K 1 51 0 35 u Sc 600 ,
2 = -0 5 (Eq. 3)
Where u (m.s-1) is the mean wind speed 10 m above the sea surface on the sampling campaign day, and Sc is the Schmidt number in salt water for the CO2, calculated as a function of temperature.
An empirical model developed by Cole and Cloern (1987) for estimating phytoplankton productivity in the coast -al areas was used. The above authors found a mean coefficient of determination r2=0.82 using nine data sets and a highly
significant relationship (p<0.001) between production and B, Zp, and I for the pooled data (n=211) given by:
(
)
P mmol Cm d
-2 -1=
B
x Zp x
I
(Eq. 4)
where B represents the phytoplankton biomass (mg m-3 of chlorophyll-a), Zp is the photic depth in meters (measured by Secchi disk), and I is the surface irradiance.
The depth limit of the photic layer (Zp), which receives 1% of the radiation that reaches the surface, was calculated using the equation Zp=4.61/k proposed by Cole and Cloern (1987), where k is the coefficient of light attenuation calcu -lated using the depth of disappearance of the Secchi disk (Zds), (k=1,7/Zds) as described by Poole and Atkins (1929).
inpe.br. These data were converted to photosynthetically active radiation (PAR - cal.g. cm-2.d-1) by applying the correction factor of 0.47, as described by Vollenweider (1974). Values of PAR were converted into values of quantum E (m2 d-1) using a correction factor of 0.192, as described by Colijn (1982).
The seasonal water and salt flux average budgets for each estuary were calculated according to Gordon et al. (1996) and the residence time we calculated by equation 5.
/
Vol
estuaryV V
X Rx
=
Q
V
(Eq.5)
Statistics
The data normality was tested using the Shapiro-Wilks test. We used the t-test to compare the historical means with the 2010/2011 monthly means of precipita -tion and wind velocities, with a significance level α=0.05. Since some of the variables didn’t showed a normal dis -tribution due to a reduced data pool, we used the Kruskal-Wallis test, with a level of significance α=0.05 to identify whether there were seasonal and/or spatial differences in the pooled data.
In order to examine the links between all the vari -ables measured, a principal component analysis (PCA) was used. Linear regressions and Pearson’s correlations were calculated to assess variables distributions along the salinity gradient and under different rivers discharge conditions.
RESULTS
Climatology and river discharge
The average air temperature ranged between 23.71°C and 27.91°C. The mean wind speed for the area was 1.82 m s-1, varying between 0.6 and 2.86 m s-1. These values are close to the average wind speed for 1990-2010 of 2.2 m s-1. During the period from 2010 to 2011, the rainfall was above the expected values for some months of the rainy season (April to July), relative to the climatological aver-age registered for 1990 to 2010 (Fig. 2 B, D). There was no significant difference in annual precipitation (t-test, p=0.3149), only in the monthly distribution of the rainfall as shown by the t test (t-test, p=0.017). The river discharge values for the Capibaribe (37.7 m3 s-1) and Pirapama (20.7 m3 s-1) found during this study were higher than the av-erages calculated from data provided by the Brazilian National Water Agency (Fig. 2 A, C).
The mixing flow (Vx) in the Capibaribe estuary was always below the residual flow (Vr), while the opposite dynamic was observed at the Barra de Jangadas estuary (Table 1). This latter act as an importer of salt, particulate and dissolved material while the Capibaribe estuary act as an exporter to the coastal zone. The residence time during the extreme rainfall event decreased ≈3.5 times and ≈10 times in the Capibaribe and Barra de Jangadas estuaries respectively.
Dissolved oxygen
Seasonally, the maximum dissolved oxygen values registered in the Capibaribe estuary were found during the rainy season (Kruskal-Wallis, p<0.0001 between seasons). During the dry season, in November 2010 and September 2011, the oxygen values found in this estuary increased during phytoplanktonic blooms. No seasonal variability was identified for this parameter in the Barra de Jangadas estuary with low values throughout the study (Figure 3).
The highest dissolved oxygen saturations (%DO) were found in the estuarine plumes, with annual mean values ± sd of 98±10% and 86±14% for Barra de Jangadas and Capibaribe, respectively. A seasonal difference was identi -fied only in the BJ plume, where the mean %DO decreased from 104% during the dry season to 88% (Kruskal-Wallis, p=0.0024) during the rainy season (Table 2).
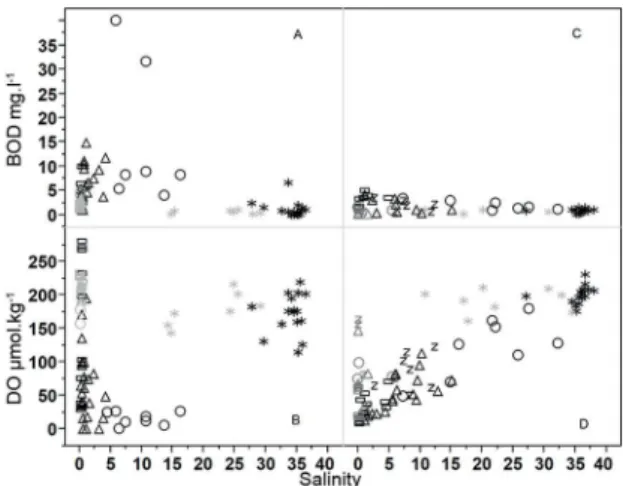
The most extreme variability of the %DO was found in the Capibaribe estuary. The spatial distribution pattern of the %DO tended to decrease toward the lower estuary, with an annual mean value ± standard deviation (sd) of 74±33% in the upper estuary and 29±34% in the lower es -tuary, where anoxic conditions were not rare. In Barra de Jangadas, the maximum %DO annual average was found at the low estuary 50±20%, decreasing towards the upper estuary (14.8±8.7%), and resulting in an average overall oxygen saturation below 30% throughout the study period. The Capibaribe estuary showed an annual average BOD5,20 of 5.6 mg l-1, three times higher than the mean found for the BJ estuary (1.82 mg l-1). There was no clear variability linked to seasonal cycles. Spatially, most of the high values were found within the estuaries (Table 2) but these values showed no correlation with salinity (Figure 3).
DIN, TP, Silicate and Chl
-a
Figure 2. River discharge (gray) and mean discharge (black) from
1986 to 2009 in the Capibaribe (A) and from 1990 to 2009 in Barra de Jangadas (C). Monthly precipitation in the cities of Recife (B) and Jaboatão (D),monthly precipitation (gray), Thornthwaite’s potential evapotranspiration (dark gray), average precipitation from 1990 to 2010 (black). There was no difference in annual rainfall (t-testp
>0.05) only in the monthly precipitation distribution (t-testp=0.017).
Capibaribe Barra de Jangadas
dry wet dry wet
Vq (103 m3 d-1) 778 9374 280 6350
Vp (103 m3 d-1) 10 151 5 103
Ve (103 m3 d-1) 17 34 12 23
Vr (103 m3 d-1) -771 -9491 -273 -6430
Soc 34 22 35.5 23
Ssys 2.5 0.3 8.4 1
Sr 22.5 11.15 25.25 12 Vx (103 m3 d-1) 754 4877 336 3507
t (days) 25 7 43 4
Tabela 1. Seasonal water and salt flux average budgets for each estuary. Vq river discharge; Vp precipitation; Ve evaporation; Vr residual flow; Soc ocean salinity; Ssys river salinity; Sr residual salinity; Vx mixing flux; t residence time do bod x sal
Figure 3. Overall distribution of the BOD and OD for the Capibaribe
(A, B) and Barra de Jangadas (C,D) ( black=dry season; gray = rainy season).*estuarine plume; circles - lower estuary; triangles - middle estuary; rectangles -upper estuary; z Pirapama.
plumes. The Capibaribe estuary and its plume showed the highest average concentrations of all nutrients. In this es -tuary, dissolved inorganic nitrogen (DIN) was negatively correlated with salinity, decreasing seaward (r2=0.69). No correlation between these parameters was identified in the Barra de Jangadas estuary (Figure 4). The mean values of DIN showed a significant difference between rainy and dry seasons only within the Capibaribe estuary (p<0.0001). The annual overall average DIN concentra -tions were 22.5±7.34 µmol kg-1 for the Capibaribe and 12.9±7.65 µmol kg-1 for the Barra de Jangadas estuary.
The estuarine plumes showed a clear correlation be-tween DIN and rainfall r2=0.60 and 0.78 for the Capibaribe and Barra de Jangadas plumes, respectively. Through a seasonal comparison of DIN, we found p values of 0.0011 and 0.0006 for the BJ and Capibaribe plumes respective -ly. The increased riverine influence caused by the fluvial flooding during the extremely rainy season augmented the DIN concentrations in the plumes (Table 3), as was also seen by the salinity decrease.
The total dissolved phosphorus (TDP) maximum values were found during the dry season in both estuar-ies (p=0.0191) for Barra de Jangadas and (p<0.0001) for the Capibaribe estuary. The mean overall TDP con -centrations found within the BJ and Capibaribe estuar-ies were 3.53±2.11 µmol kg-1 and 7.18±4.51 µmol kg-1, respectively.
ESTUARY
Capibaribe BJ
dry wet dry wet
%DO
Mean 32.5 83.1 29.9 28.1
Min - max 0 - 116 63 - 94 3.4 - 85 6.2 - 65
n 42 24 40 19
BOD mg l-1
Mean 7.87 2.61 2.22 0.84
Min - max 0.7 - 39.9 0.92 - 4.55 0.42 - 5.03 0.09 - 1.5
n 33 25 28 11
DIN µmol kg-1
Mean 20.0 26.6 12.7 13.4
Min - max 3.8 - 37.7 15.3 - 39.3 3.3 - 39.8 8.3 - 17.5
n 42 24 40 19
TDP µmol kg-1
Mean 8.8 4.4 4.7 2.3
Min - max 1.5 - 22 2.9 - 8.6 0.67 - 30.7 1.29 - 3.22
n 42 24 40 19
Si(OH)4 µmol kg-1
Mean 108.9 131.1 89.0 102.6
Min - max 10.5 - 207.3 38.5 - 209.5 10.17 - 194.3 38.73 - 195.5
n 42 24 40 19
chl-a mg m3
Mean 40.23 6.31 5.72 4.81
Min - max 10 - 85 3.81 - 10.48 0.6 - 34.7 1.03 - 8.02
n 14 8 16 5
TA µmol kg-1
Mean 1808 1373 1616 1058
Min - max 1307 - 2421 973 - 1859 746 - 2090 622 - 1388
n 42 24 40 19
pH
Mean 7.34 7.43 7.21 6.67
Min - max 7.01 - 8.09 7.2 - 7.62 6.78 - 7.98 6.39 - 6.91
n 42 24 40 19
Tabela 2. Seasonal mean, minimum and maximum values of the parameters measured in the Capibaribe and Barra de Jangadas estuaries
influenced by the recurrent algal blooms, and resulted in a negative correlation between rainfall and chl-a r2=0.50 with a significant seasonal difference (p=0.0002). During the campaigns, it was possible to identify an algal bloom event in November 2010 in both estuaries, when the chl-a values reached the maximum values of 85.11 mg m-3 in the Capibaribe, and 34.71 mg m-3 in the BJ estuary. A second bloom event was registered in September 2011, though less intense and only in the Capibaribe estuary, where the chl-a values ranged from a minimum of 22.94 mg m-3 to a maximum of 50.34 mg m-3. In the estuarine plumes (Figures 5 C, D) the chlorophyll a was lower than in the estuaries throughout the year and showed only a significant seasonal variation in the Capibaribe plume due to the algal blooms (p=0.0011).
Total Alkalinity, TCO
2, pH
The spatial variability of total alkalinity (TA) and pH are shown in Figure 6. Within the estuaries the alkalinity increases towards the lower estuary as a result of greater seawater influence. A positive correlation between TA and salinity was weak in the Capibaribe estuary r2=0.42, but the correlation between these parameters was more evi-dent in the BJ estuary r2=0.62 (Figure 6 A, C).
Tabela 3. Seasonal mean, minimum and maximum values of the parameters measured in the Capibaribe and Barra de Jangadas estuarine plumes
PLUME
Capibaribe BJ
dry wet dry wet
%DO
Mean 88.5 83.0 104.1 88.8
Min - max 60 - 114 63- 101 91 - 119 72 - 101
n 16 8 15 8
BOD mg l-1
Mean 1.17 0.58 0.89 0.66
Min - max 0.01 - 6.6 0.12 - 1.15 0.14 - 1.5 0.12 - 1
n 16 7 15 4
DIN µmol kg-1
Mean 3.7 14.8 1.5 4.6
Min - max ND - 12 8.3 - 21.6 ND - 9.59 2.1 - 7.61
n 16 8 15 8
TP µmol kg-1
Mean 2.4 3.5 1.9 1.8
Min - max ND - 9.75 2.22 - 5.09 0.5 - 5.1 0.8 - 2.9
n 16 8 15 8
Si(OH)4 µmol kg-1
Mean 11.1 64.4 9.7 48.1
Min - max 1 - 41.5 42.7 - 113.6 0.8 - 61.8 6.3 - 107
n 16 8 15 8
chl-a mg m3
Mean 4.99 2.35 3.24 1.54
Min - max 0.24 - 19.29 1.15 - 3.93 0.21 - 9.67 0.8 - 2.49
n 16 8 16 8
TA µmol kg-1
Mean 2266 2067 2262 1904
Min - max 2094 - 2499 1721 - 2433 2038 - 2383 1250 - 2266
n 16 8 15 8
pH
Mean 8.13 7.83 8.17 8.01
Min - max 7.97 - 8.32 7.31 - 8.17 7.96 - 8.28 7.76 - 8.21
n 16 8 15 8
Figure 4. Overall distribution of the dissolved nutrients along the salinity gradient in the estuaries of the Capibaribe (A,B,C) and Barra
de Jangadas (D,E,F), (black = dry season; gray = rainy season). *river plume; circle - lower estuary; triangle - middle estuary; rectangle - upper estuary; z - Pirapama.
1430±375 µmol kg-1 and ranged from 1138±288 µmol kg-1 in the upper estuary to 1668±361 µmol kg-1 in the lower estuary.
The lowest average alkalinities were recorded during the rainy season in both estuaries (Table 2), with means± sd for this season of 1078±244 and 1372±375 µmol kg-1 in the BJ and Capibaribe estuaries, respectively. There was no significant difference in TA between river plumes, with an annual average of 2142±308 µmol kg-1 in the BJ and 2196±198 µmol kg-1 in the Capibaribe.
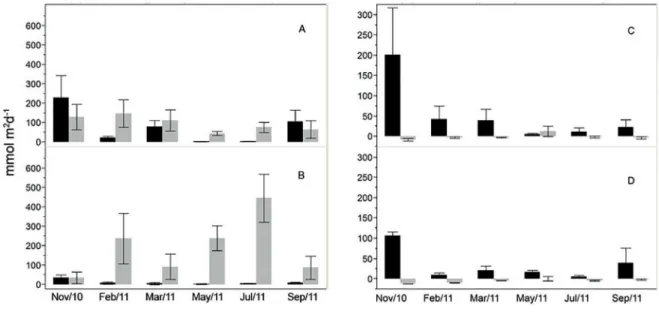
Figure 5. Monthly variability of the CO2 fluxes (gray) and primary productivity (black) within the estuaries of the Capibaribe (A) and Barra de
Jangadas (B), and in the river plumes (C), (D). Error bars represents standard deviation.
Figure 6. Overall distribution along a salinity gradient of total
alkalinity (TA) and pH in the estuaries of the Capibaribe (A,B) and Barra de Jangadas (C,D) (black=dry season; gray=rainy season).*river plume; circle - lower estuary; triangle - middle estuary; rectangle - upper estuary; z Pirapama).
Figure 7. Principal component analysis obtained from the observed data in the Capibaribe (open markers) and Barra de Jangadas (solid
markers). The numbers in F1 and F2 axis labels are the explained variance in each factor. (black=dry season; gray=rainy season).*river plume Capibaribe; Y river plume BJ; circle - lower estuary; triangle - middle estuary; rectangle - upper estuary; z Pirapama).
The pH values also varied seasonally in both river plumes, with the lowest values recorded during the rainy season for the Capibaribe (p=0.0372) and Barra de Jangadas (p=0.0301) (Table 3).
The PCA was used here to determine the influence of the pluviometry on the chemical parameters measured over time and space scales. There is a clear difference between dry and rainy period (Figure 7) where was found more el -evated values of DIN, silicate in the estuaries and in the river plumes. The phytolpanktonic blooms events which
occurred during the dry period were linked to the elevated TDP and BOD5,20 values, thus the %DO increased in the rainy season in response to the decrease in the organic load in the estuaries (Figure 7).
Figure 8. Monthly variability of the mean inorganic carbon species to TCO2 within the estuaries of the Capibaribe (A), Barra de Jangadas
(C), and in the river plumes of the (B) Capibaribe, and (D) Barra de Jangadas. (dark gray - [HCO3-], Black - [CO3
2-], light gray - [CO 2]).
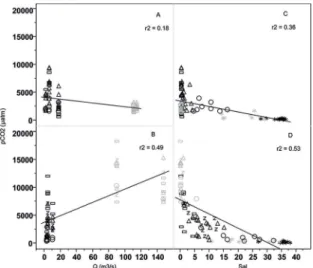
Figure 9. Correlation between river discharge (Q) and pCO2 within
the Capibaribe (A); and Barra de Jangadas (B) estuaries. Overall
distribution of pCO2 in the Capibaribe (C), and Barra de Jangadas
(D), along a salinity gradient (black = dry season; gray = rainy season). *river plume; circle - lower estuary; triangle - middle estuary; rectangle - upper estuary; z Pirapama).
decrease in the salinity of the river plumes and decreased the differences among river plume and lower estuary, es -pecially in the Capibaribe (Figure 7).
The TCO2 was also higher in the Capibaribe than in BJ (p=0.0027), with annual averages of 1764±407 µmol kg-1 and 1638±306 µmol kg-1, respectively. Variations in TCO2 values accompanied the variation in alkalinity and were lower during the rainy season in both estuaries. The maximum relative HCO3
- contribu-tions to TCO2 were registered in the Capibaribe estu-ary with a mean±sd of 91±3.68% of the TCO2 com-posed by HCO3
- (Figure 8).
Although the TCO2 did not show any seasonal varia-tion in the river plumes, the relative contribuvaria-tion of inor-ganic carbon species varied, with a decrease in the per-centage of CO32- ions and a relative increase of HCO
3 - ions and CO2(aq) (Figure 8), accompanied by a pH decrease dur -ing the high discharge months of April and May 2011.
Water pCO
2and CO
2fluxes
The estuaries showed a different seasonal pattern in the partial pressure of CO2 (pCO2) and CO2 fluxes (FCO2), for each estuary. The pCO2 and the FCO2 were higher dur-ing the rainy season in the Barra de Jangadas estuary and during the dry season in the Capibaribe estuary (Figures 5 and 8).
In the estuarine plumes, values of TA, pH and salinity were lower during the rainy season, increasing the pCO2, with mean values ± sd of 667±537 µatm in the Capibaribe
and 332±189 µatm in the BJ (Figure 8 B). During the dry season the mean pCO2 values found were 237±86 µatm and 166±112 µatm for the estuarine plumes of the Capibaribe (p=0.0110) and Barra de Jangadas (p=0.0131), respectively.
The maximum pCO2 values were registered in the up-per estuary, with low salinity, pH and alkalinity, mainly in the Barra de Jangadas estuary and decreased seawards r2=0.53 (Figure 9 D). A significant correlation was not found in the Capibaribe estuary r2=0.36 (Figure 9 B). The annual overall mean pCO2 in the Capibaribe estuary was 3317±2034 μatm, ranging from 3142±2282 μatm in the upper estuary to 2316±710 μatm in the lower estuary. In Barra de Jangadas the annual overall pCO2 mean was 6018±4589 μatm, with average values ± sd ranging from 7852±4308 μatm in the upper estuary to 3533±4615 μatm in the lower estuary, where CO2 subsaturation states were frequent during the dry season.
considerable influence of the freshwater input, when the maximum values ranged from 180 mmolC m-2 d-1 in the lower estuary to 653 mmolC m-2 d-1, in the upper estuary. During the dry season, the average FCO2 (117 mmolC m2 d-1) was close to that found for the Capibaribe (106 mmolC m-2 d-1).
DISCUSSION
The elevated organic load has driven the nutrient avail-ability in the studied areas especially in the Capibaribe es-tuary where recurrent phytolanktonic blooms were regis-tered during the dry period, which was correlated with the elevated concentrations of phosphorus and DBO5,20 also influenced by the high residence time of 25 days in the Capibaribe. The rivers flooding increased the TDP, DIN and silicate concentrations and reduce the residence time in the estuaries to values below the previously reported for these estuarine systems in the wet season. Noriega et al. (2013) calculated an average residence time varying from 9-15 days for the Capibaribe estuary and Noriega and Araujo (2011) calculated a residence time of 8-16 days for the BJ estuary. The extreme precipitation event decreased these residence times to ≈7 and ≈4 days for the Capibaribe and BJ estuaries respectively, thus increasing the transport to the coastal area and such a process brings more organic matter to be mineralized over the continental shelf (Martins et al., 2016).
Different studies discussed about sources of organic matter and dissolved inorganic nutrients to the coast in the Pernambuco state (Noriega and Araujo, 2009; Paulo et al., 2011; Travassos et al., 2016) and trophic state (Flores Montes et al., 2011; Guenther et al., 2015), and they indi -cated the wastewaters the major source in this interface land-water. Noriega and Araujo (2009) estimated a phos -phorus input to the ocean of 37,048 t P y-1, where anthro-pogenic sources accounted for 99.7% of the emissions.
The link between nutrient dynamics and the ecosys-tem response under different hydrological regimes on various spatio-temporal scales is still a challenge for the scientific community (Chen and Hong, 2012; Nixon et al., 2015). There are some opposing views, with reports of nu -trient enrichment exacerbating the larger scale decline in oceanic pH (Cai et al., 2011; Duarte et al., 2013). While other authors reported that the increase in the primary productivity due to eutrophication may counter the effects of ocean acidification due to the increased productivity leading to CO2 absorption. (Borges and Gypens, 2010; Guenther et al., 2015).
Despite the increased nutrient concentrations in the river plumes during the wet season, the Chl-a and pro-ductivity values were higher during the dry season, be-cause of the algal blooms which. Such seasonal variation was also previously reported by Koening et al. (1995) and Feitosa et al. (1999). Those authors related the decrease in productivity to the increased turbidity in the study ar-ea. According to Resurreição et al. (1996), who studied productivity during a seasonal cycle on a transect of the continental shelf in front of the Capibaribe, there is no sig-nificant seasonal variation in the chl-a concentration at a distance of approximately 4 nautical miles (nm) from the coast.
During the extreme rainfall events of April and May 2011, it was registered the lowest concentrations of CO3 2-with a relative increase in the CO2 at the same months Such a variability in the inorganic carbon species must be influenced by the decrease in the primary productivity in the study area during the extreme rainfall months, due the reduced uptake of CO2 by the phytoplanktonic com-munities. Several metabolic and diagenetic processes are responsible for the TCO2 and total alkalinity consumption/ production in estuaries. Different authors related that the photosynthesis consumes, and both aerobic and anaerobic organic matter oxidation produce CO2. These processes decrease/increase the TCO2 in seawater, but not the total alkalinity since there is an adjustment of carbonate species and pH according to the equilibrium conditions (Zeebe and Wolf-Gladrow, 2001; Wolf-Gladrow et al., 2007). Sulfate reduction and methane production release HCO3
-, but also CO2 and lowers pH, and the final result depends on the total sediment chemistry (Van der Weijden, 1992). Additionally, the anaerobic oxidation of organic matter, which favors HCO3
- production and increases alkalin-ity is an important aspect in the alkalinalkalin-ity regulation in polluted estuaries (Frankignoulle et al., 1996; Abril and Frankignoulle, 2001; Abril; Borges, 2004; Thomas et al., 2009).
During the study period, it was found a residual organ -ic load of 18.24 t BOD5, 20 d-1 in the Capibaribe, calculated through the integration of the average annual river’s dis-charge (37.7 m3 s-1) and annual mean BOD
5, 20 (5.6 mg.l-1) (Qmean x BOD5,20mean). The BJ received a residual organic load of 3.25 t BOD5, 20 d-1. It is 5.6 times less residual or -ganic load than the found in the Capibaribe estuary and may explain the difference in alkalinity found between these estuaries. Since the Capibaribe estuary has a residual volume more elevated than the exchange volume and the BJ estuary has the opposite dynamic, this latter is more susceptible to a CO2 enrichment and consequently pH de -crease, since the organic matter keeps retained inside the estuary where is mineralized.
The prevalence of anaerobic reactions in anoxic es -tuarine waters and sediments is a drawback to carbonate system calculations using pH and total alkalinity since the real amount of carbonate alkalinity is unknown. The con -tribution of the organic alkalinity to the TA may be rel-evant, thus leading to an underestimation of the calculated pCO2 values using pH and TA (Ko et al.,2016). Such un -derestimation in the pCO2 may vary around 30% to 50% (Kuliński et al., 2014). From the low oxygen saturation found in the Barra de Jangadas estuary, <30% through -out the year, and in the Capibaribe estuary during the dry season, as well as the high DBO5,20 values and total phos-phorus it is possible to assume that the alkalinity from dissolved organic matter probably influence the alkalinity regulation in these estuaries as has recently been discussed by Kullinsky et al. (2014), Abril et al. (2014) and Ko et al., (2016). So further studies are necessary to understand which processes control the alkalinity and the inorganic and organic carbon variability in the Capibaribe and BJ estuaries, including possible submarine groundwater dis-charge and organic alkalinity contributions.
However, the elevated values found in the present study, with an average pCO2 in the BJ estuary of 6081 μatm is within the range of 400 to 10000 μatm proposed by Chen et al. (2012) in a review of several studies in es -tuarine environments. Recently, Noriega et al. (2015) has reported values of pCO2 in 12 estuaries of northeastern Brazil ranging from 987 to 8970 μatm. Lower pCO2 val-ues have been reported by Cotovicz et al. (2016) for the Guanabara Bay (418±431 µatm) - an eutrophic ecosys -tem where the primary productivity significantly lowers the pCO2 - and in the São Francisco estuary (1469±2948 µatm) which is oligotrophic and dominated by heterotro -phy and thus presents higher pCO2 values.
The rivers’ discharge is usually correlated with pCO2 when there is a significant contribution to the estuary from the upper river (Jiang et al., 2008). The absence of correla -tion between these parameters in the Capibaribe and BJ estuaries (Figure 8A, B), may be related to the land use in the watershed. The Capibaribe estuary, which is located entirely within an urban area, showed a decrease in pCO2 during the rainy season, in accordance with previous stud-ies of Noriega et al. (2013). This kind of decrease has also been reported by Abril et al. (2000) in the Scheldt estu -ary. In such environments, the processes of organic matter mineralization and the microbial respiration rates are the main drivers of CO2 variability inside the estuary (Zhai et al., 2005; Borges and Guenther et al., 2015).
The variability of CO2 (aq) and pH in rivers and estuar -ies are influenced by the soil CO2 runoff from wetlands and mangrove areas, which have a potential effect on the process of pCO2 increase in water bodies, as reported by Abril and Borges (2005), Cai et al. (2011), Sarma et al. (2012) and Abril et al. (2014). The BJ estuary appears to be more susceptible to this type of input because its banks still have dense man-grove areas and extensive wetlands which are exposed during the low tide period. The weak correlation with river discharge (r2=0.49) suggests that it has also been influenced by the high alkalinity freshwater input and the predominance of estuarine biological processes (production/remineralization of organic matter), as compared with advective fluxes. Once estuaries are predominantly heterotrophic ecosystems with high pCO2 val-ues in the freshwater endmember, decreasing seaward (Chen et al., 2012; 2013) similar to the pattern found in the present study.
The river plumes of the BJ and Capibaribe estuaries, except during the extreme rainy months, acted like auto -trophic areas, although their low productivity they were predominantly in a state of CO2 undersaturation (Figure 5 C, D). During the rainy season in the Capibaribe river plume, especially in May, a CO2 supersaturation was ob-served, which has driven the mean flux value of - 4.01 mmolC m-2 d-1 during the dry season, to a positive mean of + 5.7 mmolC m-2 d-1 during the rainy season, driven by the influence of the CO2 rich freshwater.
The FCO2 average values found in the present study are comparable to those recently reported for 28 estuar-ies of the northern and northeastern regions of Brazil by Noriega et al. (2014). They proposed a mean value of 20±16 molC m-2 y-1during a normal rainfall season. The FCO2 averages found in the present study are also compa-rable to those values proposed by Borges (2005), for pol -luted environments at mid and high latitudes (46 molC m-2 y-1) and the average flux of 62 molC m-2 y-1 proposed by Frankignoulle et al. (1998) and 68 molC m-2 y-1 by Chen et al. (2012) for the inner portion of estuaries.
CONCLUSION
The low correlations of pCO2 with river discharges, which we found in both estuaries, is due to the high al-kalinity freshwater input and the predominance of bio-geochemical processes of production/remineralization of organic matter, from natural and anthropogenic sources. The high residence time of both estuaries and especially in Barra de Jangadas estuary leads to a CO2 enrichment of its waters and consequently a pH decrease despite the reduced organic load when compared to the Capibaribe estuary. Such intense organic load is also increasing the nutrients concentrations and lowering the %DO in the study area and also promoting phytoplanktonic blooms during the dry season when the conditions of transparency and high residence time of the waters are favorable to its development. The extreme precipitation event in the Barra de Jangadas estuary led to an increase of nearly 300% in the average pCO2 values during the months of extreme rainfall. The high TA values found in the freshwater of both estuaries may have a major component of organic al -kalinity as seen by the high residual organic loads which these environments are subjected. The final alkalinity bal -ance in these estuaries may constitute an additional buf-fer to estuarine proton inputs from organic matter respi-ration. However, further studies are needed to investigate the causes of the alkalinity variability in the area such as submarine groundwater discharges and organic alkalin-ity contribution. The CO2 fluxes found for both estuaries are considered high and are comparable to the proposed averages for polluted estuaries in high and intermediate latitudes, illustrating the effects of anthropogenic pressure on rivers and estuaries in densely populated tropical areas.
ACKNOWLEDGMENTS
We thank the National Counsel of Technological and
CT-Infra nº. 38/2009), the Foundation for Science and Technology Support of Pernambuco (FACEPE/FAPESP- APQ-0074-1.08/11) for their financial support for this project and the Research Support Foundation of the State of São Paulo (FAPESP/FACEPE/ANR 2011/50582-0) for the coopera -tion activities developed in scope of the thematic project. We also thank the Coordination for the Improvement of Higher Education Personnel (CAPES) for scholarship support.
REFERENCES
ABRIL, G., ETCHEBER, H., BORGES, A. V. & FRANKIG
-NOULLE, M. 2000. Excess atmospheric carbon dioxide transported by rivers into the Scheldt estuary. Sciences - Se-ries IIA - Earth and Planetary Science, 330, 761-768.
ABRIL, G. & FRANKIGNOULLE, M. 2001. Nitrogen–alkalin
-ity interactions in the highly polluted scheldt basin (belgium).
Water Research, 35, 844-850.
ABRIL, G. & BORGES, A. 2005. Carbon dioxide and methane emissions from estuaries. In: TREMBLAY, A., VARFALVY, l., ROEHM, C. & GAMEAU, M. (eds) Greenhouse gas
emis-sions-fluxes and processes, hydroelectric reservoirs and Natu
-ral Environments. Berlim Heildelberg New York: Springer. ABRIL, G., MARTINEZ, J., ARTIGAS, L. F.,
MOREIRA-TURCQ, P., BENEDETTI, M. F., VIDAL, L., MEZIANE, T., KIM, J., BERNARDES, M. C., SAVOYE, N., DEBORDE, J., SOUZA, E. L., ALBÉRIC, P., SOUZA, M. F. L &. RO
-LAND, F. 2014. Amazon River carbon dioxide outgassing fuelled by wetlands. Nature, 505, 395-398.
APHA - AMERICAN PUBLIC HEALTH ASSOCIATION. 1995.
Standard methods for the examination of water and wastewa-ter, Washington, APHA.
ARAUJO, M., MEDEIROS, C. & RIBEIRO, C 1999. Energy balance and time-scales of mixing and stratification in the Jaboatão estuary, NE-Brazil. Revista Brasileira de
Oceano-grafia, 47, 145-154.
ARAUJO, M., NORIEGA, C., VELEDA, D. & LEFÈVRE, N. 2013. Nutrient input and CO2 flux of a tropical coastal fluvial system
with high population density in the Northeast region of Brazil.
Journal of Water Resource and Protection, 5, 362-375.
BORGES, V., DELILLE, B., SCHIETTECATTE, L., GAZEAU, F., GAZEAU, F., ABRIL, G. & FRANKIGNOULLE, M. 2004. Gas transfer velocities of CO2 in three European estu
-aries (Randers Fjord, Scheldt, and Thames). Limnology and Oceanography, 49, 1630-1641.
BORGES, A.V., DELILLE, B. & FRANKIGNOULLE, M. 2005.
Budgeting sinks and sources of CO2 in the coastal ocean: Diver
-sity of ecosystems counts. Geophysical Research Letters, 32.
BORGES, A. V. 2005. Do we have enough pieces of the jigsaw to integrate CO2 fluxes in the coastal ocean? Estuaries, 28,
3-27.
BORGES, A. V. & GYPENS, N. 2010. Carbonate chemistry in the coastal zone responds more strongly to eutrophication than to ocean acidification. Limnology Oceanography, 55,
346-353.
BORGES, A.V. 2011. Present day carbon dioxide fluxes in the coastal ocean and possible feedbacks under global change.
CAI, W. & WANG, Y. 1998. The chemistry, fluxes, and sources of carbon dioxide in the estuarine waters of the Satilla and Altamaha Rivers, Georgia. Limnology and Oceanography,
43, 657-668.
CAI, W. 2011. Estuarine and coastal ocean carbon paradox: CO2
sinks or sites of terrestrial carbon incineration? Annual Re-view of Marine Science, 3, 123-145.
CAI, W., HU, X., HUANG, W., MURRELL, M. C., LEH
-RTER, J. C., LOHRENZ, S. E., CHOU, W., ZHAI, W., HOLLIBAUGH, J. T., WANG, Y., ZHAO, P., GUO, X., GUNDERSEN, K., DAI, M. & GONG, G. 2011. Acidifica
-tion of subsurface coastal waters enhanced by eutrophica-tion. Nature Geoscience, 4, 766-770.
CHEN, C. T. A. 2004. Exchanges of carbon in the coastal seas. In: Field C. B. & RAUPACH M. R. (eds)The global car-bon cycle: Integrating human, climate and the natural world. Washungton: Island Press.
CHEN, C. T. A., HUANG, T. H., FU, Y., HE, X. & BAI, Y. 2012. Strong sources of CO2 in upper estuaries become sinks of CO2
in large river plumes. Current Opinion in Environmental Sus-tainability, 4, 179-185.
CHEN, C. T. A., HUANG, T. H., CHEN, Y. C., HE, X. & KANG, Y. 2013. Air–sea exchanges of CO2 in the world’s coastal
seas. Biogeosciences, 10, 6509-6544.
CHEN, N. & HONG, H. 2012. Integrated management of nutri
-ents from the watershed to coast in the subtropical region.
Current Opinion in Environmental Sustainability, 4, 233-242.
COLE, B. E. & CLOERN, J. E. 1987. An empirical model for estimating phytoplankton productivity in estuaries. Marine Ecology Progress Series, 36, 299-305.
COLIJN, F. 1982. Light absorption in the waters of the Ems-Dollard estuary and its consequences for the growth of phyto
-plankton and microphytobenthos. Netherlands Journal of Sea Research, 15, 196-216.
COTOVICZ JR, L. C., LIBARDONI, B. G., BRANDINI, N., KNOPPERS, B, A. & ABRIL, G. 2016. Comparações entre
medições em tempo real da pco2 aquática com estimativas indiretas em dois estuários tropicais contrastantes: o estuário
eutrofizado da baía de guanabara (RJ) e o estuário oligotrófi
-co do Rio São Francis-co (al). Química Nova, 39, 1206-1214.
CPRH (Agencia estadual de meio ambiente e recursos hídricos). 2006. Relatório de monitoramento de bacias hidrográficas
do estado de Pernambuco 2011, Recife. [cited 2013 Oct 15]. Available from: http://www.cprh.pe.gov.br
DUARTE, C. M., HENDRIKS, I. E., MOORE, T. S., OLSEN, Y. S., STECKBAUER, A., RAMAJO, L., CARSTENSEN, J., TROTTER, J. A. & MCCULLOCH, M. 2013. Is ocean acidification an open-ocean syndrome? Understanding an
-thropogenic impacts on seawater pH. Estuaries and Coasts,
36, 221-236.
DICKSON, A. G. 1990a. Standard potential of the reaction: AgCl (s)+ 12H2 (g)= Ag (s)+ HCl (aq), and and the standard acidity constant of the ion HSO4− in synthetic sea water from 273.15
to 318.15 K. The Journal of Chemical Thermodynamics, 22,
113-127.
DICKSON, A. G. 1990b. Thermodynamics of the dissociation of boric acid in synthetic seawater from 273.15 to 318.15 K.
Deep Sea Research Part A. Oceanographic Research Papers,
37, 755-766.
FEITOSA, F. A. N.; NASCIMENTO, F. C. R; COSTA, K. M. P. Distribuição espacial e temporal da biomassa fitoplanctônica relacionada com parâmetros hidrológicos na Bacia do Pina (Recife-PE). Trabalhos Oceanográficos da Universidade
Federal de Pernambuco, v. 27, n. 2, p. 1-13, 1999.
FRANKIGNOULLE, M., BOURGE, I. & WOLLAST, R. 1996.
Atmospheric CO2 fluxes in a highly polluted estuary (the
Scheldt). Limnology and Oceanography, 41, 365-369.
FRANKIGNOULLE, M., ABRIL, G., BORGES, A., BOURGE, I., CANON, C., LIBERT, E. & THÉATE, J. M. 1998. Car
-bon dioxide emission from European estuaries. Science, 282, 434-436.
FLORES MONTES, M. DE J., PAULO, J. G., NASCIMENTO-FILHO, G. A., GASPAR, F. L., FEITOSA, F. A., SANTOS-JÚNIOR, A. C., BATISTA, T. N. F., TRAVASSOS, R. K. & PITANGA, M. E. 2011. The trophic status of an urban es
-tuarine complex in Northeast Brazil. Journal of Coastal Re-search, 64, 408-411.
GARCIA, H. E. & GORDON, L. I. 1992. Oxygen solubility in seawater: Better fitting equations. Limnology and Oceanog-raphy, 37, 1307-1312.
GORDON, D. C.; BOUDREAU, P. R.; MANN, K. H.; ONG, J.-E., SILVERT, W. L.; SMITH, S. V.; WATTAYAKORN, G.; WULLF, F. & YANAGI, T. 1996. LOICZ biogeochemical modelling guidelines, Yerseke, Netherlands Institute for Sea Research.
GRASSHOFF, K., EHRHARDT, M. & KREMLING, K. 1983.
Methods of Seawater Analysis, Weinheim, Wiley-Verlag. GUENTHER, M., ARAÚJO, M., FLORES-MONTES, M.,
GONZALEZ-RODRIGUEZ, E. & NEUMANN-LEITÃO, S. 2015. Eutrophication effects on phytoplankton size-frac
-tioned biomass and production at a tropical estuary. Marine pollution bulletin, 91, 537-547.
HOWARD J., BABIJ, E., GRIFFIS, R., HELMUTH, B., HIMES-CORNELL, A., NIEMIER, P., ORBACH, M., PETES, L., ALLEN, S., AUAD, G., AUER, C., BEARD, R., BOAT
-MAN, M., BOND, N., BOYER, T., BROWN, D., CLAY, P., CRANE, K., CROSS, S., DALTON, M., DIAMOND, J., DIAZ, R., DORTCH, Q., DUFFY, E., FAUQUIER, D., FISHER, W., GRAHAM, M., HALPERN, B., HANSEN, L., HAYUM, B., HERRICK, S., HOLLOWED, A., HUTCHINS, D., JEWETT, E., JIN, D., KNOWLTON, N., KOTOWICZ, D., KRISTIANSEN, T., MORRISON, J. R., MURRAY, J., NORMAN, K., O’DONNELL, J., OVERLAND, J., PAR
-SONS, R., PETTIGREW, N., PFEIFFER, L., PIDGEON, E., PLUMMER, M., POLOVINA, J., QUINTRELL, J., ROW
-LES, T., RUNGE, J., RUST, M., SANFORD, E., SEND, U., SINGER, M., SPEIR, C., STANITSKI, D., THORNBER, C., WILSON, C. & XUE, Y. 2013. Oceans and marine resources in a changing climate. In: HUGHES, R.N., HUGHES, D. J. & SMITH, I. P. (eds) Oceanography and Marine Biology: An Annual Review. Boca Raton: CRC Press. 51, 71-192.
IBGE (Instituto Brasileiro de Geografia Estatística). Censo 2010. [cit
-ed 2013 Oct]. Available from: http://www.censo2010.ibge.gov.br/ JIANG, L. Q., CAI, W. J. & WANG, Y. 2008. A comparative study
of carbon dioxide degassing in river‐and marine‐dominated
estuaries. Limnology and Oceanography, 53, 2603-2615.
KOENING, M. L., MACÊDO, S. J., TRAVASSOS, P. E. P. F. & PASSAVANTE, J. Z. O. 1995. Biomassa fitoplanctônica do estuário do rio Capibaribe (Recife - PE - Brasil). Arquivos de Biologia e Tecnologia, 38, 1071-1083.
KULIŃSKI, K., SCHNEIDER, B., HAMMER, K., MACHULIK, U. & SCHULZ-BULL, D. 2014. The influence of dissolved organic matter on the acid–base system of the Baltic Sea.
Journal of Marine Systems, 132, 106-115.
MARTINS, S. E. M., BARCELLOS, R. L., FLORES-MONTES, M. J. & FRANÇA, E. J. 2016. Depositional evolution in a estuarine lagoonal system under a port influence in Northeast
-ern Brazil. Journal of Coastal Research, 75, 84-88.
MCLUSKY, D. S. 1992. Marine and estuarine gradientes, Marine Pollution Bulletin, 24, 55-56.
MILLERO, F, J., GRAHAM, T. B., HUANG, F., BUSTOS-SER
-RANO, H. & PIERROT, D. 2006. Dissociation constants of
carbonic acid in seawater as a function of salinity and
tem-perature. Marine Chemistry, 100, 80-94.
NIXON, S. W., OCZKOWSKI, A. J., PILSON, M. E. Q., FIELDS, M., OVIATT, C. A. & HUNT, C. W. 2015. On the response of pH to inorganic nutrient enrichment in well-mixed coastal marine waters. Estuaries and Coasts, 38, 232-241.
NORIEGA, C. & ARAUJO, M. 2009. Nitrogen and phosphorus loading in coastal watersheds in northeastern Brazil. Journal of Coastal Research, 56, 871-875.
NORIEGA, C. E. D., ARAUJO, M. 2011. Nutrient budgets (C, N and P) and trophic dynamicsof a Brazilian tropical estuary: Barra das Jangadas. Anais da Academia Brasileira de Ciên-cias, 83, 441-456.
NORIEGA, C. E. D., ARAUJO, M. & LEFÈVRE, N. 2013. Spatial
and temporal variability of the CO2 fluxes in a tropical, highly
urbanized estuary. Estuaries and Coasts, 36, 1054-1072.
NORIEGA, C. E. D., ARAUJO, M., LEFÈVRE, N., FLORES MONTES, M., GASPAR, F. & VELEDA, D. 2015. Spatial
and temporal variability of CO2 fluxes in tropical estuarine
systems near areas of high population density in Brazil. Re-gional Environmental Change, 15, 619-630.
NORIEGA, C. E. D. & ARAUJO, M. 2014. Carbon dioxide emis
-sions from estuaries of northern and northeastern Brazil.
Sci-entific Reports, 4, 6164.
OTSUKA, A. Y., FEITOSA, F. A. N., FLORES-MONTES, M. J. & SILVA, A. 2016. Dynamics of Chlorophyll a and Oceanographic Parameters in the Coastal Zone: Barra das Jangadas-Pernambuco, Brazil. Journal of Coastal Research, 32, 490-499.
PAULO, J. G., FLORES MONTES, M. J., SANTOS JUNIOR, A. C., BATISTA, T. N. F., TRAVASSOS, R. K., NASCIMENTO FILHO, G. A., FEITOSA, F. A., GASPAR, F. L. & PITAN
-GA, M. E. 2011. Allochthonous and autochthonous organic
matter in an urban tropical estuarine area of northeastern
Bra-zil. Journal of Coastal Research, 64, 1798-1801.
PEEL, M. C., FINLAYSON, B. L. & MCMAHON, T. A. 2007. Updated world map of the Köppen-Geiger climate classifica
-tion. Hydrology and Earth System Sciences, 11, 1633-1644. POOLE, H. H. & ATKINS, W. R. G. 1929. Photo-electric mea
-surements of submarine illumination throughout the year.
Journal of the Marine Biological Association of the United
Kingdom, 16, 297-324.
RAYMOND, P. A. & COLE, J. J. 2001. Gas exchange in rivers and estuaries: Choosing a gas transfer velocity. Estuaries and Coasts, 24, 312-317.
ROBBINS, L. L., HANSEN, M. E., KLEYPAS, J. A. & MEY
-LAN, S. C.2010. CO2calc: A user-friendly seawater carbon calculator for Windows, Mac OS X, and iOS (iPhone), Wash
-ington, US Geological Survey.
RESURREIÇÃO, M. G., PASSAVANTE, J. Z. O. & MACEDO, S. J. 1996. Estudo da Plataforma Continental na área do Re
-cife (Brasil): variação sazonal da biomassa fitoplanctónica.
Trabalhos Oceanográficos da Universidade Federal de Per -nambuco, 39-59.
RADTKE, D. B., WILDE, F. D., DAVIS, J. V., & POPOWSKI, T. J. 2012. Alkalinity and acid neutralizing capacity (version
4.0). National field manual for the collection of water-quality data: US Geological Survey techniques of water-resources
investigations, Reston, US Geological Survey.
SABINE, C. L., FEELY, R. A., FEELY, N., KEY, R. M., LEE, K., BULLISTER, J. L., WANNINKHOF, R., WONG, C. S., WALLACE, D. W. R., TILBROOK, B., MILLERO, F. J., PENG, T. H., KOZYR, A., ONO, T. & RIOS, A. F. 2004. The oceanic sink for anthropogenic CO2. Science, 305, 367-71.
DOI: 10.1126/science.1097403
SARMA, V. V. S. S., VISWANADHAM, R., RAO, G. D., PRASAD, R, V., KUMAR, B. S. K., NAIDU, S. A., KU
-MAR, N. A., RAO, D. B., SRIDEVI, T., KRISHNA, M. S., REDDY, N. P. C., SADHURAM, Y. & MURTY, T. V. R. 2012. Carbon dioxide emissions from Indian monsoonal es
-tuaries. Geophysical Research Letters, 39.
SILVA, L F. 1995. Solos tropicais: aspectos pedológicos, ecológi-cos e de manejo, São Paulo, Terra Brasilis.
SOUZA, M. F. L., GOMES, V. R., FREITAS, ANDRADE, R. C. B. & KNOPPERS, B. 2009. Net ecosystem metabolism and nonconservative fluxes of organic matter in a tropical mangrove estuary, Piauí River (NE of Brazil). Estuaries and Coasts, 32, 111-122.
STRICKLAND, J. D. H & PARSONS, T. R. 1972. A Practical Handbook of Seawater Analysis, Ottawa, Fisheries Research
Board of Canada.
THOMAS, H., SCHIETTECATTE, L. S., SUYKENS, KONÉ, Y. J. M., SHADWICK, E. H., PROWE, A. E. F., BOZEC, Y., BAAR, H. J. W. & BORGES, A. V. 2009. Enhanced ocean
carbon storage from anaerobic alkalinity generation in coastal
sediments. Biogeosciences, 6, 267-274.
TRAVASSOS, P. E. P. F., MACÊDO, S. J. & KOENING, M. L., 1993. Aspectos hidrológicos do estuário do rio Capibaribe (Recife, PE). Trabalhos do Instituto de Oceanografia da Uni -versidade Federal de Pernambuco, 22, 9-38.
TRAVASSOS, R. K., FLORES MONTES, M. J., COSTA, B. V, M. & SILVA JÚNIOR, J, M. 2016. The Influence of Urban Effluents on the Elemental C/N Ratio in a Tropical Coastal Area of Northeastern Brazil. Journal of Coastal Research, 75,
168-172.
TRENBERTH, K. E. 2011. Changes in precipitation with climate change. Climate Research, 47, 123-138.
UNESCO. 1966. Determination of Photosynthetic Pigments in Sea-water, Paris: UNESCO.
UNESCO. 1973. International oceanographic tables. National
Institute of Oceanography of Great Britain, Wormley, and United Nations Educational, Scientific and Cultural Organi
VOLLENWEIDER, R, A., TALLING, J. F. & WESTLAKE, D. F. 1974. A manual on methods for measuring primary production in aquatic environments, Oxford,Blackwell Scientific Pub.
WANG, Z. A. & CAI, W. J. 2004. Carbon dioxide degassing and inorganic carbon export from a marsh‐dominated estuary (the
Duplin River): A marsh CO2 pump. Limnology and
Oceanog-raphy, 49, 341-354.
WEISS, R. F. 1974. Carbon dioxide in water and seawater: the solubility of a non-ideal gas. Marine chemistry, 2, 203-215.
VAN DER WEIJDEN, C. H. 1992. Early Diagenesis and Marine Pore Water.Developments in Sedimentology, 47, 13-134.
WOLF-GLADROW, D. A., ZEEBE, R. E., KLAAS, C., KÖRTZ
-INGER, A. & DICKSON, A. G. 2007. Total alkalinity: The explicit conservative expression and its application to biogeo
-chemical processes. Marine Chemistry, 106, 287-300.
ZAPPA, C. J., RAYMOND, P. A., TERRAY, E. A. & MC
-GILLES, W. R. 2003. Variation in surface turbulence and the
gas transfer velocity over a tidal cycle in a macro-tidal
estu-ary. Estuaries and Coasts, 26, 1401-1415.
ZEEBE, R. E. & WOLF-GLADROW, D. 2001. CO2 in Seawa-ter: Equilibrium, Kinetics, Isotopes, New York, Elsevier.
ZHAI, W., DAI, M., CAI, W. J., WANG, Y. & WANG, Z. 2005. High partial pressure of CO2 and its maintaining mechanism