Nonisothermal Melt Crystallization Kinetics of PHB/babassu Compounds
Salim Abdelnor Arrudaa , Jokderléa Correa de Sousaa, Juliana Cisneiros Limaa, Maria do Bom Conselho Vitorinob, Eduardo Luis Canedob, Yêda Medeiros Bastos de Almeidaa*
Received: March 21, 2018; Revised: July 04, 2018; Accepted: July 23, 2018
PHB has interesting features such as biodegradability, sustainability and durability. However, it has a high cost, in addition to being hard, brittle and thermally unstable during processing. Therefore, it was found convenient to study the crystallization of PHB/20% babassu compounds, with the intention of reducing the cost of the composite, in addition to seeking improvements in thermal properties. In this work, the parameters of melt crystallization were studied for PHB/20% babassu compounds driven at
different cooling rates under a nitrogen flow. Subsequently, crystallization parameters were compared for different cooling rates. A kinetic analysis of data obtained for melt crystallization was performed.
Among the models studied, Pseudo-Avrami showed the best correlation with experimental data, with discrepancy between +6% and -4%. The Mo model presented a discrepancy between +15% and -8%. A
modified Mo model discrepancies are reduced to +3% and -4% within the range of validity of the model.
Keywords: compounds, poly(3-hydroxybutyrate)-PHB, vegetable fiber, nonisothermal melt
crystallization kinetics, differential scanning calorimetry-DSC.
*e-mail: [email protected]
1. Introduction
Due to the large amount of synthetic plastic waste produced
by modern societies, lack of space in landfills, emission of
toxic gases in incineration, and their negative impact on the environment, there is a growing interest in biodegradable polymers to substitute conventional polymeric materials1-5. Polyhydroxyalkanoates (PHA) are a family of biopolyesters that could be synthesized by microorganisms from various substrates as carbon sources. Poly(3-hydroxybutyrate) (PHB) is a well-known polymer of this family6-7.
PHB is a semicrystalline thermoplastic, biocompatible and biodegradable, naturally produced by bacteria from renewable sources (sugar or starch)8-11. PHB has interesting mechanical and barrier properties, similar to those of polypropylene, and can be processed in conventional industrial
equipment12-13. However, PHB is thermally unstable at processing temperatures and combines a high crystallinity with a low crystallization rate, characteristics which limit its applications12-14. Copolymerization of 3-hydroxybutyrate (e.g., with 3-hydroxyvalerate) partially addresses these issues, but the resulting copolymer (PHBV) still exhibits a very narrow processing window. Additives, blends, and composites are other ways to overcome these problems4,7.
Recent research on crystallization of PHB in blends and compounds, focused on improving mechanical and thermal properties, have been reported in the literature15-20-48-50.
Composites with natural fillers are a good option to modify
PHB and improve its properties. Vegetable fibers have good
mechanical properties, are fairly compatible with the polar matrix of PHB, and, by its very nature, are completely
biodegradable and frequently biocompatible and nontoxic20,21; they are inexpensive (compared with the polymer matrix) and naturally abundant.
Among the vegetable fillers, the shell of the fruit of the babassu palm tree is rich in cellulosic fiber, and is a
byproduct of extractivist activities centered in the production of oil from the seeds of the fruit. As such, it is a renewable natural resource, obtained without the use of agrochemicals or fertilizers. PHB/babassu compounds are thus very close to the ideal ecofriendly material, if only their properties and processability are found to be reasonable22.
The nonisothermal crystallization characteristics of polymeric compounds are important tools to characterize
the microstructure of the materials and study filler-matrix
interactions. Moreover, crystallization is a key step in many processes, including extrusion and molding. Reliable information about the kinetics of nonisothermal crystallization may be useful in designing and optimizing commercial processes for
the production of films, fibers, etc23. Differential scanning calorimetry has been employed for some time to generate this information24. However there is a lack of quantitative correlations, critically evaluated in terms of its predicting ability, to estimate the evolution of crystallinity and its dependence on time, temperature and rate of cooling.
The objective of the present work is to study the effect
of processing time, and the type and initial particle size of
aDepartamento de Engenharia Química, Universidade Federal de Pernambuco (UFPE), 50670-901,
Recife, PE, Brasil
bDepartamento de Engenharia dos Materiais, Universidade Federal de Campina Grande(UFCG),
the filler, on the nonisothermal crystallization parameters of
PHB/20% babassu compounds. In addition, the suitability of two macrokinetic models for nonisothermal melt crystallization (Pseudo-Avrami and Mo) to correlate the experimental results is investigated. A new, improved version of the latter is presented. No attempt is made to “explain” the results of thermal analysis in structural terms, as we believe that without in depth microscopic studies and other
characterization techniques, interpretation of DSC results
alone are mostly unwarranted speculation.
2. Materials and Methods
2.1 Materials
The matrix for the compounds, called PHB, is actually the random copolymer of 3-hydroxybutyrate (3HB) and 3-hydroxyvalerate (3HV) containing approximately 4%
units of 3HV. It was supplied by PHB Industrial SA (of Serrana SP, Brazil), commercial grade FE-141. According
to the manufacturer it has a density of 1.20 g/cm3 (ASTM
D729) and a melt flow rate of 23-25 dg/min (ASTM D1238,
190°C/2.16 kg).
As filler, two types of vegetable fiber were used, taken
from the outer (epicarp) and intermediate (mesocarp) layers
of the shell of the fruit of the babassu palm tree, codified in the present work as EPI and MESO, respectively. The filler
was supplied by a cooperative of local producers, MAPA
(São Luis MA, Brazil). Two different granulometries were
employed, resulting from screening of the raw materials: one with average particle size between 150 and 75 (code #100) and other with average particle size between 45 and 75 µm (code #200).
2.2 Processing
Polymer and filler were dried for 4 h at 60°C immediately
before processing in a laboratory internal mixer Haake Rheomix 600 with high intensity (roller type) rotors at 60 rpm, keeping the chamber wall at a constant temperature of
160°C. The initial fill factor was about 70%. Compounds with 80% PHB and 20% (w/w) babassu fiber were prepared
at two processing times, 4 min and 8 min, in order to study
the combined effect of mixing and matrix degradation25.
2.3 Thermal Analysis
Tests were conducted in a Mettler-Toledo DSC-1
instrument with 5 to 10 mg samples in standard aluminum
crucibles under a constant inert gas (nitrogen) flow of 50 mL/min. The samples were subjected to a three-stage
thermal program: heated from ambient temperature
(25°C) to 185°C at 16°C/min, cooled at different constant
rates (2, 3, 4, 6, 8, 12, 16 e 24 °C/min), and reheated at either 4 or 16°C/min. A common and relatively fast initial heating rate was chosen to minimize matrix degradation and
provide a uniform molten material before the critical stage of polymer crystallization from the melt41.
Raw time (t), sample temperature (T) and heat flow (J) registered by the instrument at 1 s intervals were integrated, using a suitable virtual baseline (J0) and onset/end points visually determined (t1,t2), for the melt crystallization event during cooling. Custom software was employed to obtain the relative crystallinity (x) and rate of crystallization (c) as functions of time and temperature:
(1)
(2)
where
(3)
is total latent heat of phase change. Time and temperature are related through the constant rate of cooling, φ = |dT/dt|:
(4)
From the functions x(T) and c(T) a series of characteristic
crystallization parameters could be estimated. For example,
the crystallization (or fusion) temperature interval is estimated from temperatures at which conversion (x) reaches 0.1% and 99.9 %:
(5)
and the half-crystallization time:
(6)
Mass crystallinity recovered during the event is estimated as:
(7)
where msis the sample mass, wP is the mass fraction of the polymer (PHB) and DHm0 is the latent heat of melting
of a 100% crystalline polymer, taken in the present work as 146 J/g26.
While considering parameters derived from the experimental
data obtained by differential scanning calorimetry, allowance should be made for the relative imprecision of this technique. Following expert recommendation24 discrepancies below 5% (or ± 1°C in temperatures) will be disregarded.
The thermogravimetric analyzes were conducted on a
Shimadzu DTG-60H instrument, using alumina crucible
under nitrogen atmosphere, with an approximate mass of 5 mg samples. The samples were heated at a heating rate
x t E1 J t J t dt
t t
0 1 0
= l - l l
Q V
#
Q V Q Vc t dxdt J t EJ t
0 0
= =
-Q V Q V Q V
E J t J t dt
t t
0 0
1 2
=
#
Q V- Q VT=T1-z
Q
t-t1V
T T99 9. % T0 1. %
D =
-t50% t0 1. %
1 2
x =
-X
H
H
m w
H
E
c
m c
s P m
0 0
0
of 10°C / min from 25 to 600°C for the loads and from 25 to 800°C for the composites.
Filler particle distribution and filler/matrix interface were explored by scanning electron microscopy (SEM) with a Shimadzu SSX-550 instrument. Samples consisted of impact test specimens fractured in liquid nitrogen and
metallized. Their fracture surface was observed at several
magnifications between 500x and 2000x39.
3. Results and Discussions
As reported elsewhere27,28,30,39-44 PHB crystallizes only partially from the melt during the cooling stage, and the crystallization process is completed during the reheating stage (cold crystallization). However, in PHB compounds
with 20% babassu fiber content, full melt crystallization was verified in all tests, suggesting a strong nucleating effect of the filler. Melt crystallization shows simple, fairly symmetric exothermic peaks in the DSC scans.
3.1 Effect of filler type, particle size, and
processing time on melt crystallization
Some melt crystallization parameters obtained using theprocedures described in the previous section are collected
in Table 1 for DSC tests performed at two different cooling rates (4 and 16°C/min) on samples processed for two different times (4 and 8 min) and compounded with different filler types
(epicarp and mesocarp of babassu fruit) and different initial particle sizes (#100 and #200). Comparisons in graphical
form are presented in Figure 1, plots of the normalized melt crystallization peak - the rate of crystallization Eq.(2).
Filler type (epicarp versus mesocarp), even with the same particle size, moderately affected the melt crystallization parameters (Table 1 and Figure 1a). Mesocarp facilitates
PHB crystallization, which runs 15% faster and takes place at 2.5°C higher temperature. The 2 to 5% higher crystallinity observed is probably within the expected uncertainty.
It has been shown29 that the mild processing conditions
in the laboratory internal mixer have little effect on filler
particle size. Moreover, particle size has a discreet effect on
PHB crystallization at 4°C/min (and none at 16°C/min), as
shown in Table 1 an Figure 1b. Samples processed for only
4 min correspond to materials that were “just molten” in the
mixing chamber; filler dispersion resulting in this case from mixing during the matrix melting process only. Samples
processed for 8 min were given an extra 4 min of melt
mixing to complete the filler dispersion process. However,
the extra time at processing temperature, even under the mild conditions in the internal mixer chamber, is known to result in
significant PHB degradation30. Notwithstanding, experimental
results (Table 1 and Figure 1c) show that processing time did not affect significantly the crystallization parameters. 3.1.1 Thermogravimetric analysis (TGA)
The thermogravimetric analyzes were conducted in a
Shimadzu DTG-60H instrument, using alumina crucible
under nitrogen atmosphere, with an approximate mass of 5 mg samples. The samples were heated at a heating rate of 10°C / min from 25 to 600°C for the loads and from 25 to 800°C for the composites.
PHB and its composites are stable up to 280 degrees as
is verified by Cipriano et. al, 2016 and Almeida et. al, 2018, respectively, according to Figure 2.
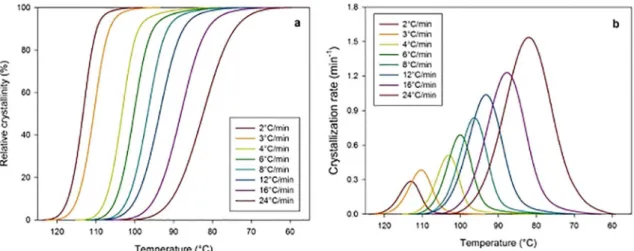
3.2 Effect of cooling rate on melt crystallization
The sample of PHB/20% babassu epicarp #100 processed for 8 min was selected for in depth analysis of the melt
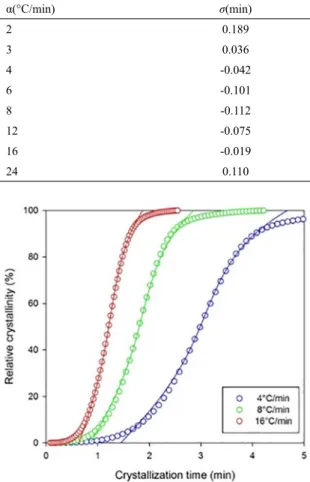
crystallization process. Figure 3 shows the relative crystallinity
(fraction crystallized) and crystallization rate computed by
integration of the DSC output, in tests performed at eight different cooling rates. As discussed in the Experimental
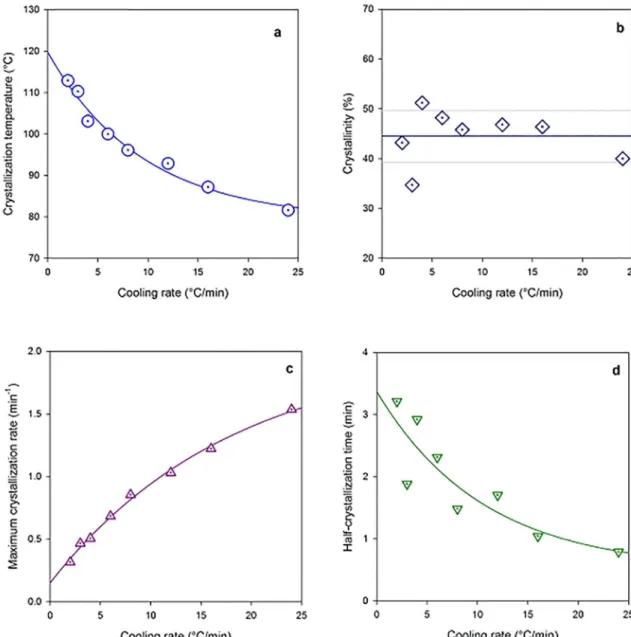
section, the melts were obtained in all tests by heating the sample from ambient temperature to 185°C at the uniform rate of 16°C/min. Table 2 collects some important crystallization parameters, whose dependence on the cooling rate is depicted
graphically in Figure 4.
The trends observed are as expected: crystallization temperature decreases and crystallization rate increases as
Table 1. Melt crystallization parameters (PHB/20% Babassu) Effect of filler type, particle size, and processing time.
Type Mesh Process Time ∆Tc Tc cmax ∆Xc
(min) (°C) (°C) (min-1) (%)
Tests at φ= 4°C/min
EPI 100 4 114.6 → 91.9 102.0 0.459 46.4
EPI 200 4 118.7 → 93.2 106.3 0.441 47.8
EPI 100 8 112.4 → 87.6 100.6 0.444 53.0
MESO 100 8 114.8 → 77.9 103.1 0.505 51.2
Tests at φ= 16°C/min
EPI 100 4 102.8 → 66.6 84.9 1.088 41.1
EPI 200 4 102.6 → 65.1 85.7 1.122 42.2
EPI 100 8 103.9 → 62.3 84.6 1.051 41.4
Figure 1. Melt crystallization rate versus temperature for PHB/20% babassu compounds measured at two different cooling rates: (a)
epicarp and mesocarp #100 compounds processed for 4 min; (b) epicarp #100 and #200 compounds processed for 4 min; c) epicarp #100 compounds processed for 4 and 8 min.
cooling rate increases, with an almost logarithmic dependence, while crystallinity remains approximately constant. An interesting fact - that could be exploited if these results are to be used in process simulation - is the regularity of the temperature and rate dependencies on cooling rate, and wider data dispersion for the crystallinty and half-crystallization time.
3.3 Crystallization kinetics
Crystallization macrokinetic models are useful to
correlate experimental data. Even the most “theoretical” of
them - the Avrami model for isothermal crystallization - is being described as such: “all in all, the Avrami analysis is
rather a convenient representation of experimental data than a way of obtaining physical insights in the polymer crystallization kinetic”31,32. One of the major uses may be to insert them “into processing and manufacturing protocols
to rationally develop and control commercial processes in which crystallization is one among several concurrent
phenomena”23. Consequently, the value of macrokinetic models lies more on how well they predict the experimental
data from which they are derived, less in the structural or microscopic interpretation of the model parameters.
In the operating conditions of a process, the cooling rates may or may not be greater than the experimental ones.
However we are limited with the capacity of the equipment.
3.3.1 Pseudo Avrami model
The simplest model to correlate the relative crystallinity x with time since the onset of the crystallization event
τ = t - t1 in nonisothermal melt or cold crystallization events, measured at constant heating/cooling rate is formally based
in the well-known Avrami equation:
(8)
developed for isothermal crystallization processes. K’ and n’ are the parameters of the model, which are functions of the heating/cooling rate. These parameters have no connection with the true Avrami parameters (that are functions of the
Figure 3. Relative crystallinity (a) and rate of crystallization (b) versus temperature for PHB/20% babassu (epicarp #100) compounds processed for 8 min.
Table 2. Melt crystallization parameters (PHB/20% Babassu). Effect of cooling rate.
φ ∆Tc Tc cmax τ½ ∆Xc
(°C/min) (°C) (°C) (min-1) (min) (%)
2 119.6 → 105.5 112.9 0.315 3.21 43.2
3 116.3 → 105.3 110.3 0.465 1.88 34.7
4 114.8 → 77.9 103.1 0.505 2.92 51.2
6 114.0 → 78.6 100.0 0.682 2.31 48.2
8 108.3 → 81.0 96.1 0.854 1.48 45.8
12 113.7 → 73.2 92.9 1.030 1.70 46.8
16 104.3 → 64.1 87.2 1.222 1.04 46.4
24 101.0 → 62.6 81.6 1.535 0.79 40.0
exp
x
1
K
x
ntemperature). For this reason we call the model Pseudo-Avrami; Eq.(8) is the integral form of Pseudo-Avrami model.
Pseudo-Avrami parameters may be obtained by regression of experimental data x versus T (at constant φ), through the
linear expression derived from Eq.(8):
(9)
Pseudo-Avrami model should be taken as an empirical correlation for macroscopic nonisothermal data; its parameters have no microkinetical or structural meaning at all.
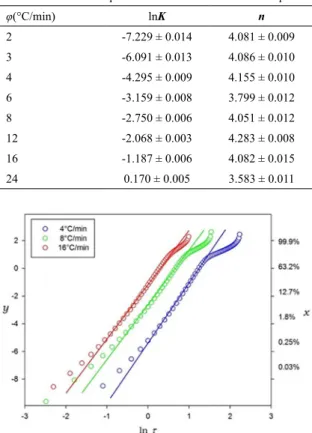
Figure 5 shows an example of Pseudo-Avrami plot.
Notice that the interval selected for the linear regression was carefully adjusted, with the aid of the right axis scale, to include the most relevant zone, roughly 1 to 95% conversion.
Table 3 shows the parameters estimated in this way, which are presented graphically - as functions of the cooling rate
- in Figure 6.
Uncertainty of the individual parameter values is very low (between 0.1 and 1%) but for the model to be really useful in processing calculations, the parameters should be expressed by function valid for any cooling rate (within the interval tested). Parameter K may be represented as a simple function:
and exponent n is almost constant (independent of the
cooling rate), albeit with a significant dispersion (within
5%):n=0.405±0.220, as can be seen in Figure 6.
Figure 4. Melt crystallization parameters versus cooling rate for PHB/20% babassu (epicarp #100): (a) crystallization peak temperature; (b) crystallinity; (c) peak cooling rate; (d) half-crystallization time.
ln ln ln ln
y=
S
1-1 xX
= Kl+nl x. . . .
lnK 12 3417 9 9470lnz 3 1248lnz2 0 4752lnz
Model predictions should be tested against experimental
data to assess the validity of the model. Figure 7 compares
the relative crystallinity measured and predicted by the Pseudo-Avrami model in three particular cases, showing
a good fitting.
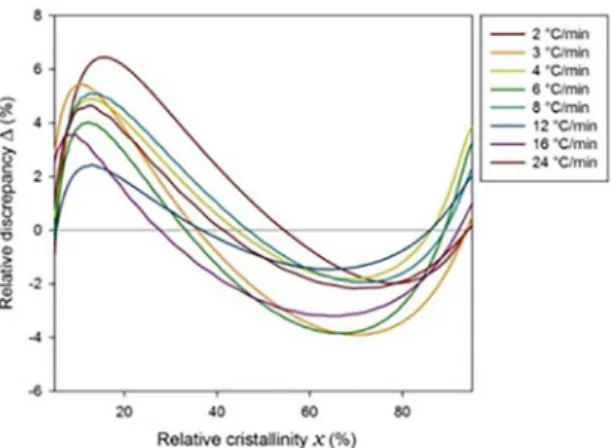
For a more quantitative analysis the relative discrepancy between model and experimental data defined as:
(10)
is plotted against the conversion in Figure 8 for all tests
performed. Pseudo-Avrami model results in estimates of relative crystallinity within + 6% and -4% of the experimental data.
Pseudo-Avrami overestimates the conversion during the first
half of the melt crystallization process and underestimates it during the second half.
3.3.2 Mo model
A macrokinetic model attributed to Mo35-37 correlates the rate of heating/cooling φ= |dT/dt| to the time measured since the onset of crystallization, τ = t - t1, with data obtained at constant relative crystallinity:
Table 3. Pseudo-Avrami parameters for PHB/20% babassu compounds.
φ(°C/min) lnK n
2 -7.229 ± 0.014 4.081 ± 0.009
3 -6.091 ± 0.013 4.086 ± 0.010
4 -4.295 ± 0.009 4.155 ± 0.010
6 -3.159 ± 0.008 3.799 ± 0.012
8 -2.750 ± 0.006 4.051 ± 0.012
12 -2.068 ± 0.003 4.283 ± 0.008
16 -1.187 ± 0.006 4.082 ± 0.015
24 0.170 ± 0.005 3.583 ± 0.011
Figure 5. Pseudo-Avrami plot for the melt crystallization of PHB in PHB/20% babassu (epicarp #100) compounds, showing the experimental points (circles) and correlation lines for tests at three cooling rates (indicated).
x
x
x
exp exp
erimental
predicted erimental
D
=
-Figure 6. Pseudo-Avrami parameters as functions of the cooling rate.
Figure 8. Relative discrepancy between Pseudo-Avrami model prediction and experimental data along the crystallization process for all cooling rates tested (indicated).
(11)
Mo model, despite claims of its authors (that it should be taken as motivation, not proof) is a purely empirical
correlation procedure, whose justification cannot be sought in
“theory” but in the model’s ability to represent experimental data within an acceptable level of discrepancy.
Mo parameters, F and α, are function of the conversion x. The model may be used to correlate both cold and melt
crystallization results. However, since nonisothermal DSC
tests are usually conducted at constant heating/cooling rate, experimental results taken at several values of φmust be interpolated to extract from them the information at constant
relative crystallinity. Formally: x = x (c) a φ= constant → φ = φ( τ ) a x = constant
Once the interpolated results are computed, Mo parameters
could be estimated from a linear regression on the expression
derived from Eq.(11):
(12)
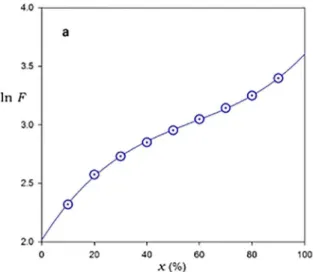
Figure 9 shows Mo plot for PHB crystallization in PHB/20% bassssu fiber (epicarp #100) compounds at nine different values of the conversion, and Table 4 collects Mo
parameters thus estimated.
Uncertainty in the parameters is very reasonable (1.8% for lnF, 3.5 to 5% for α) but still significantly higher than Pseudo-Avrami parameters. However, the dependence of Mo parameters
with relative crystallinity, shown graphically in Figure 10, is very smooth (compare Figure 10b with Figure 6b). The
smoothness of the relationship recommends Mo model for applications in which the parameters must be estimated for arbitrary values of the conversion, such as process simulation.
Parameter F may be represented as cubic expression on x:
F
z
=
x
-alnz=lnF-alnx
Figure 9. Mo plot for the melt crystallization of PHB in PHB/20% babassu (epicarp #100) compounds, showing the experimental points (symbols) and correlation lines for tests at relative crystallinities (indicated) between 10% and 90%.
Table 4. Mo parameters for PHB/20% babassu compounds.
x(%) ln F α
10 0.784 ± 0.044 0.797 ± 0.067
20 0.936 ± 0.048 0.804 ± 0.063
30 1.029 ± 0.051 0.809 ± 0.062
40 1.100 ± 0.054 0.813 ± 0.060
50 1.161 ± 0.056 0.817 ± 0.059
60 1.218 ± 0.058 0.821 ± 0.059
70 1.275 ± 0.060 0.825 ± 0.058
80 1.338 ± 0.064 0.829 ± 0.058
and exponent α as linear function of the same :
Variable x in the previous expression is expressed as fraction, 0 < x < 1 (not percentage).
However, proof of utility of any empirical model
consists on the goodness of fit between model prediction and
experimental data. It is in this area that Mo model is found
wanting. In the first place, Mo model is unable to represent the
experimental data for the onset and end of the crystallization process. Mo model, whatever the parameters be, doesn’t lead to a true sigmoid x = x(T), and exhibits - unlike experimental
data - finite rates of crystallization in the limits x → 0 and x
→ 1. It can be shown, starting from Eq.(11) and after a long series of mathematical manipulations, that the differential
form of the Mo model, with both parameters depending on conversion, is given by:
(13)
.
.
.
ln
F
2 0155 3548
x
4 691
x
22 731
x
3=
+
-
+
r
20 999
.
=
.
.
x
1 3413
0 669
a
=
+
r
20 994
.
=
ln
ln
ln
ln
ln
d
dx
dx
d
F
F
Figure 10. Mo parameters as functions of the relative crystallinity.
From Eq.(13), in general:
(14)
Moreover, fitting at intermediate values of the relative
crystallinity - even with best parameters - is not particularly
good, as shown in Figure 11 for the system tested, which
shows a typical behavior 38.
The quantitative differences between predicted and experimental values is better appreciated defining a discrepancy function, equivalent to Eq.(10), and plotting it against the relative crystallinity. For Mo model we chose the difference
between predicted and experimental crystallization time needed to reach a given level of conversion, and using the
half-crystallization time, Eq.(6), as a characteristic value:
(15)
Figure 12 shows such a plot. Discrepancies are highly
cooling rate dependent and vary between +15% and -8% within the range of validity of the model (5-95% conversion).
A small modification of the model may improve dramatically
its performance. A modified Mo model is defined by:
(16)
where the new parameter σ - a function of the heating/ cooling rate - is selected to match predicted and experimental crystallization times for x = 50%. Table 5 shows the correction time for all tests performed with PHB/20% babassu compounds. The correction factors of Table 5 (in min) are well correlated with the cooling rate (in °C/min): ln δ =0.581-0.682(ln ϕ) + 0.168(ln ϕ)2 r2 = 0.998
Figure 13 compares predicted and experimental values of relative crystallinity for three typical cases and Figure 14
Figure 11. Comparison of experimental points (circles) and prediction of Mo model (lines) for three cooling rates (indicated).
Figure 12. Relative discrepancy between Mo model prediction and experimental data along the crystallization process for all cooling rates tested (indicated).
d
dx
d
dx
0
x 0 x 1
!
!
x
=x
=exp
predicted erimental
1 2 x
x x
D=
-exp F
shows the discrepancy in crystallization times as a function of the conversion.
Discrepancies are reduced to +3% and -4% within the
range of validity of the model, as can be seen in Figure 14.
Discrepancies below the reproducibility of experimental data and smooth dependence of parameters on the cooling rate
made the modified Mo model the best choice to correlate
relative crystallinity with crystallization time for PHB/20% babassu compounds, except during the initial (x < 5%) and
final (x > 95%) stages of the process.
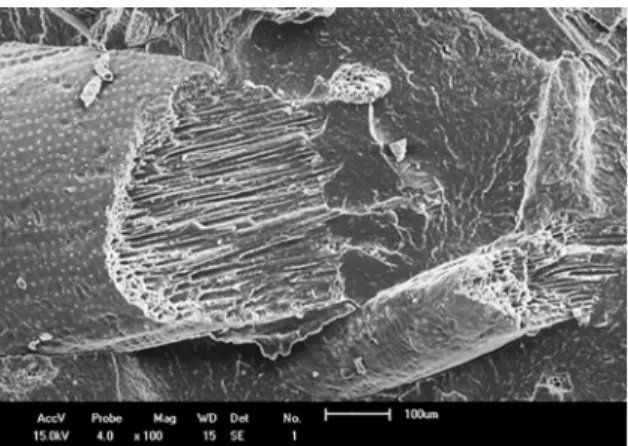
3.4 Scanning electron microscopy (SEM)
Scanning electron microscopy studies of biodegradable composites show that the charges are significantly different.
The babassu mesocarp is formed by relatively uniform and isometric particles of diameter between 20-50 micrometers
as shown in Figure 15.
On the other hand, the epicarp shows a heterogeneous
morphology with the presence of anisotropic particles as
bundles of fibers, as shown in Figure 16.
Lemos et. al (2017) performed a detailed study on the structure of babassu fiber, in addition to wood and sugarcane fibers, using characterization techniques such as surface
Table 5. Parameter σ for modified Mo modeling of PHB/20% babassu compounds.
α(°C/min) σ(min)
2 0.189
3 0.036
4 -0.042
6 -0.101
8 -0.112
12 -0.075
16 -0.019
24 0.110
Figure 13. Comparison of experimental points (circles) and prediction of modified Mo model (lines) for three cooling rates (indicated).
morphology by Scanning Electron Microscopy (SEM) of fibers, optical microscopy of fibers and Fourier Transform Infrared Spectroscopy (FTIR). They concluded that micrographs
showed a hererogeneous and random size distribution of the
natural fibers and FTIR showed good similarity in relation to the chemical composition of the fibers.
Staufenberg, Graupner & Müssigthey (2015) performed comparative studies on the fiber morphology of the epicarp and mesocarp of babassu, confirming what was shown in Figures 15 and 16.
Santana et al. (2010) show the importance of the chemical treatment of the fiber to improve the adhesion between the
polymer matrix and the load and how the treatment acts in
different parts of the babassu: epicarp and mesocarp. This
topic will be covered in more detail in the next article.
4. Conclusions
A detailed study by DSC of the noinsothermal melt crystallization of PHB in PHB/20% vegetable fiber (babassu)
compounds prepared by melt mixing was presented. It was found that initial particle size and processing time have little
effect on the crystallization characteristics of the polymer, while the origin of the fiber (epicarp or mesocarp of the
Figure 14. Relative discrepancy between modified Mo model
prediction and experimental data along the crystallization process for all cooling rates tested (indicated).
Figure 15. SEM micrograph of PCL/30% Meso babassu compound
Figure 16. SEM micrograph of PCL/20% Epi babassu compound
at 100 magnification.41
fruit) moderately affects them. It was also found that - unlike
what is reported elsewhere for neat PHB - the crystallization process is completed during the cooling stage in PHB/
babassu compound, the filler acting probably as an effective nucleating agent. Cooling rate, while affecting crystallization temperature and rate as was expected, has no effect on the
degree of crystallinity developed in the event.
Pseudo-Avrami kinetic model correlates well experimental data over the whole conversion interval, with deviations of 5%. However, uncertainty of interpolated data is highly
affected by rough dependence of model parameters on
cooling rate. The opposite behavior was found for the model proposed by Mo and collaborators: deviations are relatively large (±15%), but interpolation is facilitated by the smooth dependence of the parameters on relative crystallinity. A
modification of the original Mo model is proposed, which
enhances its predictive capabilities (± 4% over the interval
from 5% to 95% conversion). The modified Mo model
is thus recommended as reliable predictive algorithm to correlate nonisothermal melt crystallization kinetics for the system under study.
5. Acknowledgements
The authors gratefully acknowledge PHB Industrial
SA (Serrana SP, Brazil) and MAPA (São Luis MA, Brazil) for freely providing the matrix and filler used in this work and Conselho Nacional de Desenvolvimento Científico e Tecnológico (CNPq) and Fundação de Amparo à Ciência e Tecnologia do Estado de Pernambuco (FACEPE) (Brazil) for the financial support.
6. References
1. Tokiwa Y, Calabia BP. Degradation of microbial polyesters.
Biotechnology Letters. 2004;26(15):1181-1189. DOI: 10.1023/B:BILE.0000036599.15302.e5
2. United Nations Environment Programme - UNEP. Biodegradable Plastics and Marine Litter. Misconceptions, concerns and impacts on marine environments. Nairobi: UNEP; 2015. 3. Long Y, Katherine D, Lin L. Polymer blends and composites
from renewable resources. Progress in Polymer Science. 2006;31(6):576-602.
4. Satyanarayana KG, Arizaga GGC, Wypych F. Biodegradable composites based on lignocellulosic fibers-An overview.
Progress in Polymer Science. 2009;34(9):982-1021. 5. GESAMP. Sources, Fate and Effects of Microplastics in the
Marine Environment: A Global Assessment. London: International Maritime Organization; 2015.
6. Mohanty AK, Misra M, Drzal LT, eds. Natural Fibers, Biopolymers, and Biocomposites. Boca Raton: CRC Press; 2005.
7. Reddy MM, Vivekanandhan S, Misra M, Bhatia SK, Mohanty AK. Biobased plastics and bionanocomposites: Current status and future opportunities. Progress in Polymer Science. 2013;38(10-11):1653-1689.
8. Owen AJ, Heinzel J, Škrbić Ž, Divjaković V. Crystallization and melting behaviour of PHB and PHB/HV copolymer. Polymer. 1992;33(7):1563-1567.
9. Pearce R, Jesudason J, Orts W, Marchessault RH, Bloembergen S. Blends of bacterial and synthetic poly(ß-hydroxybutyrate): effect of tacticity on melting behavior. Polymer. 1992;33(21):4647-4649.
10. Cesàro A, Navarini L, Pepi R. A modulated DSC analysis of microbial biocompatible polyesters. Thermochimica Acta. 1993;227:157-166.
11. Paglia ED, Beltrame PL, Canetti M, Seves A, Marcandalli B, Martuscelli E. Crystallization and thermal behaviour of poly (D(-)3-hydroxybutyrate)/poly (epichlorohydrin) blends.
Polymer. 1993;34(5):996-1001.
12. Madbouly SA, Mansour AA, Abdou NY. Crystallization kinetics of PHB/PVAc blends using time resolved dielectric spectroscopy.
European Polymer Journal. 2007;43(9):3933-3942. 13. D'Amico DA, Manfredi LB, Cyras VP. Crystallization behavior
of poly(3-hydroxybutyrate) nanocomposites based on modified clays: Effect of organic modifiers. Thermochimica Acta. 2012;544:47-53.
14. Jing X, Qiu Z. Effect of Low Thermally Reduced Graphene Loadings on the Crystallization Kinetics and Morphology of Biodegradable Poly(3-hydroxybutyrate). Industrial and
Engineering Chemistry Research. 2012;51(42):13686-13691.
15. D'Amico DA, Cyras VP, Manfredi LB. Non-isothermal crystallization kinetics from the melt of nanocomposites based on poly(3-hydroxybutyrate) and modified clays. Thermochimica Acta. 2014;594:80-88.
16. Tanase EE, Popa ME, Râpa M, Popa O. PHB/Cellulose Fibers Based Materials: Physical, Mechanical and Barrier Properties. Agriculture and Agricultural Science Procedia. 2015;6:608-615.
17. Mousavioun P, Halley PJ, Doherty WOS. Thermophysical properties and rheology of PHB/lignin blends. Industrial
18. Aziz MSA, Saad GR, Naguib HF. Non-isothermal crystallization kinetics of poly(3-hydroxybutyrate) in copoly(ester-urethane) nanocomposites based on poly(3-hydroxybutyrate) and cloisite 30B. Thermochimica Acta. 2015;605:52-62.
19. Aziz MSA, Naguib HF, Saad GR. Non-isothermal crystallization kinetics of bacterial poly(3-hydroxybutyrate) in poly(3-hydroxybutyrate-co-butylene adipate) urethanes.
Thermochimica Acta. 2014;591:130-139.
20. AL-Oqla FM, Sapuan SM, Anwer T, Jawaid M, Hoque ME. Natural fiber reinforced conductive polymer composites as functional materials: A review. Synthetic Metals. 2015;206:42-4.
21. Bledzki AK, Sperber VE, Faruk O. Natural and Wood Fiber Reinforcement in Polymers. Shawbury: iSmithers Rapra Publishing; 2002.
22. Dong Y, Ghataura A, Takagi H, Haroosh HJ, Nakagaito AN, Lau KT. Polylactic acid (PLA) biocomposites reinforced with coir fibres: Evaluation of mechanical performance and multifunctional properties. Composites Part A: Applied
Science and Manufacturing. 2014;63:76-84.
23. Schultz JM. Polymer Crystallization: The Development of Crystalline Order in Thermoplastic Polymers. Washington:
American Chemical Society; 2001.
24. Höhne G, Hemminger WF, Flammersheim HJ. Differential Scanning Calorimetry. Berlin: Springer; 2003.
25. Vitorino MBC, Reul LTAR, Carvalho LH, Canedo EL.
Thermal properties of poly(3-hydroxybutyrate)/vegetable fiber composites. In: Proceedings of the 30th International Conference of the Polymer Processing Society (PPS-30); 2014 Jun 6-12; Cleveland, OH, USA. College Park: American Institute of Physics; 2015.
26. Barham PJ, Keller A, Otun EL, Holmes PA. Crystallization and morphology of a bacterial thermoplastic: poly-3-hydroxybutyrate.
Journal of Materials Science. 1984;19(9):2781-2789. 27. Wellen MRW, Rabello MS, Araújo Júnior IC, Fechine
GJM, Canedo EL. Melting and crystallization of poly(3-hydroxybutyrate). Effect of heating/cooling rates on phase transformation. Polímeros. 2015;25(3):296-304.
28. Wellen RMR, Canedo EL, Rabello MS. Melting and crystallization of poly(3-hydroxybutyrate)/carbon black compounds. Effect of heating and cooling cycles on phase transition. Journal of Materials Research. 2015;30(21):3211-3226. DOI: https://doi.org/10.1557/jmr.2015.287
29. Canedo EL, Cipriano PB, Carvalho LH. Effect of loading level and granulometry on PHB/vegetal fiber eco-composites. In: 71st Annual Technical Conference of the Society of Plastics Engineers (ANTEC 2013); 2013 Apr 21-25; Cincinnati, OH, USA.
30. Cipriano PB, Sá MD, Andrade ALS, Carvalho LH, Canedo EL. Thermal stability of poly(3-hydroxybutyrate)/vegetable fiber composites. In: Proceedings of the 30th International Conference of the Polymer Processing Society (PPS-30); 2014 Jun 6-12; Cleveland, OH, USA. College Park: American Institute of Physics; 2015. DOI: http://dx.doi.org/10.1063/1.4918383
31. Vyazovkin S. Isoconversional Kinetics of Thermally Stimulated Processes. Berlin: Springer; 2015.
32. Cheng SZD, Jin S. Crystallization and melting of metastable crystalline polymers. In: Cheng SZD, ed. Handbook of Thermal
Analysis and Calorimetry. Volume 3. Applications to Polymers and Plastics. Amsterdam: Elsevier; 2002.
33. Liu T, Mo Z, Wang S, Zhang H. Nonisothermal melt and cold crystallization kinetics of poly(aryl ether ether ketone ketone).
Polymer Engineering & Science. 1997;37(3):568-575. DOI: 10.1002/pen.11700
34. Liu T, Mo Z, Zhang H. Nonisothermal crystallization behavior of a novel poly(aryl ether ketone): PEDEKmK. Journal of Applied Polymer Science. 1998;67(5):815-821. DOI: 10.1002/(SICI)1097-4628(19980131)67:5<815::AID-APP6>3.0.CO;2-W
35. An Y, Dong L, Mo Z, Liu T, Feng Z. Nonisothermal crystallization kinetics of poly(β-hydoxybutyrate). Journal of Polymer Science Part B: Polymer Physics. 1998;36(8):1305-1312. DOI: 10.1002/ (SICI)1099-0488(199806)36:8<1305::AID-POLB5>3.0.CO;2-Q
36. Wellen RMR, Canedo EL. Kinetic analysis of crystallization in PHB/carbon black compounds. Mo model. AIP Conference
Proceedings. 2016;1779(1):060009.
37. Cipriano PB. Efeito das condições de processamento na estrutura
e propriedades dos compósitos de poli(3-hidroxibutirato) e fibra de babaçu. [Thesis]. Campina Grande: Universidade Federal de Campina Grande; 2016.
38. Almeida TG. Preparação e propriedades de compósitos de poli(butileno adipato-co-bultileno tereftalato) e fibra vegetal: efeito do teor de carga e das condições de processamento. [Thesis]. Campina Grande: Universidade Federal de Campina Grande; 2018.
39.. Reul LTA, Camila CAB, Sousa FM, Santos RM, Carvalho LH, Canedo EL. Polycaprolactone/babassu compounds: Rheological, thermal, and morphological characteristics. Polymer Composites. 2018. E-pub ahead of print. DOI: https://doi.org/10.1002/pc.24861
40. Ries A, Canedo EL, Monteiro AEG, Almeida YMB, Wellen RMR. Model-free non-isothermal crystallization kinetics of poly(3-hydoxybutyrate) filled with carbon black. Polymer Testing. 2016;50:241-246. DOI: http://dx.doi.org/10.1016/j. polymertesting.2015.12.017
41. Wellen RMR, Rabello MS, Guilhermino JM, Fechine GJM, Canedo EL. The melting behaviour of poly(3-hydroxybutyrate) by DSC.
Reproducibility study. Polymer Testing. 2013;32(2):215-220. DOI: http://dx.doi.org/10.1016/j.polymertesting.2012.11.001
42. Wellen RMR, Rabello MS, Araujo Júnior IC, Fechine GJM, Canedo EL. Melting and crystallization of poly(3-hydroxybutyrate): effect of heating/cooling rates on phase transformation. Polímeros. 2015;25(3):296-304. DOI: http://dx.doi.org/10.1590/0104-1428.1961
43. Wellen RMR, Canedo EL, Lima CAV, Araújo Júnior IC, Almeida YMB, Rabello MS. The Effect of Polystyrene on the Crystallization of Poly(3-hydroxybutyrate). Materials Research. 2015;18(2):235-239. DOI: http://dx.doi.org/10.1590/1516-1439.242213
45. Lemos AL, Mauss CJ, Santana RMC. Characterization of natural fibers: wood, sugarcane and babassu for use in biocomposites. Cellulose Chemistry and Technology. 2017;51(7-8):711-718.
46. Staufenberg G, Graupner N, Müssig J. Impact and hardness optimisation of composite materials inspired by the babassu nut (Orbignya speciosa). Bioinspiration & Biomimetics. 2015;10(5):056006. DOI: 10.1088/1748-3190/10/5/056006.
47. Santana SA, Vieira AP, da Silva Filho EC, Melo JC, Airoldi C. Immobilization of ethylenesulfide on babassu coconut epicarp and mesocarp for divalent cation sorption. Journal of Hazardous Materials. 2010;174(1-3):714-719. DOI: 10.1016/j.jhazmat.2009.09.109
48. Auriemma M, Piscitelli A, Pasquino R, Cerruti P, Malinconico M, Grizzuti N. Blending poly (3-hydroxybutyrate) with tannic acid: influence of a polyphenolic natural additive on the rheological and thermal behavior. European Polymer Journal. 2015;63:123-131.
49. Angelini S, Cerruti P, Immirzi B, Santagata G, Scarinzi G, Malinconico M. From biowaste to bioresource: Effect of a lignocellulosic filler on the properties of poly (3-hydroxybutyrate). International Journal
of Biological Macromolecules. 2014;71:163-173.