*e-mail address: [email protected]
1. Introduction
Bacterial polyhydroxyalkanoates (PHAs) are the unique family of polymers that acts as a carbon/energy store for more than 300 species of Gram-positive and Gram-negative bacteria as well as a wide range of archaea1.
The French bacteriologist Lemoigne was the irst to isolate and characterize poly-3-hydroxybutyrate (PHB) from bacteria between 1923 and 1927, and showed that this extract could be cast in to a transparent ilm and, most importantly, these biopolymers were completely biodegradable1. PHB is an eco-friendly alternative for several applications, for example, PHB have demonstrated great potential as a material for food packaging2. Also in the area of biomaterials the osteogenic potential of pure PHB patches has been evaluated by Gredes et al.3 These authors concluded that the tested PHB patches featured a good biocompatibility and an osteoconductive character.
In vivo PHB granules are fully amorphous, but during recovery, the amorphous granules environment changes and may cause the crystallization of the particles4. When pure PHB is heated above its melting point (~180°C), it becomes a fully amorphous melt. Upon cooling, the PHB molecules crystallize, forming antiparallel helical chains linked by C – H∙∙∙O hydrogen bonds between the carbonyl (C=O) and methyl (CH3) groups of the polyester backbone4. The inal PHB polymer properties depend on the crystallization degree, which depends on the PHB processing conditions. So, it is very useful to characterize the PHB crystallization and properties under different processing methods.
In an electrospinning process, a strong electrostatic ield is applied to a polymer solution held in a syringe and feed through a needle. The iber jet travels through the atmosphere allowing the solvent to evaporate, thus leading to the solid polymer ibers deposition on the collector5. Blends of several ratios of poly(3-hydroxybutyrate-co-hydroxyvalerate) (PHBV) and chitosan were electrospun to produce ibrous membranes6. In this case, the goal was to combine these two biocompatible and biodegradable polymers, thus creating a new material with potential biomedical application. Another example is the PHB (core) and gelatin (sheath) coaxial electrospinning, producing porous ibrous mats with potential as a scaffold (dermal substitute) for skin regeneration7.
The present work, thus, aims to show the possible PHB properties changes, mainly in the crystallinity, when this biopolymer was processed through thermo compression molding or electrospinning.
2. Experimental
2.1. Materials
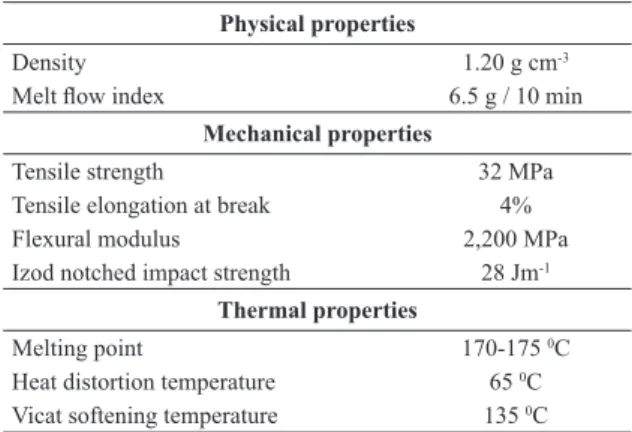
Poly(hydroxybutyrate) (PHB) (Biocycle 1000, Mw = 600,000 g mol-1) was provided by PHB Industrial S.A (Serrana, Brazil). According to the manufacturer, the product has the properties shown in Table 1. Chloroform and N, N - dimethylformamide (DMF) were supplied by Synth (Brazil). All reagents were used as received without any pre-treatment.
What Changes in Poly(3-Hydroxybutyrate) (PHB) When Processed as Electrospun
Nanoibers or Thermo-Compression Molded Film?
Artur Caron Mottina, b, *, Eliane Ayresa, b, Rodrigo Lambert Oréicec, Jairo José Drummond Câmaraa, b
aThematic Network in Materials Engineering - REDEMAT, School of Mining Engineering, Ouro Preto, MG, Brazil.
bSchool of Design, Department of Materials, Technologies and Processes, Minas Gerais State University – UEMG, Belo Horizonte, MG, Brazil.
cDepartment of Metallurgical and Materials Engineering, Federal University of Minas Gerais – UFMG, Pampulha, Belo Horizonte, MG, Brazil.
Received: May 18, 2015; Revised: August 20, 2015; Accepted: November 20, 2015
In the present study, PHB ilm was prepared by thermo-compression molding and PHB nanoibers mat was produced through electrospinning process. The nanoibers morphology was conirmed by SEM. The ilm and nanoibers crystallinity degree was estimated by different methods. FTIR and WAXD indicated that PHB ilm is more crystalline than PHB nanoibers. However, DSC analysis suggested that a PHB nanoibers phase change might occur while the temperature rises. SAXS indicated that PHB ilm and nanoibers have low electron density contrast between the alternating crystalline and amorphous layers. The inluence of nanoiber morphology on the mechanical, surface and thermal properties was also shown in TG analysis, tensile tests and contact angle measurements.
2.2. PHB thermo-compression molded ilm
preparation
PHB ilm was prepared by thermo-compression molding using a SAGEC manual hydraulic press with heated platens, manual thermostat control and maximum pressure of 30,000 psi. First the press was pre-heated at 170 0C and enough PHB powder was placed in a stainless steel frame with top and bottom covers (200 x 200 x 1.2 mm). Films were obtained at 4000 psi of pressure during 2 min. For successful demolding, Kapton, a heat sealable grade polyimide ilm produced by DuPont, was used as anti-adhesion layer.
2.3. PHB Electrospinning
First, PHB was dissolved in a chloroform and DMF mixture at a 9:1 ratio to yield a homogeneous solution with 6% wt concentration. The solubilization was carried out in a magnetic stirrer (TECNAL, model 0851) for 3 hours at 50 0C. The electrospinning apparatus was an equipment manufactured by INSTOR (Porto Alegre, Brazil), that makes use of a 5 mL syringe (Artiglass, Italy) connected to a stainless steel needle (0.7 mm in diameter), with a polarity reversible high voltage power supply (Gamma High Voltage Research, USA) with one electrode directly clamped onto the metal needle and the other electrode clamped onto a rotating collector of low rotational speed (40 rpm). During the electrospinning process, the solution was ejected from the positively charged needle (11 kV) tip by using a syringe pump, connected to the syringe through a Telon tube, used to push the syringe to deliver a constant and stabilized polymer solution mass low. The ibers were randomly deposited onto the collector surface connected to ground with a zero polarity. The distance between the needle tip and the collector was of 10 cm. The experiment was conducted at 25°C and 50% of relative humidity. The aforementioned process conditions were previously determined by extensive experimental work.
2.4 Characterization of PHB ilms and nanoibers
mat
2.4.1 Scanning electron microscopy (SEM)
The PHB nanoibers mat morphology was analyzed via scanning electron microscopy (SEM) (Shimadzu model Vega 3LM) at an accelerating voltage of 15 kV. Samples for SEM
were coated with gold using a sputter coater (SPI Sputter Coater, SPI Supplies, PA, USA). To determine the nanoibers diameter and the diameters distribution, the nonwoven mat was analyzed using 100 individual measurements, which were obtained from the SEM micrograph by image analysis software (Image J, National Institutes of Health, USA).
2.4.2 Fourier transform infrared spectroscopy (FTIR)
Fourier transform infrared (FTIR) experiments were performed with the aid of a Thermo Scientiic Nicolet™ 6700 FT-IR spectrometer at a 4 cm−1 resolution and 256 co-added scans. The spectra were obtained with dry ilms using the ATR (attenuated total relection) technique, in which the samples were pressed against a ZnSe crystal and spectra were collected from 650 - 4000 cm-1.
2.4.3 X-ray diffraction (XRD)
The crystallographic structure of PHB different morphologies (ilm and nanoibers) was veriied using an X-ray diffractometer (Shimadzu, model XRD-7000) equipped with a Cu tube (CuKα radiation, λ=1.54 Å) operating at 40 kV and 30 mA. The samples were scanned at 20 min-1 between 2θ= 5 and 800.
2.4.4 Mechanical properties
PHB ilm and nanoibers mat were characterized in their tensile properties, such as elastic modulus, tensile strength and elongation at break, using an Instron testing machine (model EMIC 3000) with load cell of 200 N. Tensile properties were characterized according to ASTM D-638 and at least ive specimens were tested to obtain the average values. A crosshead speed of 10 mm min-1 and a gage length of 13 mm were used for the tests.
2.4.5 Differential scanning calorimetry (DSC)
Differential scanning calorimetry (DSC) experiments were carried out using a Seiko-SII Nanotechnology Inc. model Exstar 7200 equipment. Samples (ca. 7 mg) were sealed in aluminum pans and measurements were performed in nitrogen atmosphere (low rate of 40 cm3 min-1). First, samples were previously cooled at -15 0C and heated at 190 0C with a 10 0C min-1 heating rate (irst heating). Then samples were cooled down at -15 0C and submitted to heating until 190 0C (second heating).
2.4.6. Small angle X-ray scattering (SAXS)
To investigate the crystalline structure developed in the PHB different morphologies (ilm and nanoibers), two-dimensional (2-D) small-angle X-ray scattering (SAXS) measurements of synchrotron SAXS were performed using the beam line of the National Synchrotron Light Laboratory (LNLS, Campinas, Brazil). The high intensity and good collimation of the beam line have made it feasible to study the polymeric materials structural evolution through SAXS. A monochromatic beam of 1.55 Å wavelength was used and the exposure time was 300 s. The scattering intensity was registered using a Pilatus detector (300 K, 84 x 107 mm) for SAXS with a sample to detector distance of 1976.5 mm.
Table 1. ASTM properties of Biocycle 1000
Physical properties
Density 1.20 g cm-3
Melt low index 6.5 g / 10 min
Mechanical properties
Tensile strength 32 MPa
Tensile elongation at break 4%
Flexural modulus 2,200 MPa
Izod notched impact strength 28 Jm-1
Thermal properties
Melting point 170-175 0C
Heat distortion temperature 65 0C
2.4.7. Thermogravimetric analysis (TG)
The thermogravimetric analyses were performed with small dry samples weighting around 7 mg using a Seiko-SII Nanotechnology Inc. model Exstar 7200 equipment under nitrogen atmosphere (low rate of 30 cm3 min-1). Samples were heated from 25 0C to 300 0C at a 10 0C min-1 heating rate.
2.4.8. Contact angle measurement
Contact angle measurements were performed using the sessile drop technique with DIGIDROP goniometer from GBX instruments. The system is equipped with a CCD camera connected to a computer and to an automatic liquid dispenser. The contact angle was determined by placing a 10 µL drop of water on the ilm or nanoiber mat surface using a syringe and images were immediately sent via the CCD camera to the computer for analysis. The results represent an average angle between the right and left angles. Three consecutive measurements were made at room temperature, using the Surface Energy software mode, which allows direct measurement of contact angle (in degrees).
3. Results and discussion
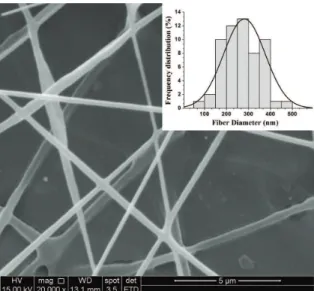
Electrospun mats of PHB ibers without beads were successful fabricated under the experimental conditions. With regards to the ibers size, the average diameter is in nanometer scale as shown in Figure 1.
Initial investigations with FTIR were concerned in detect any PHB crystalline morphology change occurred after processing viz. thermo-compression molding and electrospinning. FTIR spectra of pure as-received PHB powder, PHB ilm and PHB nanoibers mat are shown in Figure 2, in which no pronounced differences between the three spectra were observed.
Suitable infrared absorption bands can be used to study crystallinity in polymers. The infrared absorption spectra of the same polymer in the crystalline and amorphous states can differ for at least two reasons. First, speciic intermolecular interactions may exist in the crystalline polymer, which lead to sharpening or splitting of certain bands; and second, some speciic conformations may exist in one but not in the other phase, leading to bands which are characteristic exclusively of either crystalline or amorphous material8.
FTIR has been used by many authors to estimate the PHB crystallinity. Porter et al.4, for example, monitored the pure PHB crystallinity through an index (AI) calculated by the ratio between the bands at 1184 cm–1 and 1382 cm–1 intensity. According to them, when PHB is cooled from an amorphous melt at 180°C to a semi-crystalline solid at room temperature, the absorption intensity at 1184 cm–1 decreases as a function of time while the absorption intensity at 1382 cm–1 does not change during and can be taken as the reference. On the other hand, Xu et al.,9 found that the band at 1380 cm-1 changed due to crystallization of polyhydroxyalkanoates. They have preferred another index, deined as the absorbance ratio of the crystalline band at 1230 cm-1 to the unchanged reference at 1453 cm-1. The band at 1230 cm-1 was proposed as the helical chains conformational band, since no amorphous bands of the same group could be found9.
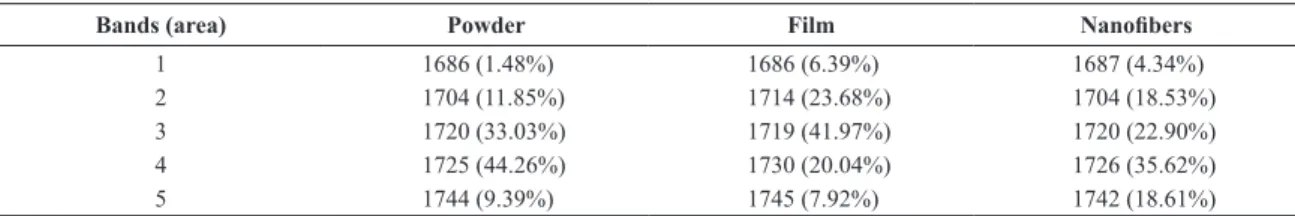
The PHB crystallization degree is most commonly investigated by monitoring the C=O stretching vibrational region10-12. For this purpose, deconvolution of the C=O stretching region was performed using a Gaussian–Lorentzian sum (R2=0.995). The bands found and their corresponding percent areas are presented in Table 2.
Zhang et al.10, during their experiments with the PHB melt-crystallization process, observed that the intensity of the band at 1722 cm-1 increased gradually as a function of time while the band at 1743 cm-1 decreased during the crystallization process. In reason of this fact, they assigned the 1722 cm-1 band to the ν (C=O) for the crystalline phase and 1743 cm-1 band to the ν (C=O) for the amorphous phase. Wang et al.11 also assigned peaks at 1721 cm-1 and 1735/1745 cm-1 to the carbonyl stretch band in crystalline and amorphous phases respectively in the FTIR spectra of PHB electrospun nanoibers.
Figure 1. SEM micrograph of electrospun PHB nanoibers mat.
(Magniication 20,000 X).
Figure 2. FTIR spectra of: (a) as-received PHB powder, (b) electrospun
The band at around 1730 cm-1 has been also ascribed as related to the crystalline part with a less ordered structure, but the assignment of such band is not clear10. The peak that appears at 1686 cm-1 has been described as a crystalline sensitive band and has been suggested to be related to the crystal defect caused by the interaction of an OH end group and a C=O group of PHB10. The assignment on the 1704 cm-1 or 1714 cm-1 band was not found in the literature, but is reasonable to speculate that this range of absorption is related to regions of well-packed chains with strong hydrogen bonds.
According to Table 2, PHB nanoibers mat presented the larger area of the band related to the amorphous phase (around 1745 cm-1). One possible theory is that, although they were collected onto a rotating collector, the speed was not suficient to stretch the ibers. For this reason, they were randomly deposited giving rise to low crystallinity ibers.
This is not in agreement with the result reported by Pachekosky et al.12. Based on the investigation of FTIR carbonyl region, they found that processing conditions caused no effect in the crystallization degree of extruded PHB ilm. However, it is worth noting that such authors did not separate the carbonyl bands. Wang et al.11, on the other hand, concluded that the ratio of A1228/A1453 seems to be more appropriate to represent the PHB ibers relative crystallinity due the absence of required bands deconvolution. In this context, the indexes calculated through the ratio A 1228/A 1453 are shown in Table 3.
The indexes found are within the range of 2.17 and 2.08 / 2.40 reported in the literature for PHB ilms and nanoibers respectively9,11. PHB ilm presented the highest crystallinity index (Table 3) and the lowest percentage area of amorphous peak (Table 2). However, in the case of PHB powder or nanoibers, the indexes found did not match with the percent areas of Table 2. Possibly this is due to the dificult deconvolution of the heavily overlapping peaks in carbonyl region.
To conirm the inluence of the processing type on the PHB crystallinity, the thermo-compression molded ilm WAXD proile was compared with that of the electrospun nanoibers mat and both are shown in Figure 3.
The proiles related to the ilm and nanoibers presented accentuated differences. As previously shown through FTIR, the ilm was suggested to be more crystalline. In the ilm proile, two strong scattering intensity peaks were detected at around 2θ=130 and 170 assigned to be (020) and (110) of orthorhombic unit cell respectively13,14. Weaker relections located at around 21.50 and 22.50 corresponding to (101) and (111) relections of α PHB crystal were also detected14. Others relections that were detected at around 260 and 270 are reported in literature as (130) and (040) respectively11.
At around 2θ=200 one can perceive a diffraction peak attributed to β form crystals11.
In terms of crystals structures of PHB, the most common PHB molecule crystal structure is the α-form, which is produced under the typical conditions of melt, cold or solution crystallization1. According to Laycock et al.1, the β-form of the PHB crystal, which can be obtained for uniaxially stretched ilms, is metastable and can be annealed back to the α-form at 130 0C with a resulting increase in crystallinity. Taking this into account, we might assume that some stretching degree occurred during the ilm processing, causing an increase in crystallinity. Nevertheless this result is not usual to be found in literature. Pinto et al.15, for example, observed a decrease in the crystallinity due to the pressure application during PHB thermo-compression molding.
In the case of nanoibers, unlike the result reported by Wang et al.11, the relection corresponding to β-form could not be perceived. The WAXD proiles showed by these authors revealed that PHB electrospun ibers possessed a small amount of β form crystals with zigzag conformation. According to them, in the electrospinning process, the interlaced chains between the crystalline lamellae are further elongated during jet whipping leading to the development
Table 2. FTIR peaks and their corresponding areas after deconvolution of carbonyl region.
Bands (area) Powder Film Nanoibers
1 1686 (1.48%) 1686 (6.39%) 1687 (4.34%)
2 1704 (11.85%) 1714 (23.68%) 1704 (18.53%)
3 1720 (33.03%) 1719 (41.97%) 1720 (22.90%)
4 1725 (44.26%) 1730 (20.04%) 1726 (35.62%)
5 1744 (9.39%) 1745 (7.92%) 1742 (18.61%)
Table 3. Absorption indexes (AI) calculated through the ratio
A 1228/A 1453.
PHB AI (A 1228/A 1453)
PHB powder 2.08
Film 2.44
Nanoibers mat 2.10
of the β-form. Likewise that in FTIR experiments, we might suppose that the speed of the rotating collector was not suficient to stretch the ibers thereby preventing the development of β-form.
From the XRD patterns, the apparent crystal size D(020) of PHB in the direction perpendicular to the 020 crystallographic plane was estimated by using Scherrer’s equation16.
cos k
D λ
β θ
= (1)
Where k is proportionality constant, λ is the X-ray wavelength (nm) and β is the enlargement of the measured diffraction line at mid-height of its maximum intensity (in radian unit), and θ is the XRD peak position. The proportionality constant k is a function of the geometrical shape of the crystal. In the case of not knowing the geometry of the crystallites, it is assumed a spherical geometry with k value of 0.9.
With this approach, the estimated average sizes of the crystals were found to be 266 Å and 190 Å for the ilm and electrospun nanoibers respectively and are consistent with the XRD patterns presented. Canetti et al.16 found larger crystal sizes (020) between 345 Å and 790 Å (setting the value of k equal to unit) for the thin ilms of PHB prepared by the solution-casting technique. As smaller the size of crystallites is, the broader diffraction peaks would be. Sometimes is dificult to recognize them as diffraction peaks. Taking this into account, the sizes of α-form crystals found through Scherrer’s equation are compatible with the diffractograms shown in Figure 4.
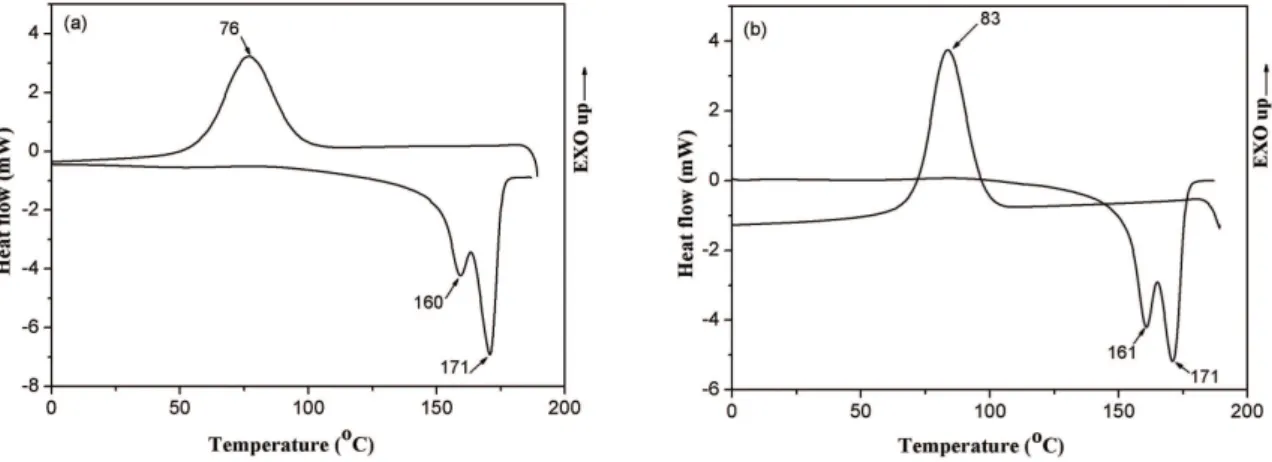
The thermal transitions of PHB thermo-compression molded ilm and nanoibers mat were determined by differential scanning calorimetry (DSC). The cooling and second heating are shown in Figure 4.
As can be seen in Figure 4, the curves look similar and the most remarkable event is the double melting peak presented in the heating curve for the two PHB forms. Fabri et al.,17 reported that most of the bimodal melting proiles are due to the concurrent phenomena of melting and recrystallization followed by inal melting at higher temperatures. According to them, this process is consequence of the crystals size distribution,
and the melting temperature is directly proportional to the crystals size. Erceg et al.,18 reported the appearance of a small shoulder before the maximum peak for PHB compression molded ilm without plasticizer when annealed at 190 0C and higher temperatures. They attributed this behavior to bimodal distribution of crystallite size resulting from changes in molecular weight due to random scission of long PHB chains, i.e. to the decrease in the molecular weight.
For polymers that melt and recrystallize during heating, like PHB, the melting temperature of original crystals can be obtained by operating at high crystallization temperatures and high heating rates19.
Other interpretation of the multiple melting has been given by Bezerra et al.20. According to them the two PA6 melting temperature peaks can be assigned to the two crystal distinct forms known in the literature as α and γ. In view of this, one might extrapolate to the PHB assigning the two melting temperature peaks to α and β crystal forms.
The crystallinity (χ) was evaluated by comparing the area of the melting peak (∆Hm) with the melting enthalpy of a 100% crystalline material (∆Hm 100%)
1 as shown in Equation 2.
% m
m H H 100
χ=∆ ∆ (2)
An estimate of the fusion heat of an ininite crystal of 3-PHB was found to be 146 Jg-1 which is the usual value used in this calculation1.
From this approach (taken from the second heating of DSC), the values found for crystallinity of PHB thermo-compression molded ilm and nanoibers mat were 53% and 55% respectively. With such results, one might suggest that the type of processing did not affect the PHB crystallinity, unlike what has been indicated by using FTIR analysis (Tables 2 and 3). However, this result disagrees with other results found in the literature. When as-received PHB powder was compared with PHB-based ibrous material, the latter displayed values of melting temperature and enthalpy slightly higher than those corresponding to the powder precursor21. Such result was attributed to the orientation of
Figure 4. Cooling and second heating curves obtained by DSC of: (a) PHB thermo-compression molded ilm and (b) PHB electrospun
macromolecular chains in the longitudinal iber direction during the electrospinning process, which may have promoted crystallization.
Regarding the results found in the DSC study, one possible explanation for the apparent discrepancy with the previous results was given by Xu et al.9. According to these authors, the crystallinity calculated from the endotherm may not be the original one due to the further crystallization, which frequently occurs in polyhydroxyalkanoates caused by the relatively slow crystallization rate.
Small-angle X-ray scattering (SAXS) is a well-established technique for probing the morphology of polymers and provides information describing structural features of the order of 10-1000 Å in size.
Figure 5 illustrates the SAXS 2D patterns of the PHB ilm and the nanoibers mat.
Isotropic ring patterns are observed in Figure 5b due to the nonwoven membrane presence22. The same ring pattern has already been observed in a light scattering from membranes and was attributed to the morphology regularity23.
In samples possessing a regular, ordered morphology, a correlation peak is observed in the SAXS intensity at a characteristic value of q (denoted by qmax), which is related to the domains separation or heterogeneities in the material24. In the simplest analysis, the scattering may be treated according to Bragg’s Law and hence:
max
2 q
d π
= (3)
Where d is the average inter-domain spacing and q is the scattering vector deined as follow:
sin 4
q π θ
λ
= (4)
Where λ is the X-ray wavelength and θ is the scattering angle.
In the case of a semicrystalline polymer possessing a lamellar morphology (such as PHB and PHB-HV), which is isotropically distributed throughout the material, the Lorentz
correction is applied to the SAXS intensity prior to the peak position determination11.
The Lorentz correction involves the intensity function multiplication by a factor of q2 and has the effect of shifting the position of a broad correlation peak to higher values of q. The Lorentz corrected SAXS proiles, constructed by plotting I (q) q2 versus q, for PHB ilm and PHB nanoibers mat are displayed in Figure 6.
At a irst glance the higher intensity of the scattering vector presented in Figure 6b suggests that PHB nanoibers mat has larger crystalline lamellae thickness and PHB ilm has higher amorphous fraction.
According to Rule, Liggat25, a simple, ideal lamellar model is used to describe certain semicrystalline polymers. The d-spacing represents the distance between adjacent crystalline lamellae which are separated by amorphous domains and arranged in space-illing stacks (Figure 7).
The d-spacing is thus equivalent to the sum of the crystalline and amorphous layer thicknesses (lc and la respectively):
c a
d= +l l (5)
An independent knowledge of the sample crystallinity degree (χ) enables both of the above parameters to be estimated, assuming the lamellar stacks to be space illing25:
c
l =χd (6)
(
)
a
l = −1 χ d (7)
The d-spacing can be estimated from Eq. 3 with qmax corresponding to the maximum of I (q) q2 versus q curves26. Scattering peaks were hardly detected for PHB ilm (Figure 6a) and PHB nanoibers mat (Figure 6b) denoting a low electron density contrast between the crystalline and amorphous phases. This dificulty had already been observed previously for polypropylene ibers obtained by electrospinning. A scattering peak was evidently detected for the aligned ibers, whereas a small shoulder or no peak was observed for the random ibers22.
In the present study, we have roughly identiied qmax values of 0.26 and 1.43 nm for PHB nanoibers and 1.39 nm for PHB ilm. The estimated values of lc and la by applying the above equations, and using the values of crystallinity degree (χ) found by DSC are displayed in Table 4.
Due to the dificulty to identify qmax on the Figure 6, the values presented in Table 4 serve as relative values in order to compare both morphologies of PHB, ilm and nanoibers. Values established for lc and la found in the literature for PHB ilms were 12-47 Å and 8-14 Å respectively16; 5.79-8.87 nm and 2.76-3.75 nm respectively27; 28.5 Å and 26.9 Å respectively28. As can be noticed, the lamellar crystals thickness was always larger than that of the amorphous layers, as we have also found.
Structural characterization based on WAXS and SAXS analyses performed by Wang et al.,29 revealed that polyethylene
terephthalate (PET) as spun ibers consisted mainly of two phases, namely, amorphous and oriented non-crystalline phase (ON), with a trace of crystalline phase. According to the authors, such ON phase is like located outside the lamellar stacks, giving rise to an insigniicant contribution to the scattering pattern. As reported by them, further heating to higher temperatures led to the gradual transformation of the ON phase to crystalline phase. It is worth to mention that ageing produces the same effect in PHB, that is, crystal perfection over time28.
Herein the ibers did not suffer annealing neither much time has passed until characterization, so probably there is still a large fraction of ON phase in the PHB nanoibers mat which giving rise to the ring pattern observed in Figure 5. In relation to PHB ilm, the secondary crystals formation, as pointed by XRD, has a small contribution to lc
27. In poly(vinylidene luoride) (PVDF)/PHB blends produced by casting neat PVDF showed a stronger scattering peak than neat PHB. This was attributed to the higher electron density contrast between the alternating crystalline and amorphous layers of PVDF (∆η=0.103 mol cm-3) compared to that of PHB (∆η=0.050 mol cm-3)30. It was mentioned a time period over which PHB was a “temporary amorphous diluent” with respect to PVDF with an extra lamellar segregation of this temporary amorphous diluent30.
Corroborating with the aforementioned temporary amorphous phase, the two melting peaks observed in the DSC experiments (Figure 4) had been explained by the presence of an amorphous-crystalline lamellar interface in as-processed PHB28. According to the proposed theory, this interface, which is still not constrained by the perfection process that characterizes ageing, is susceptible to suffer rearrangement. This rearrangement is relected in a shift of the melting peak toward higher temperatures indicating the crystalline lamellae thickening28.
In this context we might suggest that there was not enough scattering contrast in both samples in the SAXS experiments and the values shown in Table 4 are not reliable as absolute values.
The PHB thermal stability in the different forms was then investigated by TGA (Figure 8).
Thermal degradation of pure PHB occurs mainly through one step, which is characterized by a single peak on DTG curves as we found here18.
As can be noted on Figure 8, the maximum mass loss rate for PHB ilm occurred at 285 °C, while PHB-based ibrous material displayed lesser thermal stability with maximum mass loss rate at 262 °C. The values found are consistent with those found by Ramier et al.21 and could be attributed to the higher speciic surface area of the ibrous structures which was more affected by heating. According to the aforecited authors, as the heating spread by conduction within the materials, the ibers characterized by a large surface area could reach the degradation temperature faster. Hence, if the surface area seems to be the predominant factor in thermal stabilization, the results presented by TGA were inconclusive with respect to correlate the thermal stability with the two forms of PHB crystallinity.
Figure 6. Lorentz corrected SAXS proiles of: (a) PHB
thermo-compression molded ilm and (b) PHB nanoibers mat.
Figure 7. Ideal lamellar model showing d-spacing between adjacent
crystalline lamellae.
Table 4. Morphological parameters of the lamellar structure of
PHB thermo-compression molded ilm and PHB nanoibers mat.
Sample lc (Å) la (Å) d (Å)
Film 24 21 45
Nanoibers 133 108 241
24 20 44
A comparison (PHB thermo-compression molded ilm versus nanoibers mat) of the mechanical properties in tensile mode is shown in Figure 9.
The values related to PHB thermo-compression molded ilm were not in agreement with those found in the literature, especially the value of the tensile modulus (Figure 9c). PHB ilms are known to have fragile behavior with an elongation at break below 5% and an elastic modulus around 1.5 GPa5. This was attributed to the relatively high crystallinity of PHB homopolymer, and in particular the signiicant secondary crystallization that occurs post processing with age1 or by the temperature action13. According to Kurusu et al.28 it is important to know how much time has passed after the melt processing before analyzing the PHB samples. These authors controlled the post processing time and found that after 14 days the elastic modulus shifted from 0.6 to 1.5 GPa. In addition, the PHB mechanical properties are known to be dependent on the polymer composition and processing conditions, and in particular on whether or not the polymers were produced using solvent casting or melt mixing and casting1. Domínguéz-Díaz et al.31 reported elastic modulus
in the range of 850 MPa for as-cast PHB ilm prepared dissolving the polymer in chloroform and with the same molecular weight used by us.
Another example of how the processing conditions have inluenced on mechanical properties had been given by Kurusu et al.28. According to such authors, in contrast to what was already reported, annealing had a negligible or negative effect on the mechanical properties of their compositions tested, including pure PHB processed by extrusion, mixing and injection molding.
Herein, the values of tensile strength and tensile modulus for the PHB nanoibers mat are considerably lower than those of PHB ilm. This is in accordance with the literature. Fernandes et al.5, just as we did, observed that PHB nanoibers mats were fragile and they easily broke during clamping. As explained by them, since the mats are composed of many voids, is comprehensible that they are less resistant, obviously taking into account the thickness of the mats. Moreover, PHB mat in the present study was prepared from PHB dissolved in chloroform and DMF, producing a material with lower mechanical properties31.
Figure 8. TG and DTG curves of: (a) PHB thermo-compression molded ilm and (b) PHB nanoibers mat.
Figure 9. Tensile properties of PHB thermo-compression molded ilm and nanoibers mat: (a) tensile strength, (b) elongation to break
The crystallinity degree alone is effective in determining the stiffness and yield point for most crystalline polymers, and these properties are independent of molecular weight8. As a result, they can be expressed as single-valued functions of crystallinity degree. As crystallinity decreases, both stiffness and yield stress decrease8. Hence, according to the bar charts shown in Figure 9, one possible suggestion is that, at the experiment conditions, PHB ilm behaviors as more crystalline than PHB nanoibers mat. This suggestion is consistent with the results of FTIR and WAXD but goes against the indings of DSC. In this regard, we might propose that PHB nanoibers mat in fact has low crystallinity degree with a metastable amorphous state8. The raise of temperature during DSC experiment might led to the gradual transformation of the metastable amorphous phase to crystalline phase and a high value of crystallinity degree was achieved (χ = 55%). It is worth remembering that the values of lc and la (Table 4) found by SAXS were based on χ obtained by DSC, which were very close for the ilm and nanoibers mat. Hence, one might suppose is that the greater values of 133 Å and 108 Å of lc and la respectively found for the ibers (Table 4) are related to the phase change occurred during the DSC experiment.
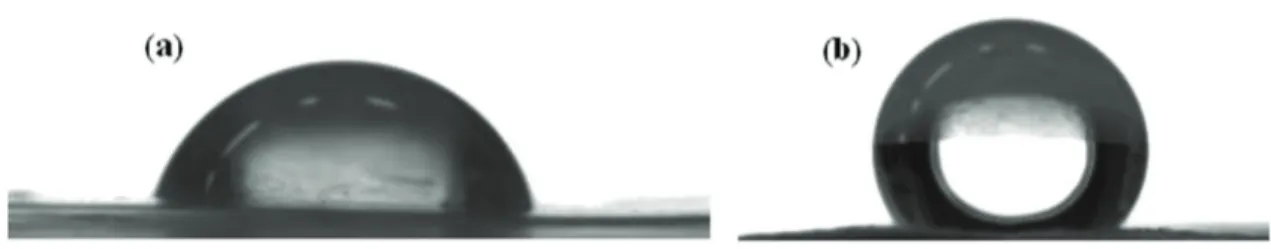
Hydrophilic / hydrophobic properties are of major importance in speciic applications. Therefore, the samples were also examined for their contact angle (Figure 10).
As can be seen in Figure 10, PHB nanoiber mat presents hydrophobic properties. Fryczkowski et al.32 found contact angle just below 90 degrees for both PHB electrospun ibers derived from 2,2,2-triluoroethanol (TFE) or chloroform solutions. On the other hand, Yang et al.33 reported contact angle of the poly(3-hydroxybutyrate-co-3-hydroxyvalerate) (PHBV) cast ilm and PHBV electrospun ilm with same concentration of 4% in chloroform of 880 and 1300 respectively.
According to them, PHBV electrospun ilm had a much higher contact angle due to its surface roughness. Ramier et al.21 reported contact angle for PHB mat on the air side and on the collector side of 120 ± 4° and 103 ± 3° respectively. According to these authors, the decrease in contact angles for the iber surface touching the collector could be related to a decrease in speciic surface areas of the irst iber layer that lattened in contact with the aluminum collector. An average contact angle equal to 80 ± 2° for PHB ilm was reported by the same authors. In general the values of contact angle found by us are in accordance with those of the literature and might be ascribed to the higher (ibers) or lower (ilm) speciic surface area.
4. Conclusion
PHB electrospun nanoibers mat was compared to PHB thermo-compression molded ilm, mainly in terms of crystallinity. FTIR and WAXD indicated that PHB thermo-compression moulding produces PHB ilm with higher crystalline degree. On the other hand, when PHB is electrospun initially its crystallinity degree is lower, but as suggested by DSC experiment, a metastable amorphous phase gradual transformation to crystalline phase occurs when temperature rises.
As a conclusion, this study indicated that when dealing with PHB, the processing conditions as well as the analyses conditions are capable of affecting the crystallinity degree and hence PHB properties.
Acknowledgements
The authors acknowledge the inancial support from Coordination of Improvement of Senior Staff (CAPES), CNPq, Fapemig and LNLS.
Figure 10. Shape of water drop on the air side of: (a) PHB ilm (θ=77.10Æ) and (b) PHB nanoibers mat (θ=130.30Æ).
References
1. Laycock B, Halley P, Pratt S, Werker A and Lant P. The chemomechanical properties of microbial polyhydroxyalkanoates.
Progress in Polymer Science. 2014; 39(3-4):536-583.
2. Bucci DZ, Tavares LB and Sell I. Biodegradation and physical evaluation of PHB packaging. Polymer Testing. 2007; 26:908-915.
3. Gredes T, Gedrange T, Hinüber C, Gelinsky M and Kunert-Keil C. Histological and molecular –biological analyses of poly (3-hydroxybuyrate) (PHB) patches for enhancement of bone regeneration. Annals of Anatomy –Anatomisher Anzeiger.
2015;199:36-42.
4. Porter MM and Yu J. Crystallization kinetics of poly(3-Hydroxybutyrate) granules in different environmental conditions.
Journal of Biomaterials and Nanobiotechnology. 2011;
2:301-310. http://dx.doi.org/10.4236/jbnb.2011.23037.
5. Fernandes JG, Correia DM, Botelho G, Padrão J, Dourado
F, Ribeiro C, et al. PHB-PEO electrospun fiber membranes
containing chlorhexidine for drug delivery applications. Polymer Testing. 2014; 34:64-71.
6. Veleirinho B, Ribeiro-do-Valle RM and Lopes-da-Silva JA. Processing conditions and characterization of novel electrospun poly (3-hydroxybutyrate-co-hydroxyvalerate)/chitosan blend fibers. Materials Letters. 2011; 65(14):2216-2219. http://dx.doi.
7. Nagiah N, Madhavi L, Anitha R, Anandan C, Srinivasan NT and Sivagnanam UT. Development and characterization of coaxially electrospun gelatin coated poly (3-hydroxybutyric acid) thin films as potential scaffolds for skin regeneration.
Materials Science and Engineering C. 2013; 33(7):4444-4452.
8. Billmeyer FW Jr. Textbook of polymer Science. 2nd ed. New York: John Wiley and Sons; 1971. p. 110, 216, 235.
9. Xu J, Guo BH, Yang R, Wu Q, Chen GQ and Zhang QM. In situ
FTIR study on melting and crystallization of polyhydroxyalkanoates.
Polymer. 2002; 43:6893-6899.
10. Zhang J, Sato H, Noda I and Ozaki Y. Conformation rearrangement and molecular dynamics of poly(3-hydroxybutyrate) during the melt-crystallization process investigated by infrared and two-dimensional infrared correlation spectroscopy. Macromolecules. 2005; 38:4274-4281.
11. Wang C, Hsu CH and Hwang IH. Scaling laws and internal structure for characterizing electrospun poly[(R)-3-hydroxybutyrate] fibers. Polymer. 2008; 49(19):4188-4195.
12. Pachekoski WM, Dalmolin C and Agnelli JAM. The influence of the industrial processing on the degradation of poly(hidroxybutyrate) - PHB. Materials Research. 2013; 16(2):327-332.
13. Zhijiang C, Chengwei H and Guang Y. Crystallization behavior,
thermal property and biodegradation of poly(3-hydroxybutyrate)/ poly(ethylene glycol) grafting copolymer. Polymer Degradation & Stability. 2011; 96:1602-1609.
14. Sun X, Guo L, Sato H, Ozaki Y, Yan S and Takahashi I. A study on the crystallization behavior of poly(β-hydroxybutyrate) thin
films on si wafers. Polymer. 2011; 52:3865-3870.
15. Pinto CE, Arizaga GG, Wypych F, Ramos LF and Satyanarayana
KG. Studies of the effect of molding pressure and incorporation of sugarcane bagasse fibers on the structure and properties of poly (hydroxy butyrate. Composites. Part A, Applied Science
and Manufacturing. 2009; 40:573-582.
16. Canetti M, Urso M and Sadocco P. Influence of the morphology and of the supermolecular structure on the enzymatic degradation of bacterial poly(3-hydroxybutyrate). Polymer. 1999; 40(10):2587-2594.
17. Fabri D, Guan J and Cesàro A. Crystallisation and melting behaviour of poly (3-hydroxybutyrate) in dilute solution: towards an understanding of physical gels. Thermochimica Acta. 1998; 321(1-2):3-16.
18. Erceg M, Kovcic T and Klavic I. Thermal degradation of
poly(3-hydroxybutyrate) plasticized with acetyl tributyl citrate.
Polymer Degradation & Stability. 2005; 90:313-318.
19. Righetti MC and Di Lorenzo ML. Melting temperature evolution of non-reorganized crystals. Poly(3-hydroxybutyrate).
Thermochimica Acta. 2011; 512(1):59-66. http://dx.doi.
org/10.1016/j.tca.2010.08.023.
20. Bezerra EB, Leite AM, Araújo EM and Mélo TJ. Obtenção e caracterização de membranas obtidas a partir de blendas
poliméricas de poliamida. Polímeros. 2014; 24(3):381-387.
21. Ramier J, Bouderlique T, Stoilova O, Manolova N, Rashkov I, Langlois V, et al. Biocomposite scaffolds based on electrospun poly(3-hydroxybutyrate) nanofibers and electrosprayed
hydroxyapatite nanoparticles for bone tissue engineering applications. Materials Science and Engineering C. 2014; 38:161-169.
22. Jao CS, Wang Y and Wang C. Novel elastic nanofibers of syndiotactic polypropylene obtained from electrospinning.
European Polymer Journal. 2014; 54:181-189.
23. Umaña E, Ougizawa T and Inoue T. Preparation of new membranes
by complex formation of itaconic acid–acrylamide copolymer with polyvinylpyrrolidone: studies on gelation mechanism by light scattering. Journal of Membrane Science. 1999; 157:85-96.
24. Chang SL, Yu TL, Huang CC, Chen WC, Linilu K and Lin
TL. Effect of polyester side-chains on the phase segregation
of polyurethanes using small-angle X-ray scattering. Polymer.
1998; 39(15):3479-3489.
25. Rule RJ and Liggat JJ. Time-resolved synchrotron small angle
X-ray scattering studies of hydroxybutyrate) and
poly(3-hydroxybutyrate-co-3-hydroxyvalerate) polymers. Polymer. 1995; 36(20):3831-3840.
26. Patrício PS, Pereira IM, Silva NC, Ayres E, Pereira FV
and Oréfice RL. Tailoring the morphology and properties of waterborne polyurethanes by the procedure of cellulose naocrystal incorporation (5658). European Polymer Journal. 2013; 49(12):3761-3769.
27. Heo K, Yoon J, Jin KS, Kim G, Sato H, Ozaki Y, et al. Synchrotron
X-ray scattering studies on the structural evolution of microbial
poly(3-hydroxybutyrate). Journal of Applied Crystallography. 2007; 40:s594-s598.
28. Kurusu RS, Siliki CA, David É, Demarquette NR, Gauthier C, Chenal JM. Incorporation of Plasticizers in sugarcane-based poly(3-hydrixybutyrate) (PHB): Changes in microstructure and properties through ageing and annealing. Industrial Crops and Products. 2015; 72:166-174.
29. Wang C, Lee MF and Jao CH. Phase transition of poly(ethylene terephthalate) in nanofibers electrospun from phenol-based solution. European Polymer Journal. 2014; 52:127-136.
30. Chiu HJ, Chen HL and Lin JS. Crystallization induced microstructure of crystalline/crystalline poly(vinylidenefluoride)/
poly(3-hydroxybutyrate) blends probed by small angle X-ray
scattering. Polymer. 2001; 42(13):5749-5754.
31. Domínguez-Díaz M, Meneses-Acosta A, Romo-Uribe A, Peña
C, Segura D and Espin G. Thermo-mechanical properties, microstructure and biocompatibility in poly-β-hydroxybutyrates
(PHB) produced by OP and OPN strains of Azotobacter vinelandii. European Polymer Journal. 2015; 63:101-112.
32. Fryczkowski R, Gorczowska M, Fryczkowska B and Janicki J. The effect of solvent on the properties of nanofibers obtained by electrospinning from a mixture of poly(3-hydroxybutyrate) and polyaniline. Synthetic Metals. 2013; 166:14-21.
33. Yang D, Zhang J, Xue J, Nie J and Zhang Z. Electrospinning