Abstract— This work shows the experimental validation of a method developed for determining the strain profile applied to a fiber Bragg grating by solving the inverse scattering problem. The non-uniform strain profile is recovered by formulating an optimization problem, solved with an algorithm based on differential evolution. The method has proved to be able of recovering the shape and approximate amplitude of the actual strain profile applied to the FBG, opening new perspectives for optical sensing with fiber Bragg gratings.
Index Terms— Computational Intelligence, Differential Evolution, Fiber Bragg Gratings, Optical Sensors, Strain Sensing.
I. INTRODUCTION
Nowadays, fiber Bragg gratings (FBGs) are widely used in strain and temperature sensing
systems [1]. The FBG consists of a periodic refractive index modulation, usually produced in the core
of an optical fiber by the incidence of a UV-laser interference pattern. FBGs operate as selective
mirrors, back-reflecting those wavelengths of the light propagating in the fiber core that satisfy the
Bragg condition. Mechanical deformations and changes in temperature affect the FBG periodicity and
the refractive index modulation, changing the Bragg condition and, consequently, the FBG reflection
spectrum. Spectral shifts of the FBG resonance are the basis for the device operation as sensor. Most
techniques of interrogation are based on algorithms used to detect the peak position of the FBG
resonance [2],[3]. This strategy allows, e.g., punctual or quasi-distributed sensing of strain and
temperature [1], [4]-[6] if the spectral wavelength shifts result from a uniform FBG deformation or a
temperature change that affects the whole grating. Nevertheless, a non-uniform profile of strain or
temperature results in additional spectral alterations such as broadening, splitting and asymmetrical
shifts of the FBG resonance [7]. Such spectral features are usually detrimental for the sensor operation
in most of the cases, but may become an asset if properly addressed. A non-uniform profile of strain
or temperature applied to the FBG can be recovered by solving the inverse scattering problem,
allowing multi-point monitoring with a single FBG in a distributed sensing configuration. This
approach can benefit quasi-distributed sensing systems, leading to a reduction in the number of
sensors and to an improvement in the sensor resolution.
Solving the inverse scattering problem with
differential evolution: an experimental
validation
Lucas H. Negri1, Aleksander S. Paterno2, Marcelo A. Pedroso3, Marcia Muller3 and José Luís Fabris3
1
Federal Institute of Education, Science and Technology of Mato Grosso do Sul, Aquidauana, MS, Brazil e-mail: [email protected]
2
Santa Catarina State University, Joinville, SC, Brazil email: [email protected] 3
Different methods have been proposed in the literature to solve the inverse scattering problem,
which consists in determining, from the analysis of the reflection spectrum, alterations in the
structural parameters of a perturbed FBG [8]. These methods deal with specific situations in which
monotonic strain profiles [9], information about the phase of the FBG spectrum [8], [10], [11], or
even multiple FBGs [12] are required. In another work, an optimization algorithm is proposed to
recover FBG parameters, in which a known strain profile is required as input to enhance the design
sensitivity [13].
In this paper, the main contribution is the experimental validation of a method based on differential
evolution and regularization, previously implemented and evaluated using simulations [14]. For this
purpose, the approach was applied for determining the non-uniform strain profiles applied to an FBG.
The structural parameters were recovered providing the successfully experimental validation of the
method.
II. METHODOLOGY
A. Determination of the Strain Profile
Alterations are expected in the reflection spectrum of an FBG subjected to a mechanical
deformation along the fiber length. Spectral changes are related to modifications in both grating pitch
Λ and mean value of the core refractive index due to the photoelastic effect [7]. For a uniform FBG, these parameters depend on the applied strain ɛ, according to (1) and (2):
(1)
(2)
where l is the fiber length, p11 and p12 are the fiber photoelastic coefficients and v is the Poisson
coefficient of the silica [7].
Differential evolution, used to solve the inverse scattering problem, allows determining the
unknown strain profile applied to the FBG by using characteristics of the unstrained grating as well as
possible apodization parameters. Among these characteristics are the amplitude and periodicity of the
refractive index modulation and the grating length. The algorithm simulates the FBG reflection
spectrum by means of the transfer-matrix method, seeking for a solution that best matches the
spectrum experimentally obtained. Additionally, due to the ambiguity resulting from the lack of phase
information, regularization methods are used to obtain the convergence for the simplest solution.
For the experimental validation of the method, the FBG subjected to an unknown strain profile is
considered as composed of (N = 10) different sections uniformly strained. A population of 40
candidate solutions is evolved using the adaptive method JADE [15]. Each one of the candidate
solutions contains 10 characteristic parameters of the strain applied to the (N = 10) sections. The
candidate solution with the largest fitness value is then selected. The number of sections can be
chosen according to the application to obtain the required resolution. Nevertheless, as this number
For a candidate solution, the fitness calculation begins by the application of the corresponding strain
profile. The parameters of each FBG section are introduced into (1) and (2) for Λ and , respectively.
The range of strain was established from 0 to 2.5 mε based on typical values found in literature
[7], [12]. Then, the FBG reflection spectrum is calculated and compared with the one experimentally
measured. The mean absolute error is used as metric in the comparison. After the random generation
of the initial population, the evolutionary process took 300 iterations. As discussed in previous works
[7], [12], if the information about the phase is missing, a number of different strain profiles can be
recovered from the same reflection spectrum. Nevertheless, this drawback can be avoided by adding
two terms of regularization. The first one subtracts the norm L1 of the solution (L1, multiplied by a
coefficient Cl1) from the fitness, providing solutions preferentially close to 0. The second one
subtracts the total variation of the solution (TV multiplied by a coefficient CTV) from the fitness. The
norm L1 and the total variation TV of a candidate solution are obtained from the qi terms according to:
(3)
(4)
The regularization technique works by favoring smooth/simple strain profiles over
rough/complicated ones. A similar approach is usually employed for the FBG design to avoid
refractive index profiles that are hard to fabricate and/or optimize [16].
B. Experimental Setup
In order to produce a non-uniform longitudinal deformation along the FBG, only a portion of the
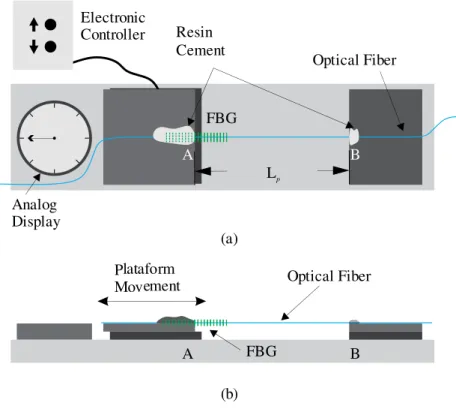
grating corresponding to approximately half of its total length was strained. A diagram of the
experimental setup is shown in Fig. 1.
The fiber section with the FBG was fixed with self-adhesive resin cement (3M, RelyX U200) to the
moving (A) and fixed (B) parts of the experimental apparatus. About the first half of the grating was
fastened to the linear translation stage in A. Then, the fiber containing the free portion of the FBG was
attached to the fix platform in B at a distance Lp from A. With this setup, the fiber segment with
length Lp that contains the FBG free portion can be submitted to longitudinal elongations.
The FBG with Bragg wavelength λB at 1534 nm was produced at the Photorefractive Devices Unit
of the Federal University of Technology - PR in a standard single mode fiber by the direct
illumination of a phase mask [17]. In the recording setup, the FBG with length l of 8.00 mm was
written by scanning the laser beam (KrF, Xantos XS-Coherent, 248 nm) along the phase mask (10
mm long, pitch of 1060 nm).
The fiber segment with initial length Lp of 106.1 mm, localized between points A and B indicated in
Fig. 1, was successively stretched in steps of 0.05 mm up to a total elongation ΔL of 0.20 mm. The
Fig. 1. Schematic diagram of the experimental setup:(a) top view and (b) side view. Elements in the diagram are out of scale.
FBG spectrum was recorded after each step by an optical spectrum analyzer (Anritsu MS9710B,
resolution of 0.1 nm, 1001 samples, 50 acquisitions per sample). The FBG reflection spectrum for the
initial fiber length Lp was taken as reference. Experiments were carried out at a controlled temperature
of (22.0 ± 0.5) °C to avoid the influence of temperature changes in the FBG response due to the
grating cross-sensitivity to both parameters, temperature and longitudinal strain.
As resin cements shrinks during its polymerization, half of the FBG is already strained at the initial
conditions of the experiment. Therefore, the reference spectrum carries information about a
permanent deformation, which is further considered for the determination of the strain profiles.
Once the experimental setup was ready for use, the method was first applied to determine the FBG
initial parameters shown in Table I by using the reference spectrum.
TABLE I. FBG INITIAL PARAMETERS.
Parameter Value
l 8.00 mm 526.474 nm Δn 41.505 x 10⁻⁶
After being submitted to consecutive elongations, the recorded FBG spectral data were used to
reconstruct the applied strain profiles. The coefficients Cl1= 0.1 and CTV = 5.0 of the regularization
terms were experimentally determined by using a distinct data set.
Analog Display
A B
Lp
Resin Cement
FBG
Optical Fiber Electronic
Controller
(a)
A B
Plataform
Movement Optical Fiber
FBG
III. RESULTS
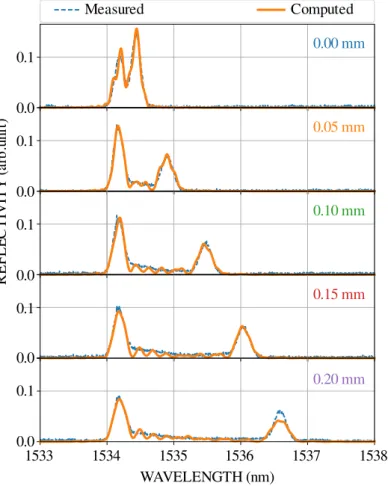
Fig. 2 shows a comparison between the FBG experimental (blue dashed lines) and simulated
(orange continuous lines) reflection spectra obtained for the grating under the initial conditions and
submitted to elongations ΔL of 0.05, 0.10, 0.15 and 0.20 mm. As previously discussed, resin cement
shrinks during the polymerization resulting in the optical fiber contraction. Consequently, Bragg
resonance splits in two peaks that are present even in the FBG reference spectrum (unstrained fiber),
corresponding to the Bragg wavelengths of FBG bonded and free portions.
Fig. 2. Experimental (blue dashed line) and simulated (orange continuous line) reflection spectra obtained for the FBG under different strain conditions.
The parameters shown in Table I correspond to the FBG at the initial conditions and were
calculated assuming p11 = 0.113, p12 = 0.252, v = 0.160 and = 1.457. As the fiber elongation takes
place, the resonance of the free portion is red-shifted while the resonance related to the bonded
portion remains at the same spectral position. Besides, spectra exhibit a broad band of reflection with
lower intensity superposed to the two main resonances, an indicative of a non-uniform strain profile.
On the basis of the used experimental setup, an approximate step-strain profile is expected as about
half of the FBG was bonded and cannot be further deformed.
As can be seen from the graphs, the FBG spectra are efficiently estimated by the method based on
differential evolution. Small divergences, which do not impair the result, are present only in the
spectral range between the two main peaks. These differences result from the OSA resolution and the
Computed Measured
WAVELENGTH (nm)
R
E
F
L
E
C
T
IV
IT
Y
(
a
rb
.u
n
it
)
0.00 mm
0.05 mm
0.10 mm
0.15 mm
0.20 mm
0.1
0.0
0.1
0.0
0.1
0.0
0.1
0.0
0.1
0.0
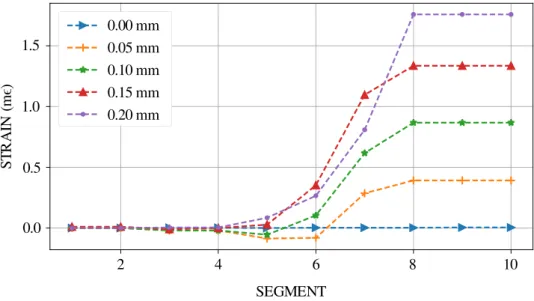
chosen reduced number of FBG regions considered for the simulations. Curves of Fig. 3 depict the
reconstructed strain profiles applied to the FBG when the fiber is lengthened. Each one of the 10 FBG
sections is subjected to a different strain determined by the method.
Fig. 3. FBG strain profiles reconstructed by the proposed method.
Table II presents the determined strain values as well as the expected strain obtained by the relation
between the fiber elongation ΔL and the initial length Lp. As previously discussed, the strain values in
Table II were determined by considering the reference spectrum of the FBG obtained with half of the
grating pre-strained due to the resin cement contraction.
TABLE II. STRAIN DETERMINED BY THE METHOD FOR EACH ONE OF THE 10 FBG SECTIONS AND THE EXPECTED STRAIN OBTAINED
BY THE RATIO BETWEEN THE ELONGATION ∆L AND THE INITIAL LENGTH LP.
Computed Strain (mɛ)
Expected Strain (mɛ) Fiber section
L (mm)
1 2 3 4 5 6 7 8 9 10
0.00 0.00 0.00 0.00 0.00 0.00 0.00 0.00 0.00 0.00 0.00 0.00 0.05 0.00 0.00 -0.02 -0.02 -0.09 -0.08 0.29 0.39 0.39 0.39 0.47 0.10 0.00 0.00 -0.02 -0.02 -0.05 0.10 0.62 0.87 0.87 0.87 0.94 0.15 0.01 0.01 -0.01 0.00 0.03 0.35 1.10 1.34 1.34 1.34 1.41 0.20 0.00 0.00 0.00 0.00 0.08 0.27 0.81 1.76 1.76 1.76 1.89
By comparing the expected values of strain with the corresponding maximum values recovered by
the method, relative changes from approximately 5% for an elongation of 0.15 mm up to 17 % for an
elongation of 0.05 mm were obtained.
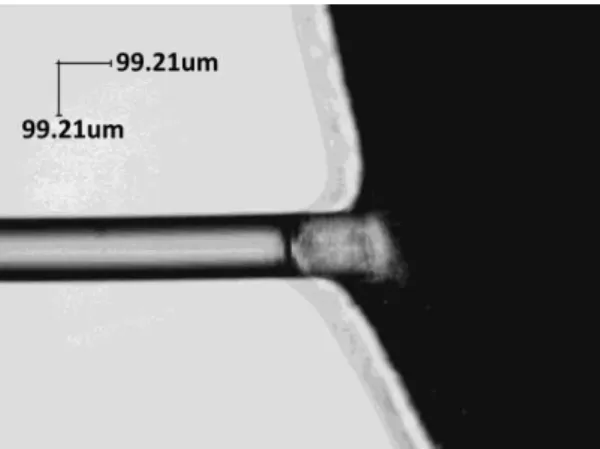
As shown in Fig. 4, the reconstructed strain profile has a smooth transition between the free and
attached regions. This result is expected both by the existence of a soft transition in the bonded region
(as depicted in Fig. 4), that would prevent an abrupt change in the strain profile, as well as by the
usage of regularization terms in the optimization algorithm.
S
T
R
A
IN
(
m
)
ϵ
SEGMENT
2 4 6 8 10
1.5
1.0
0.5
0.0
Fig. 4.Microscope image (top view) showing a soft transition between the FBG free and bonded sections.
IV. CONCLUSION
The method based on differential evolution and regularization proposed in [14] was experimentally
validated, providing an efficient reconstruction of strain profiles applied to an FBG. By recovering
both the shape and amplitude of the strain profile using only the magnitude of the FBG reflection
spectrum as input, the method allows FBGs application in distributed sensing.
ACKNOWLEDGMENT
The authors would like to thank the financial support obtained from the Brazilian Agencies:
CAPES, CNPq, FINEP and Fundação Araucária.
REFERENCES
[1] A. D. Kersey, M. Davis, H. Patrick, M. LeBlanc, K. Koo, C. Askins, M. Putnam, and E. Friebele, “Fiber grating sensors,” Journal of Lightwave Technology, vol. 15, no. 8, pp. 1442-1463, 1997.
[2] L. Negri, A. Nied, H. Kalinowski, and A. Paterno, “Benchmark for Peak Detection Algorithms in Fiber Bragg Grating Interrogation and a New Neural Network for its Performance Improvement,” Sensors, vol. 11, no. 12, pp. 3466-3482, 2011.
[3] D. Tosi, M. Olivero, and G. Perrone, “Performance analysis of peak tracking techniques for fiber Bragg grating interrogation systems,” Journal of Microwaves, Optoelectronics and Electromagnetic Applications, vol. 11, pp. 252-262, 2012.
[4] Y.-J. Rao, “In-fibre Bragg grating sensors,” Meas. Sci. Technol., vol. 8, n. 4, pp. 355-375, 1997.
[5] N. Hirayama, Y. Sano, “Fiber Bragg grating temperature sensor for practical use,” ISA Trans., vol. 39, no. 2, pp. 169-173, 2000.
[6] J.-S. Heo, J.-H. Chung, and J.-J. Lee, “Tactile sensor arrays using fiber Bragg grating sensors,” Sensors Actuators A Phys., vol. 126, no. 2, pp. 312-327, 2006.
[7] S. Huang, M. Leblanc, M. M. Ohn, and R. M. Measures, “Bragg intragrating structural sensing,” Applied Optics, vol. 34, no. 22, pp. 5003-5009, 1995.
[8] J. Skaar and R. Feced, “Reconstruction of gratings from noisy reflection data,” Journal of the Optical Society of America. A: Optics and Image Science, and Vision, vol. 19, no. 11, pp. 2229-2237, 2002.
[9] M. Leblanc, S. Y. Huang, M. Ohn, R. M. Measures, A. Guemes, and A. Othonos, “Distributed strain measurement based on a fiber Bragg grating and its reflection spectrum analysis,” Optics Letters, vol. 21, no. 17, pp. 1405-1407, 1996.
[10]M. Ohn, S. Huang, R. Measures, and J. Chwang, “Arbitrary strain profile measurement within fibre gratings using interferometric Fourier transform technique,” Electronics Letters, vol. 33, no. 14, pp. 1242-1243, 1997.
[11]M. A. Muriel, J. Azaña, and A. Carballar, “Fiber grating synthesis by use of time-frequency representations,” Optics Letters, vol. 23, no. 19, pp. 1526-1528, 1998.
[12]H.-C. Cheng and Y.-L. Lo, “Arbitrary strain distribution measurement using a genetic algorithm approach and two fiber Bragg grating intensity spectra,” Optics Communications, vol. 239, no. 4-6, pp. 323-332, 2004.
[14]L. H. Negri, H. S. Lopes, M. Muller, J. L. Fabris, and A. S. Paterno, “An efficient method to determine strain profiles on FBGs by using differential evolution and GPU,” in 2015 Latin America Congress on Computational Intelligence (LA-CCI), pp. 1-6, 2015.
[15] J. Zhang and A. C. Sanderson, “JADE: Adaptive Differential Evolution with Optional External Archive,” IEEE Trans. Evol. Comput., vol. 13, no. 5, pp. 945-958, 2009.
[16] M. J. D. Sousa, J. C. W. A. Costa, R. M. D. Souza, and R. V. M. P. Pantoja, “FBG optimization using spline encoded evolution strategy,” Journal of Microwaves, Optoelectronics and Electromagnetic Applications, vol. 10, pp. 165 - 178, 2011.