A
DÉLAB
ĚLÁČKOVÁE
VALUATION OF THE RESERVE EFFECT IN A MARINE
PROTECTED AREA IN
S
AGRES
(PNSACV)
Mestrado em Biologia Marinha
Trabalho efetuado sob a orientação de:Barbara Horta e Costa (CCMAR, UAlg) e Prof. Jorge Gonçalves (CCMAR, UAlg)
ii
Declaração de autoria de trabalho:
Eu, Adéla Běláčková, declaro de ser a autora deste trabalho de tese de mestrado: ‘Evaluation of the reserve effect in a marine protected area in Sagres (PNSACV)’, que é original e inédito. Autores e trabalhos consultados estão devidamente citados no texto e constam da listagem de referências incluída.
Declaração de copyright:
A Universidade do Algarve reserva para si o direito, em conformidade com o disposto no Código do Direito de Autor e dos Direitos Conexos, de arquivar, reproduzir e publicar a obra, independentemente do meio utilizado, bem como de a divulgar através de repositórios científicos e de admitir a sua cópia e distribuição para fins meramente educacionais ou de investigação e não comerciais, conquanto seja dado o devido crédito ao autor e editor respetivos.
iii
Acknowledgements
I would like to thank my supervisors Barbara Horta e Costa e Prof. Jorge Gonçalves for their advices, support, patience and kindness throughout the development of this thesis, as well as for the opportunity they granted me to become part of the MARSW project, in scope of which this thesis was made possible. I would also like to thank Diogo Paulo and CCMAR Scientific Dive Center for the training, guidance and help with fieldwork diving surveys and for the equipment support. My thanks also go to Algarve Dolphin Lovers, Lda for their cooperation in terms of boat logistics, Isidoro Costa for help with baited cameras deployment, Thomas Riedinger for help with field sampling and long hours spend with stereo-video analysis, and Nuno Sales Henriques, Carolina Mourato and Nick Coertze for their help in field sampling.
The thesis was cofinanced by MARSW project and CCMAR/FCT/UID/Multi/04326/2019. Diving equipment and part of diving logistics were financed by CCMAR Scientific Dive Center.
iv
Abstract
Marine Protected Areas (MPAs), especially when set up as marine reserves, have been found beneficial for fish communities and species worldwide. Evaluation of MPA effects needs to be done to understand whether existing protection measures are efficient or not. To detect potential protection effect, we aimed to assess differences in demersal fish and commercial invertebrate community at Ilhotes do Martinhal marine reserve. Based on a comparison between locations situated inside and outside the reserve, differences in richness, abundance, length and biomass were analysed at community and species level. The influence of physical habitat was investigated, as it could get confounded with protection effect. In addition, we wanted to validate the results from Stereo Baited Remote Underwater Video (SBRUV) by another method, being Stereo Diver Operated Video (SDOV). Comparison between methods performance and costs was held to decide on the more efficient monitoring tool. SBRUV results suggest that the marine reserve provides positive effects, especially as it sustains greater biomass of target species and target species above minimum landing size. The reserve was found beneficial for Diplodus sargus, a valuable commercial, and Labrus bergylta, a by-catch species. However, two species showed an opposite pattern, indicating negative protection effect or influence of other habitat characteristics rather than physical complexity. Furthermore, SBRUV results for abundance were non-conclusive of differences, probably due to a delayed response. SDOV showed no signs of positive protection effects, with some results complementary while other contradictory to SBRUV’s ones. This was attributed to the differences in community sampled, reflecting diver and bait effects. As illegal fishing gear was encountered inside the reserve, legal enforcement and active management might play a key role in future reserve success. This study is especially relevant for further monitoring and revaluation of protection measures and zonation of Ilhotes de Martinhal.
Keywords: marine protected areas, reserve effect, stereo baited cameras, diver-operated
v
Sumário Executivo
As Áreas Marinhas Protegidas (AMPs) são consideradas uma ferramenta de conservação de meio marinho que tem como objetivo principal a proteção de habitats, de ecossistemas e da biodiversidade. Além disso, as AMPs podem promover a pesca sustentável e a recuperação de recursos de pesca. Especialmente quando designadas como reservas marinhas, onde todas as atividades extrativas são proibidas, as AMPs tem sido benéficas para comunidades e espécies de peixes. Os efeitos positivos geralmente associados a AMPs são o aumento de riqueza de espécies, de densidades, de tamanhos e de biomassa de peixes e invertebrados. Para avaliar os efeitos de medidas de proteção, idealmente, são realizadas comparações de dados de antes e de depois da sua implementação. Na ausência de dados anteriores à implementação de uma AMP, uma comparação entre locais com proteção (impacto) e sem proteção (controle) pode usar-se, tendo em conta a influência de habitat que pode confundir-se com efeitos de proteção. Neste estudo, foi comparada a comunidade de peixes demersais e invertebrados comerciais dentro e fora de uma reserva marinha dos Ilhotes do Martinhal em Sagres. Esta zona foi estabelecida em 2011 como área de proteção parcial I (a única atividade extrativa permitida é a apanha de percebe nas arribas da costa por pescadores comerciais, sendo considerada reserva marinha para o subtidal) integrante no Parque Marinho do Parque Natural do Sudoeste Alentejano e Costa Vicentina (PNSACV). Como os dados comparáveis anteriores à implementação da reserva não estavam disponíveis, os dados sobre a comunidade de peixes demersais e invertebrados comerciais foram comparados entre locais da reserva e locais adjacentes (zona complementar ou ‘buffer’) com substrato rochoso. A influência da complexidade física de habitat rochoso foi também considerada na análise porque os efeitos de reserva podem confundir-se com efeitos de habitat. As diferenças na riqueza de espécies foram investigadas. Em relação à abundância e biomassa, as diferenças foram analisadas por grupos de espécies (espécies demersais, espécies comerciais, espécies comerciais acima de tamanho mínimo legal (TML) e abaixo de TML, espécies sem interesse comercial). Ao lado da abundança e da biomassa, as diferenças de tamanhos foram também examinadas nas espécies individuais mais abundantes: comerciais (Diplodus sargus e Diplodus vulgaris) e sem interesse comercial (Coris julis, Serranus cabrilla,
Labrus bergylta).
Dois métodos estéreo-vídeo de recolha de dados foram usados: as Câmaras Iscadas Estéreo (SBRUV) e o Vídeo Estéreo por Mergulho (SDOV). Estes métodos apresentam uma alternativa ao Censo Visual por Mergulho (UVC) que é o método o mais usado em monitorização de AMPs. Os dois métodos estéreo-vídeo também são de caracter não destrutivo, e por isso podem
vi
ser preferíveis a uma monitorização de reservas marinhas quando comparados com as artes de pesca. Os dois métodos permitem estimar tamanhos de organismos mais precisos que os estimados por observações directas em UVC e também oferecem uma gravação permanente que pode ser vista por múltiplos observadores no laboratório. Assim, o erro ligado ao observador é reduzido quando comparado ao UVC. Dado a presença de isco, as SBRUVs servem como ponto de atração para peixes e como resultado, este método é considerado eficiente para a amostragem de riqueza de espécies de peixes, e particularmente de peixes carnívoros de tamanhos grandes.
Os resultados de amostragem com SBRUV sugerem que existem efeitos positivos dentro da reserva, visto ter-se encontrado uma maior riqueza e uma maior biomassa da comunidade de peixes demersais e de invertebrados comerciais dentro da reserva em relação à zona adjacente. Principalmente, a biomassa de espécies comerciais e de espécies comerciais acima de TML, os dois grupos que se espera que respondam mais à exclusão de pesca, foi mais alta dentro que fora da reserva. Os resultados sugerem que a espécie D. sargus, uma das principais espécies alvo nesta região, terá beneficiado da proteção em termos de tamanhos e de biomassa. A abundância e a biomassa de L. bergylta, que é uma de espécie de tamanho grande, mas que é capturada de forma acessória, também foram significativamente maiores dentro da reserva em comparação com zona adjacente. No entanto, Diplodus vulgaris (também de interesse comercial) e S. cabrilla (sem ou de baixo interesse comercial) parecem mais associados aos locais fora da reserva, sugerindo uma resposta negativa à proteção. Os resultados negativos nestas espécies podem também estar ligados a características do habitat sem ser a complexidade física. Neste estudo, não se encontraram diferenças significativas entre a complexidade física de habitats dentro e fora da reserva, nem interações significativas entre proteção e habitat. No entanto, algumas espécies apresentaram uma maior afinidade aos habitats de menor (D. sargus) ou de maior complexidade física (D. vulgaris abaixo de TML).
Apesar dos resultados significativos para a biomassa, os resultados da abundância de peixes e invertebrados não revelaram diferenças suficientes para apoiar os efeitos positivos de proteção. No geral, os tamanhos e a biomassa fornecem uma resposta mais rápida relativamente as medidas de proteção, resultando diretamente da eliminação da pesca que selecciona os indivíduos de tamanhos maiores. Os efeitos em abundância podem precisar de mais anos de proteção para serem reconhecidos, devido à variabilidade de fatores ambientais que afetam o sucesso de recrutamento em organismos marinhos. Os resultados da abundância podem também ter uma ligação com a pesca ilegal, visto que artes de pesca ilegais (covos) foram encontradas repetidamente dentro da reserva. Neste contexto, a implementação de uma gestão ativa, baseada
vii
na participação da comunidade local, na fiscalização e na monitorização ao prazo longo será fundamental para segurar o sucesso da reserva no futuro.
Em relação à comparação entre os dois métodos, o SBRUV mostrou-se eficiente para monitorização, visto que este método permitiu a deteção de eventuais efeitos de reserva em riqueza e em biomassa. Os resultados de SDOV não mostraram diferenças entre níveis de proteção que sugerissem efeitos positivos de reserva. Contudo, os resultados do SDOV validaram os resultados de SBRUV ao terem também detetado que os adultos de D. vulgaris preferiam os locais da parte oeste fora da reserva em comparação com os locais dentro da reserva. Ao contrário e como resultado complementar ao SBRUV, o SDOV revelou que, na reserva, foi observada uma maior proporção de juvenis desta espécie que nos locais adjacentes. Estes resultados sugerem que os indivíduos de D. vulgaris partem da reserva quando adultos. Relativamente a comunidade amostrada, o SDOV amostrou as espécies mais comuns e conspícuas (por exemplo D. vulgaris) com sucesso, mas já não foi eficaz na amostragem de espécies mais crípticas (por exemplo Symphodus spp. ou S. cabrilla). No total, o SDOV forneceu uma riqueza de espécies menor quando comparado ao SBRUV. Estes resultados podem ser explicados pelos efeitos negativos da presença de um mergulhador no comportamento de algumas espécies de peixes, em combinação com a visibilidade da água, um outro fator limitante, que influencia mais a deteção do SDOV que do SBRUV. De outro lado, a presença de isco no SBRUV permitiu atrair mais espécies, incuindo os de tamanhos grandes, para perto das câmaras, resultando numa maior riqueza e biomassa. Além destes resultados, o SDOV apresentou custos mais altos que SBRUV, devido à possibilidade de obter um número maior de amostras de SBRUV por dia. Uma comparação com UVC ainda tem que ser considerada para selecionar o melhor método não extrativo para monitorização. O UVC tem um potencial de amostrar uma comunidade de peixes mais ampla que os métodos de vídeo, devido à maior capacidade do olho humano para detetar e identificar espécies crípticas, mas é mais dependente do treino do observador em termos de identificação e capacidade de medição, não permitindo uma validação.
O presente estudo fornece conhecimentos importantes sobre dois métodos vídeo-estéreo de amostragem subaquática da biodiversidade marinha, ainda pouco usados em águas temperadas de baixa visibilidade. Este estudo é de alta impôrtancia porque permite avaliar a qualidade e/ou eficiência da reserva de Ilhotes do Martinhal, bem como fornece uma base para sua boa gestão através de monitorização biológica. Neste contexto, os nossos resultados podem servir para reavaliar as medidas e os limites atuais de proteção em comparação com os objetivos específicos desta reserva.
viii
Palavras chave: áreas marinhas protegidas, efeito reserva, câmaras iscadas, vídeo estéreo por
ix
Table of contents
Abstract ... iv
Sumário Executivo ... v
Table of contents ... ix
List of Tables and Figures ... x
List of Abbreviations ... xi
1. Introduction ... 1
2 Materials and methods ... 7
2.1 Study area ... 7
2.2 Sampling methods ... 9
SBRUV sampling design ... 9
SDOV sampling design ... 11
Calibration procedure ... 12
2.3 Data processing and analysis ... 12
Stereo-video analysis ... 12 Data processing ... 13 Statistical analysis ... 14 Methods comparison ... 15 3 Results ... 16 3.1 SBRUV ... 16
Frequency of occurrence, species richness and illegal fishing gear ... 16
Results for community datasets ... 17
Results for key target species ... 21
Results for the most common non-target species ... 24
3.2 SDOV ... 25
Frequency of occurrence, species richness and illegal fishing gear ... 25
Results for community datasets ... 26
Results for key target species ... 27
Results for the most common non-target species ... 29
4 Methods comparison ... 29
4.1 Costs comparison ... 29
4.2 Sampling performance comparison ... 30
5 Discussion ... 31
6 References ... 39
x
List of Tables and Figures
Table 1: Physical habitat category of SBRUV samples ... 13
Table 2: Differences in community abundance and biomass between protection levels (SBRUV) ... 18
Table 3: Differences in community abundance and biomass between habitats (SBRUV). ... 20
Table 4: Results of PERMANOVA for interaction between protection and habitat (SBRUV).. ... 21
Table 5: Differences in abundance, length and biomass of key target species between protection levels (SBRUV). ... 22
Table 6: Differences in abundance, length and biomass of key target species between habitats (SBRUV) ... 24
Table 7: Differences in abundance, length and biomass of the most common non-target species between protection levels and between habitats (SBRUV). ... 25
Table 8: Differences in community abundance and biomass between protection levels (SDOV) ... 26
Table 9: Differences in abundance, length and biomass of key target species between protection levels (SDOV) ... 27
Table 10: Differences in abundance, length and biomass of the most common non-target species between protection levels (SDOV). ... 29
Table 11: Costs comparison between sampling methods. ... 30
Table 12: Target and non-target fish and invertebrate taxa by sampling method.. ... 53
Table 13: Comparison of results for protection between methods ... 54
Table 14: Abundance, length, biomass and % of measured individuals of the most common species 55 Table 15: Costs of field work, laboratory work and fixed material costs of sampling methods. ... 57
Table 16: SIMPER results for community abundance and biomass based on protection (SBRUV) ... 58
Table 17: SIMPER results for community abundance based on habitats (SBRUV) ... 60
Figure 1: Map of PNSACV MPA and Ilhotes do Martinhal marine reserve (Partial Protection I). ... 8
Figure 2: Sketch of SBRUV and SDOV systems. Image created with Paint 3D. ... 9
Figure 3: Field of view (FOV) of SBRUV and SDOV ... 10
Figure 4: Boxplot of richness by protection and by habitat (SBRUV). ... 17
Figure 5: Total biomass of community datasets by protection (SBRUV). ... 19
Figure 6: Proportions of habitat categories in the whole sampled area and by protection. ... 21
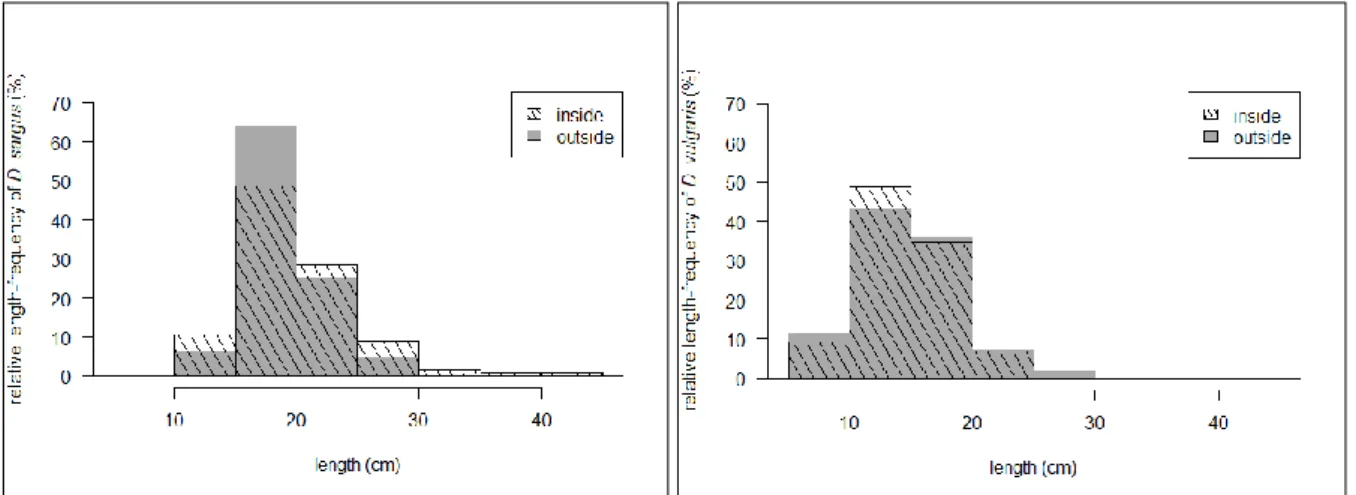
Figure 7: Length-frequency distribution of key target species by protection (SBRUV). ... 22
Figure 8: Biomass of key target species by protection (SBRUV). ... 23
Figure 9: Boxplot of richness by protection (SDOV). ... 26
Figure 10: Total biomass by protection (SDOV). ... 27
Figure 11: Length-frequency distribution of key target species by protection (SDOV). ... 28
xi
List of Abbreviations
BRUV Baited Remote Underwater Video FO Frequency of Occurrence
FOV Field of View
MLS Minimum Landing Size of commercial fish species MPA Marine Protected Area
PNSACV Parque Natural do Sudoeste Alentejano e Costa Vicentina
SCUBA Self Contained Underwater Breathing Apparatus SBRUV Stereo Baited Remote Underwater Video
SDOV Stereo Diver Operated Video UVC Underwater Visual Census
1
1. Introduction
Marine Protected Areas (MPAs) have been increasingly designated worldwide as a tool to reverse the negative anthropogenic impacts on the ocean realm (Lubchenco et al., 2003). Habitat dredging, overfishing, pollution and ocean mining can be cited as major threats for marine and coastal habitats, their biodiversity and productivity (Dayton et al., 1995; Thrush et al., 1998; National Research Council, 2001; McCauley et al., 2015). MPAs are areas set aside, mostly for the conservation of nature, aiming to protect and/or restore marine habitats, their ecosystem services and biodiversity (National Research Council, 2001; Leenhardt et al., 2015). Commonly, MPAs also promote more sustainable fisheries and rebuilt of fished populations (Gell & Roberts, 2003; Batista et al., 2015). Based on the strictness of protection measures, a large variety of MPAs exists. Those include both ‘light’ or ‘strong’ partially protected areas, where some level of commercial and/or recreational extraction activities is allowed, and ‘marine reserves’, which are fully protected areas, also called ‘no-take’ zones, with all extraction activities prohibited (Lester & Halpern, 2008; Lubchenco & Grorud-Colvert, 2015). Multiple-use MPAs are designed as a combination of zones with different levels of protection, so they can meet the needs of distinct stakeholder groups (Kelleher & Kenchington, 1992; Lester & Halpern, 2008). Nevertheless, the implementation of protection measures and zoning often faces opposition from locals, as it contradicts the tradition of open access to the sea and generates feelings of inequalities between various groups of stakeholders when the new rights are attributed (National Research Council, 2001).
Fisheries benefits are expected from well designed and managed MPAs addressing that goal, not only in partially protected areas, but also in areas surrounding marine reserves (Gell & Roberts, 2003; Halpern & Warner, 2003; Giakoumi et al. 2017). Thus, fishing grounds adjacent to marine reserves might get replenished through export of fish, at different life stages, from the reserves (Russ et al., 2004; Christie et al., 2010; Harrison et al., 2012; da Silva et al., 2015). The success of MPAs was found to be positively correlated with the level of enforcement (Jennings et al., 1996; Giakoumi et al., 2017). On the other side, lack of clearly defined conservation objectives, regulation matching them, active management and enforcement creates the risk of designating a ‘paper park’ only (Batista et al., 2015).
After MPA implementation, it is important to assess and monitor whether MPA objectives have been met due to the protection measures in place. MPA effects can be analysed based on biological data obtained before and after the MPA implementation (Halpern, 2003; Williams et al., 2009; Horta e Costa et al., 2013a). However, when before data are not available, the
2
comparison between no-fishing zones (impact) and the surrounding fished areas (control) may become the only available option (Westera et al., 2003; Miller & Russ, 2014; Malcolm et al., 2018). Given the spatial heterogeneity of distribution of marine organisms, the effects of habitat on fish communities should also be considered, as those might get confounded with reserve effect (Roberts & Polunin, 1991; García-Charton, 2004; Miller & Russ, 2014). To disentangle reserve effect from both temporal and spatial variability, the ´beyond-Before After Control Impact (BACI)´ approach represents the most robust method, bringing together the two above mentioned approaches while using multiple periods of time and multiple control sites (Underwood, 1992; Lincoln-Smith et al., 2006). Apart from that, studies of fish species movement patterns provide additional information on reserve efficiency in terms of reserve size adequacy (Abecasis et al., 2015; Belo et al., 2016; Di Franco et al., 2018).
MPA zoning and related fishing restrictions, size of the MPA, time since protection, fishing pressure intensity before and after protection, commercial character and mobility of protected species are all factors influencing MPA efficiency (Claudet et al., 2008; Molloy et al., 2009; Curley et al., 2013; Hilborn et al., 2014; McDermott et al., 2018). Overall, commercial species show greater responses to protection than non-target species (Harmelin et al., 1995; Micheli et al., 2004; Tetreault & Ambrose, 2007; Claudet et al., 2008; Lester et al., 2009; Horta e Costa, 2013a; Malcolm et al., 2018). Most of the positive effects of protection, such as increase in species community richness, fish densities, sizes and biomass, have been widely reported for marine reserves (García-Rubies & Zabala, 1990; Francour, 1994; Harmelin et al., 1995; Jennings et al., 1996; Micheli et al., 2004; Williams et al., 2009; Horta e Costa et al., 2013a; Pereira et al., 2017). Large reserves were found to provide greater commercial fish densities while small reserves have been beneficial for species with rather sedentary life style as well as for small-bodied by-catch species (Rakitin & Kramer, 1996; Tupper & Rudd, 2002; Claudet et al., 2008; Curley et al., 2013; McLaren et al., 2015). Older reserves tend to increase fish species diversity and enhance density and biomass effects (Russ & Alcala, 1996; McClanahan, 2000; Micheli et al., 2004; Claudet et al., 2008; Molloy et al., 2009). The effects of partial protection remain difficult to be generalized, due to the variation in protection measures between partially protected areas (Bell, 1983; Denny & Babcock, 2004; Lester & Halpern, 2008; Curley et al., 2013; Giakoumi et al., 2017; Malcolm et al., 2018). Anyway, even small partially-protected areas were seen to provide efficient protection of mobile commercial species (Curley et al., 2013).
Apart from positive or no effects, negative responses to protection were also found from some studies, affecting up to one third of fish species, mainly characterized as non-commercial and/or
3
sedentary species (Micheli et al., 2004). Those indirect effects of protection are attributed to predation-prey relationships which cause changes in the food web (Micheli et al., 2004; Takashina et al., 2012). For example, various studies confirmed that greater predation due to protection causes decrease in sea urchin abundances (Shears & Babcock, 2003; Micheli et al., 2005; Guidetti, 2006; Clemente et al., 2011; Fernández et al., 2016). However, few studies have demonstrated indirect protection effects in prey fish, as those are more difficult to unveil (Graham et al., 2003; Willis & Anderson, 2003; Micheli et al., 2004). As another indirect effect of protection, changes in biological habitat complexity might also contribute to shifts in fish community structure, resulting in increase in some and decrease in other species (Micheli et al., 2005; Gil Fernandéz et al., 2016). Other negative responses to protection are related to enhanced competition that favours dominant fish predators on detriment of subordinate predator species (McClanahan, 2000). Such responses are not necessarily indicative of reserve failure but rather reflect the variability of effects in different organisms (Willis & Anderson, 2003). Apart from that, protection might bring undesired side effects such as deterioration of fish stocks and habitats in the areas that remained opened to fishing, due to redirection and intensification of fishing effort (Himes, 2003; Hilborn et al., 2004; Stevenson et al., 2013; Vaughan, 2017; Nillos Kleiven et al., 2019). Research in this topic has focused on the concentration of fishing at the reserve border which, when intense, can cause a decline in density of some, especially less mobile species, at the reserve boundary (Rakitin & Kramer, 1996; Murawski et al., 2005; Goñi et al., 2006; Kellner et al., 2007; Nillos Kleiven et al., 2019). Although fishing benefits from fish spill-over outside from the reserve are surely desired, estimation of spatial distribution and intensity of fishing effort and its regulation need to be part of MPA design, to prevent negative impacts (Kellner et al., 2007; Nillos Kleiven et al., 2019).
Last, but not least, a success of an MPA should be evaluated considering not only biological indicators but also taking social outcomes into account (Christie et al., 2010; Horta e Costa et al., 2013b; Rossiter & Levine, 2014). Since MPAs address more local stressors, fishers are usually the most affected group by protection measures (Hilborn et al., 2004). In case of marine reserves, displacement of fishers from current fishing areas might induce additional costs, such as increased travel time to new fishing grounds and higher requirements on fuel (Hilborn et al., 2004; Stevenson et al., 2013; Vaughan, 2017). Fishers might also perceive a decrease in catches following the reserve implementation (Cinner et al., 2014). Studies of MPAs effects on local fishing communities´ welfare rather indicate that no impacts and positive impacts are more common than negative impacts, while the poorest of fishers were identified as the most vulnerable group (Mascia et al., 2010; Cinner et al., 2014). Fishermen attitude towards MPAs
4
often originates from the extent of involvement in decision making in the reserve establishment (Chuenpagdee et al., 2013; Thaman et al., 2016). For this reason, a strong local community participation, especially of fishermen, since the initial phase of MPA creation process, plays a key role in future MPA success (Himes, 2003; Mackelworth et al., 2008; Gall & Rodwell, 2016; Thaman et al., 2016).
Monitoring of ichthyofauna assemblages of MPAs can be done using traditional sampling tools, such as fishing gear or fish landing data (Rakitin & Kramer, 1996; Williams et al., 2009; Roberts et al., 2001; Horta e Costa et al., 2013a; Pereira et al., 2017). Anyway, non-destructive sampling techniques are more appropriate, as they minimize impacts on fish stocks and habitats (Malcolm et al., 2007; Unsworth et al., 2014). So far, Underwater Visual Census (UVC) performed by trained divers with Self Contained Underwater Breathing Apparatus (SCUBA) has been the most widely applied method for assessment of fish species sizes and densities in MPAs (Jennings et al., 1996; Rakitin & Kramer, 1996; Tupper & Rudd, 2002; Christie, 2004; Williams et al., 2009; Vasco-Rodrigues et al., 2011; Vergés et al., 2012; Henriques et al., 2013; Horta e Costa et al., 2013a). Nevertheless, UVC is known to have various biases, related to observers´ level of experience, selected methodology and changes in fish behaviour in response to the presence of divers (St. John et al., 1990; Cole, 1994; Francour et al., 1999; Williams et al., 2006; Watson & Harvey, 2007; Pais & Cabral, 2018). In recent years, non-invasive methods based on underwater video techniques have expanded rapidly, thanks to improved image quality and prolonged recording time, achievable at relatively low costs (Cappo et al., 2003; Mallet & Pelletier, 2014; Unsworth et al., 2014; Bouchet & Meeuwig, 2015; Letessier et al., 2015). Underwater video systems not only enable precise fish species identification but, when mounted as stereo-video, allow for accurate measurement of fish morphometrics (Cappo et al., 2003; Boutros et al., 2015; Letessier et al., 2015). Length measurements from stereo-video systems provide greater accuracy and precision than length estimates made by experienced divers, which is of a great importance when assessing protection effects based on fish length and/or biomass (Harvey et al., 2002). Video-techniques, when compared to UVC, enable reduction of requirements on divers´ expertise and provide a permanent sample record, which can be re-analysed at any time by different observers (Cappo et al., 2003; Goetze et al., 2015).
Stereo Baited Remote Underwater Video (SBRUV) is one of the stereo-video sampling techniques mostly used in MPA effects surveys (Westera et al., 2003; Denny & Babcock, 2004; Miller & Russ, 2014; McLaren et al., 2015; Malcolm et al., 2018). Due to the presence of a bait plume, SBRUV becomes a point of attraction for fish, thus being able to detect greater richness
5
of fish species and their densities than do un-baited remote video systems (Cappo et al., 2003; Hardinge et al., 2013). Higher detection and abundances of predatory and scavenger fish species, which are the groups targeted by fisheries, were reported for SBRUVs when compared to un-baited cameras, UVC and Stereo Diver Operated Video (SDOV) (Harvey et al., 2007; Goetze et al., 2015). SBRUVs favour sampling of larger bodied individuals that, through agonistic behaviour, tend to exclude smaller sized individuals from the screen view (Hardinge et al., 2013; Dunlop et al., 2015). As a result, an underestimation of small individuals might lead to bias in species length-frequencies and densities, especially in areas where fish densities are high (Dunlop et al., 2015). Apart from that, fish densities derived from SBRUV sampling are further limited, as the area of bait attraction for fish is hard to model, being influenced by variables such as currents´ direction and velocity (Taylor et al., 2013; Haggitt et al., 2014). However, when compared to UVC, SBRUV is more suitable for repetitive sampling at depths above 20 meters where the complexity of dives increases (Terres et al., 2015). It also eliminates both positive or negative behavioural responses in fish to divers (Willis & Babcock, 2000; Assis et al., 2013). However, higher richness and abundances of fish species have been associated to UVC rather than SBRUV, due to divers´ greater ability to detect both cryptic, crypto-benthic, herbivorous and territorial fish species (Langlois et al., 2006; Stobart et al., 2007; Colton & Swearer, 2010; Lowry et al., 2012), although greater abundances were reported from SBRUV than UVC for specific groups of species (Willis et al., 2000; Willis & Babcock, 2000; Goetze et al., 2015). Thus, each technique might be more suitable for sampling different fish species and result in different assemblage structure (Willis & Babcock, 2000; Colton & Swearer, 2010; Goetze et al., 2015).
SDOV represents another stereo-video technique that has been used in assessment of fish species composition, densities and sizes, although its application as an MPA monitoring tool remains scarce (Watson et al., 2005; Tessier et al., 2013; Goetze et al., 2015; Wartenberg & Booth, 2015; Navarro-Martínez et al., 2017). SDOV tends to provide lower fish species richness and abundances than UVC, explained by greater detection capacity of the human eye when compared to the cameras (Pelletier et al., 2011; Holmes et al., 2013; Tessier et al., 2013). When combined with the behavioural response in fish to divers and effects of bait, lower species richness and abundances were reported from SDOV than from SBRUV (Watson et al., 2005; Langlois et al., 2010; Watson et al., 2010). However, SDOV has a potential as a monitoring tool for easily identifiable, non-shy and/or herbivorous target fish species (Tessier et al., 2013; Goetze et al. 2015). As a complementary method to SBRUV, SDOV avoids alterations in fish behaviour due to the bait plume while it also allows permanent recording.
6
Both mentioned stereo-video methods share several limitations. First, not all fish always appears in the field of view (FOV) of both cameras, which excludes them from length measurement, resulting in narrower length datasets and lower statistical power when compared to UVC (Holmes et al., 2013; Cundy et al., 2017; Wilson et al., 2018). In addition, most of the studies that used stereo-video so far, took place in tropical waters that are characterized by good visibility conditions. In temperate waters, light conditions and visibility are limiting factors, causing lower video quality and shortening the distance in FOV, again causing a decrease in the proportion of fish that can be precisely measured (Unsworth, 2014).
Furthermore, processing of video imagery is known to be time consuming. Apart from costs of the camera equipment, laboratory time represents net extra costs of SBRUV and SDOV above UVC (Holmes et al., 2013; Tessier et al., 2013). However, depending on the amount of data gathered from stereo-video, time expenditures can become comparable to those of UVC (Goetze et al. 2015). SBRUV was found to be more cost-effective than SDOV, as staff time per sampling site reduces when several SBRUV frames are deployed simultaneously (Langlois et al., 2010). Thus, SBRUV might become a more competitive option to UVC. In fact, combination of sampling methods is desirable as it will help to understand limitations of each method and gather complementary results for the sampled area, increasing analysis robustness (Cappo et al., 2003; Watson et al., 2005).
In this study, we aimed at assessing whether potential effects of protection existed in the marine reserve of Ilhotes do Martinhal, which is part of a large MPA of the South-West coast of Portugal. The protection effect in demersal fish and commercial invertebrate community was evaluated based on richness, abundance, length and biomass. Response to protection was expected to be found in target (commercial) species and especially in target species above minimum landing size (MLS), which are the groups most sensitive to prohibition of fishing. Given the lack of data on demersal fish and commercial invertebrates densities and sizes from the time prior to reserve implementation, a control-impact approach between reserve inside and outside was applied. As protection effects might be confounded with effects of habitat, we also checked for influence of physical habitat. SBRUV was used as a primary sampling method, as previous studies (Capaz, 2013; Willenbrink, 2016) confirmed that the method performed well in Portuguese coastal waters. SDOV was added as a complementary sampling method to enable for SBRUV results validation and complementarity. At the same time, the sampling performance of SDOV was tested as this method is rather pioneer in temperate waters. As both selected methods substantially reduce requirements on observer´s in situ expertise, both have a potential as easily applicable reserve monitoring tool. Sampling performance and
cost-7
effectiveness were compared between methods to understand if those would be suitable for future reserve monitoring.
2 Materials and methods
2.1 Study areaThe “Parque Natural do Sudoeste Alentejano e Costa Vicentina (PNSACV)” is a marine protected area (MPA) that was established in 1995 along the south-west coast of Portugal (Decreto Lei n. º 26/95). With 2 km of width, the MPA spreads continuously for 130 km of the Portuguese coast, between Sines and Burgau (Figure 1). Various types of marine ecosystems can be found inside the MPA, given the presence of rocky and sandy bottoms and small estuaries. In 2011, with the approval of the management plan of the marine park, the MPA was divided into zones with different levels of protection: full protection (PT), partial protection of type I (PPI) and type II (PPII) and a complementary protection or buffer zone (Resolução do
Conselho de Ministros n. º 11-B/2011). All types of fishing and other human activities have
been prohibited inside of the PT zone. Nine rocky islets, with surrounding distance up to 100 m, were assigned this category. Except for non-extractive recreational activities, allowed within partial protection zones, fishing is forbidden in PPI, except for commercial hand harvest of goose barnacles (Pollicipes pollicipes) in the coastal cliffs. Thus, the PPI represents a ‘marine reserve’ (also known as no-take) for fish and invertebrates (except for the intertidal species P.
pollicipes). Four locations with rocky habitat and sand belong to the PPI category, including Ilhotes do Martinhal, which is the reserve of this study (Figure 1).
The buffer zone covers the majority of PNSACV MPA. In this zone, commercial fishing can only be conducted by locally registered boats with a valid license for PNSACV. There are several restrictions of fishing gear usage, but they are derived from the national law and thus are not MPA specific. In this context, purse seines are allowed further than 0.25 nm from coast with a minimum depth of 20 meters, same as defined in currently applicable national legislation (Portaria n.° 1102-G/2000; Resolução do Conselho de Ministros n.° 11-B/2011). The only additional limitation to fishing gear types in relation to the national legislation is for longlines that can only be deployed further than 0.5 nautical miles (nm) from coast instead of nearshore (Portaria n.° 1102-C/2000; Resolução do Conselho de Ministros n.° 11-B/2011). Recreational fishing (hand harvest, handlining and spearfishing) have been allowed in the buffer zone within the scope of national legislation, except when specific legislation exists, such as temporal closures for particular fish species and lower daily limits for both fishing and hand harvest
8
(Portaria n.° 115-A/2011; Decreto-Lei n.° 101/2013). For land-based commercial and recreational handline fishers, the capture of Diplodus sargus and Diplodus vulgaris has been forbidden between February 1st and March 15st. Between March 1st and May 31st the same restriction has been valid for Labrus bergylta (Portaria n.º A/2011; Portaria n.º
115-B/2011). In the whole MPA, it has been strictly prohibited to capture Epinephelus marginatus,
marine mammals, marine and/or migratory birds. Both commercial fishing with sets of octopus traps and land-based handlining represent fishing activities that can be commonly observed around Atalaia and Barranco, which are part of the buffer zone assessed in the current study.
This study was held in the south coast of PNSACV in Ilhotes do Martinhal ‘marine reserve’ which covers an area of 3.9 km2 with rocky and sandy bottom. Multiple locations with rocky habitat from both inside (i.e. from the PPI zone) and outside the marine reserve (i.e. from the buffer zone) were sampled. Sampling locations outside the marine reserve were located both in the west and in the east of the reserve (Figure 1).
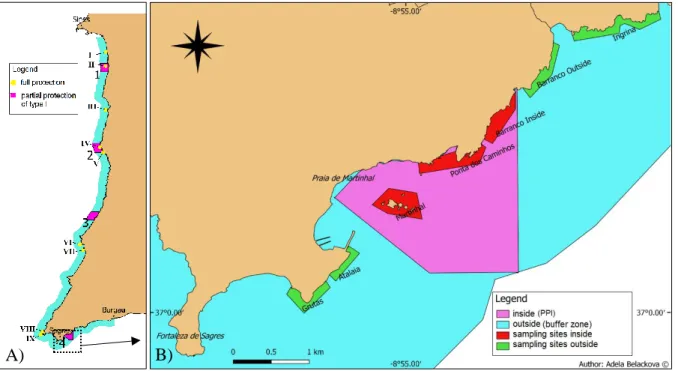
Figure 1: Map of PNSACV MPA and Ilhotes do Martinhal marine reserve (Partial Protection I). A) Map of the
PNSACV MPA in the South-West coast of Portugal, showing nine fully protected locations, four locations with Partial Protection I and the buffer zone. Full protection: I) Pedra do Burrinho, II) Pedras da Ilha do Pessegueiro, III) Pedra da Atalaia, IV) Pedra da Enseada do Santoleiro, V) Pedra de Baía da Nau, VI) Pedra da Carraca, VII) Pedra da Agulha, VIII) Pedra das Gaivotas, IX) Pedra do Gigante. Partial protection (PPI):1) Ilha do
Pessegueiro, 2) Cabo Sardão, 3) Rogil, 4) Ilhotes do Martinhal. B) Map of sampling locations inside of Ilhotes do Martinhal marine reserve and outside, including three sampling locations inside (Martinhal, Ponta dos Caminhos, Barranco inside) and four sampling locations outside (west outside: Grutas, Atalaia; east outside: Barranco
outside, Ingrina).
9
2.2 Sampling methods
SBRUV sampling design
The SBRUV systems used in this study were developed by Willenbrink (2016) as a modification of a single camera BRUV build by Capaz (2013). Each SBRUV consisted of two small action cameras in waterproof housings, mounted at 0.4 m distance and facing the bait basket at 8° inward angle (Figure 2 and 3). Three SBRUVs were used for each sampling site, one with two GoPro Hero3 cameras and two with small action cameras (SK8 CAM 4K), providing low cost sampling option at acceptable image quality (Letessier et al., 2015). All cameras were set with a medium FOV of 94.4° in air, corresponding to 67° FOV in seawater. All videos were recorded in full HD quality (1080 x 25 frames for GoPro, 1080 x 30 frames for SK8). Considering 3 m as average visibility of the video recordings, the common FOV of the SBRUV systems was estimated to be 5.15 m2 with 3 m of distance ahead of the cameras, counted in GeoGebra software (International GeoGebra Institute, 2018) (Figure 3).
10
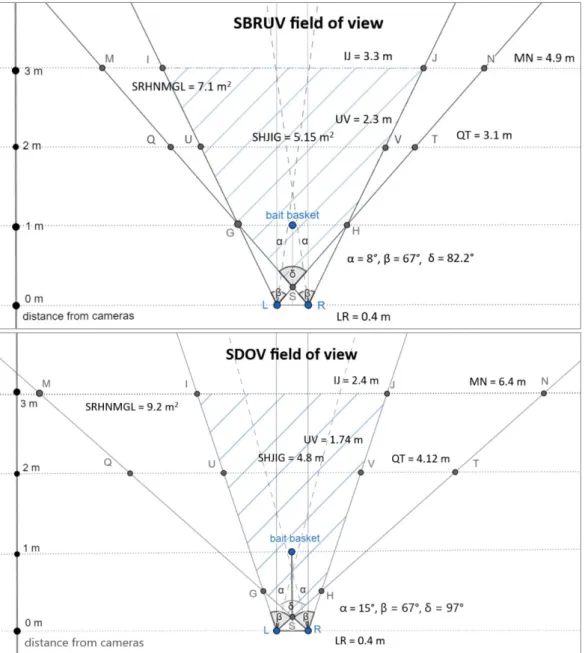
Figure 3: Field of view (FOV) of SBRUV and SDOV. Upper figure: SBRUV, lower figure: SDOV, L: left camera,
R: right camera, LR: distance between left and right camera, IJ : width of the common FOV at 3 m of distance, MN: width of total FOV at 3 m of distance, SHJIG: area of common FOV, SRHNMGL: area of total FOV, α: inward angle of each camera, β: FOV angle of each camera in seawater, δ: common FOV angle in seawater. Image made in GeoGebra software.
Three SBRUV sampling campaigns took place between March and May 2018. During each campaign, seven locations, three inside the reserve and four outside, were sampled (Figure 1). At each location, the three SBRUV systems were deployed from a boat at rocky bottom habitats of the infralittoral zone (from 7 to 18 m of depth). A minimum distance of 250 meters was kept between each two SBRUVs to ensure independence of samples, by minimising the likelihood that fish can swim between two SBRUVs during sampling (Cappo et al., 2001; Langlois et al., 2010; Haggitt et al., 2014; Goetze et al., 2015). This minimum distance was defined considering the total available area of rocky habitats relative to replication requirements while assuming
11
that bait plume attraction power was lower than 250 m and that demersal fish species targeted by our sampling were reef dependent, thus showing reduced mobility. The net time of one SBRUV recording was 30 minutes, as it was confirmed to be the enough time to reach maximum demersal fish species richness (Capaz, 2013). Sampling was performed during daylight hours, between 9 am and 17 pm, to avoid variability between samples due to fish crepuscule behaviour (Harvey et al., 2007). The same total quantity (~ 200 g) and proportions of small pelagic fish (Sardina pilchardus, Trachurus trachurus, Scomber colias) and mussels (Mytilus galloprovincialis) were used as bait throughout the experiment (Willis & Babcock, 2000; Capaz, 2013). Bait basket content was changed after every two SBRUV deployments. On a second day of each sampling campaign, resampling for excluded samples (see reasons below) took place to maintain the requirements on the number of replicates as close as possible to the initially planned design. As initially planned, 63 samples were collected with SBRUVs, but out of those, 15 samples were excluded (23.8 %). The reasons for samples exclusion were as follows: system landed on sandy bottom (53.3 % of excluded samples), water visibility conditions were less than 2 m (20.0 %), system landed with obstructed FOV (20.0 %) and camera´s FOV changed compared to the calibrated image (6.7 %). Resampling was then held for 12 (out of the 15) excluded samples and had a 100 % success rate, as the main reason of failure was landing on sand, which was resolved by sampling point correction. The other three excluded samples were rejected ex-post during data analysis (due to bad water visibility and camera´s FOV change), and thus not subject to resampling. A final number of 60 valid samples (26 inside and 34 outside the marine reserve, in line with the planned 3:4 inside vs. outside ratio) was used in data analysis.
SDOV sampling design
The SDOV system was derived from the SBRUV (Figure 2) but cameras had an inward angle of 15° (Figure 3). Three SDOV sampling campaigns took place between April and July 2018. Two locations inside the marine reserve and two to three locations outside (both in the west and in the east) were sampled during each campaign (Figure 1). The SDOV fish census was performed using SCUBA diving, with one diver stretching a transect line and a second diver swimming at his side and video recording. At each location, 30 m transects were sampled (Schmitter-Soto et al., 2018). Distance of 10 m was left between the transects (Goetze et al., 2015). At each location, three replicate transects were sampled during each campaign (Monteiro et al., 2012). Divers swam no more than one meter above the substrate at a constant speed of
12
approximately 8 m/ min-1 (Lincoln Smith, 1988; Cheal & Thompson, 1997). The total width of the transect was calculated to be 6.4 m at 3 m ahead the SDOV system (Figure 3), providing a total transect area of 192 m2 (area where demersal taxa was counted). When recording, cameras faced forward and slightly down, with the aim to capture demersal fish species (Holmes et al., 2013; Wilson et al., 2018). However, when fish seemed to have appeared in the FOV of only one camera, the cameras were turned towards the fish as this was found to be useful for video post-processing (length measurement). The SK8 cameras were used for SDOV sampling as they allowed the recorded video to be visualized directly in the cameras screen when recording, thus helping to control the position of the cameras relative to the bottom. A total of 39 samples (18 inside and 21 outside) were obtained with the SDOV and used in the analysis.
Calibration procedure
Calibration of both stereo-video systems followed the procedure of Neuswanger et al. (2016), including video synchronisation, distortion correction and 3D calibration. On top of that, cameras and housings were labelled, allowing the same housing to be used with the same camera throughout the whole experiment. Such settings enabled the use of one distortion correction frame for each camera during the entire study, thus reducing the time and costs of video post-processing. At the beginning of each sampling day, housings with cameras were tightly screwed into their base on the stereo-video structure, to avoid further housing movements during sampling. Hands were clapped at the beginning of each recording for synchronisation purposes of each pair of cameras.
2.3 Data processing and analysis
Stereo-video analysis
Processing of video material was done in VidSync software version 1.661 (Neuswanger et al., 2016). The processing included i) merge and synchronisation of the two videos, distortion correction and 3D calibration, ii) species abundance counts, iii) individual length measurements and iv) habitat categorization. For the SBRUV, MaxN, which is the maximum number of individuals of a species present in a frame or during an interval of time, within the 30 min video recording, was used as count of relative abundance (Cappo et al., 2003). This technique is currently considered as the best proxy for fish relative abundance obtained from SBRUVs, while it avoids repeated counts of the same individuals. On the other side, MaxN is a conservative measure, which might lead to underestimation of the actual fish abundance (Cappo
13
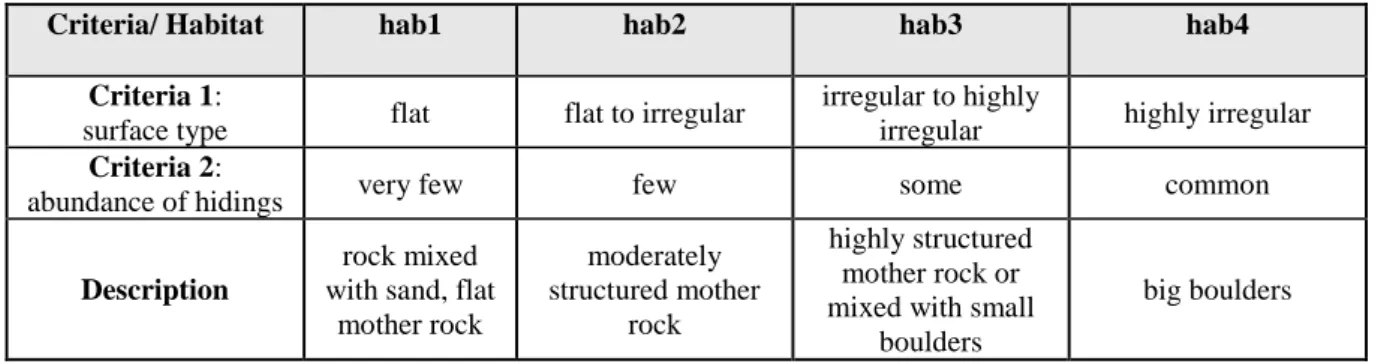
et al., 2003; Watson et al., 2005). Taking advantage of the video technique, fish were counted for 30 seconds which were added to the MaxN frame, while making sure that individuals were not counted twice (Stobart et al., 2007; Willenbrink, 2016). MaxN counts included individuals that appeared only in one of the two videos (total FOV), whereas length measurements could only be done when individuals appeared in both videos (common FOV; Figure 3). For each species, within its respective MaxN frame, total length (cm) was measured in fish and mantle length in cephalopods (Horta e Costa et al., 2013a; Unsworth et al., 2014; Wilson et al., 2018). Habitat category was assigned to each SBRUV sample based on visual assessment of physical habitat complexity from the videos. Two criteria, surface type and abundance of hidings, were considered when deciding on habitat category (Table 1). In addition to the identification of species, their respective abundance and size, and overall habitat features, the presence of illegal fishing gear inside the marine reserve was noted down when encountered during field-sampling or in video footages.
Table 1: Physical habitat category of SBRUV samples.
Criteria/ Habitat hab1 hab2 hab3 hab4
Criteria 1:
surface type flat flat to irregular
irregular to highly
irregular highly irregular
Criteria 2:
abundance of hidings very few few some common
Description
rock mixed with sand, flat
mother rock moderately structured mother rock highly structured mother rock or mixed with small
boulders
big boulders
SDOV video analysis followed the same steps as SBRUV analysis, except that instead of using MaxN as abundance estimate, demersal fish and commercial invertebrates were counted along the whole transect, except for fish that appeared from behind of the diver (Goetze et al., 2015). Habitat category was not tested for SDOV samples.
Data processing
Both selected stereo-video methods were designed to sample demersal species of fish and invertebrates (cephalopods). Schools of semi-pelagic fish (Boops boops) were excluded from the analysis due to their underestimation by this technique targeting species highly associated to the rocky bottom, and to their little potential to provide a response to protection (Horta e Costa et al., 2013a). In addition, cryptobenthic species, such as Gobiidae or Blenniidae, were
14
considered out of scope as the horizontal video also underestimates those taxa (Watson et al., 2005; Holmes et al., 2013).
The number of sampled demersal fish and invertebrate species provided information on species richness that was expressed by sample (i.e. richness per sample) and by protection (i.e. total richness). Frequency of occurrence (FO) was expressed for each demersal species, based on the equation:
FO (%) = (N° of samples containing the species/ Total N° of samples) * 100
Biomass was calculated for every individual based on length measurements in MaxN frames, using species-specific length-weight relationships (Gonçalves et al., 1997; Borges et al., 2000; Morato et al., 2001; Morey et al., 2003; Sifner & Vrgoc, 2004; Veiga et al., 2009; Horta e Costa et al., 2013a). When not available, FishBase species information from closest regions (and with enough individuals tested) was used (Froese & Pauly, 2019). For each sample, mean species biomass was multiplied by species abundance (MaxN for SBRUV, total count for SDOV) to obtain species biomass per sample (Willis et al., 2003; Willenbrink, 2016). Total biomass was then calculated as the sum of biomass of all species in a sample. In the same way, total abundance was obtained as the sum of abundance of all species in a sample.
Identified taxa were grouped based on their local fishing commercial status as target (commercial) or non-target (non-commercial). Target species were then grouped according to their size in relation to minimum landing size (MLS), when available. Commercial species without MLS defined were not classified as neither above nor below MLS.
Statistical analysis
SBRUV: The effects of factors protection (two levels: ‘inside’ vs. ‘outside’ marine reserve) and habitat (four levels: hab1, hab2, hab3, hab4) on response variables of richness, abundance, length and biomass were tested. The following community datasets for abundances (MaxN) and biomass (at the MaxN) were created: all demersal species, target species, target species above MLS, target species below MLS and non-target species. Primer-E version 6.4.7.0 with PERMANOVA+ package was used for multivariate analysis (Anderson, 2005). First, a square root transformation was applied to species abundance and biomass by sample, to increase the contribution of less dominant species (Clarke & Madwick, 2015). Two-way crossed main PERMANOVA with 9999 permutations was conducted based on Bray-Curtis similarity matrix. For habitat, pair-wise PERMANOVA was conducted only when main PERMANOVA test was
15
significant for that factor (p < 0.05). In addition, SIMPER analysis was done to understand which species contributed the most to differences between protection levels (Clarke & Madwick, 2015).
Univariate analysis was done using R version 3.4.3 (R Core Team, 2017). For community datasets, effects of protection and habitat on species richness, total abundance and total biomass per sample were tested. At individual species level, differences in abundance, length and biomass per sample were inspected for the key-target demersal species, Diplodus sargus and
Diplodus vulgaris, and for the most common non-target species, Coris julis, Serranus cabrilla
and Labrus bergylta. For the key-target species, we also analysed whether differences in abundance and biomass existed for individuals above MLS and below MLS. All datasets were first tested for normal distribution (Shapiro-Wilk test) and homogeneity of variances (Bartlett´s test) (Dytham, 2011; Gardener, 2017). As none of the datasets complied with conditions of parametric tests, differences in response variables based on protection and habitat were tested using non-parametric statistical tests (Wilcoxon rank-sum test, Kruskal-Wallis test) (Montgomery & Runger, 2003; Dytham, 2011; Gardener, 2017). For explanatory purposes, we also tested whether differences in response variables existed between the west outside, the east outside and the reserve inside. Univariate analysis was accompanied by descriptive statistics (mean ± standard error).
To investigate whether habitat was independent from protection, we used Chi-square Test of Independence with simulated p-value (Dytham, 2011; Montgomery & Runger, 2003). Furthermore, interaction between protection and habitat for abundance and biomass was tested in multivariate analysis (two way crossed PERMANOVA) (Anderson, 2005).
SDOV: Statistical analysis of the SDOV data pursued the same scheme as for SBRUV with the following differences: i) factor habitat was not available and thus not tested, ii) abundances and biomass data were based on total counts and length measurements obtained along each transect and not on MaxN.
Methods comparison
Costs of the two-stereo video methods were compared using variable and fixed costs. Variable costs per sample were calculated from fieldwork costs of day of sampling and from laboratory costs. Fieldwork costs included costs of travel to Sagres and back, boat expenses, labour costs and price of consumables specific to each method during one sampling day (Perkins et al., 2013). Laboratory costs included labour costs of data post-processing (data storage, merging of
16
automatically split videos, calibration in VidSync, abundance counts and length measurements). Both fieldwork and laboratory costs were recounted to costs per one sample. Labour costs were based on average daily income of a research technician in Portugal in 2018 (48 €/ day). Fixed costs were expressed as ‘initial set up costs’, including the price of all equipment needed to be able to start using the method (Perkins et al., 2013). Those involved diving material for SDOV and stereo-video material for both SDOV and SBRUV.
Using univariate statistical methods (Wilcoxon rank-sum test), we assessed whether differences existed between methods in sampled values of richness, abundance, length and biomass (Montgomery & Runger, 2003; Dytham, 2011; Gardener, 2017). We also compared sampling performance between methods based on the number of valid samples collected during one day of sampling. Taking into consideration that not all individuals can always be measured from stereo-video recordings, the percentage of measured out of all counted (sum of MaxN in SBRUV, total count in SDOV) individuals of a species was calculated for the most common species, to compare methods efficiency in obtaining fish sizes.
3 Results
3.1 SBRUVFrequency of occurrence, species richness and illegal fishing gear
A total of 30 taxa from 15 different families were identified from SBRUV samples (Appendix, Table 12). Most of the taxa belonged to Sparidae (9 species) and Labridae (6 species) families. Out of all, 19 taxa were classified as target and 11 as non-target species. Individuals and schools of B. boops were repeatedly spotted but excluded from the analysis due to their semi-pelagic character. Apart from demersal fish species, three target species of Cephalopoda (O. vulgaris,
L. vulgaris, S. officinalis) were also present. From target species, the highest frequency of
occurrence was related to D. sargus (96.7 % of the samples) and D. vulgaris (95.0 %). From non-target species, C. julis (98.3%) and S. cabrilla (81.7%) were the most common. A total of 22 taxa appeared inside the marine reserve and 26 outside (21 in west outside and 23 in east outside). There were four species only spotted inside, three of high commercial value (Pagrus
pagrus, Pagrus auriga, L. vulgaris). Other 8 species only appeared outside the reserve,
corresponding to both target (S. officinalis, Conger conger, Mullus surmuletus, Trisopterus
luscus, Sparus aurata) and non-target species (Chromis chromis, Pseudocaranx dentex, Serranus atricauda) (Appendix, Table 12).
17
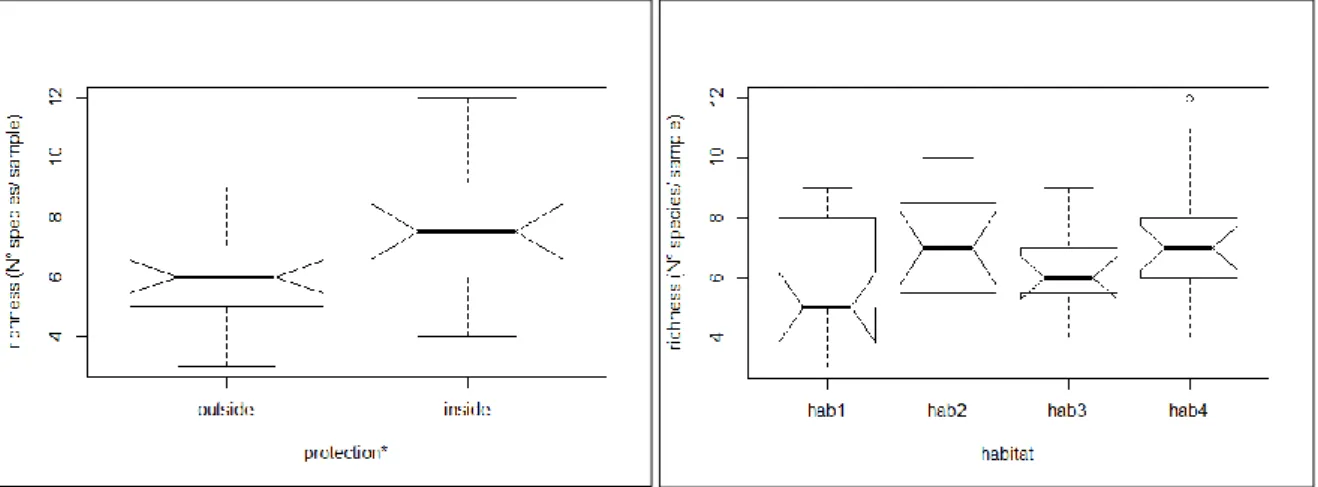
Mean richness was found to be significantly higher inside than outside (Wilcoxon test, p=0.012). Mean richness by protection level was equal to 7.42 ± 0.40 taxa inside the reserve and 6.13 ± 0.30 taxa outside. This difference was due to lower mean richness in east outside when compared to the reserve inside (Wilcoxon test, p=0.015, Appendix, Table 13). Those results were obtained despite the total richness in east outside (23 taxa) and inside (22 taxa) were similar. When looking at mean richness in habitats, no differences were detected (Kruskal test, p=0.176, Figure 4).
Illegal fishing gear, represented by sets of octopus traps, was encountered on two occasions during SBRUV sampling campaigns. Both encounters occurred at Barranco inside location (on 27/03/2018 and on 24/05/2018). As each campaign covered two sampling days, this means that illegal fishing gear was found two out of six days (~33% of sampling days). During a later sampling campaign, octopus traps were found again at Martinhal location (18/07/2018, biological data of this sampling campaign not included in this study).
Figure 4: Boxplot of richness by protection and by habitat (SBRUV). Significant differences marked with *
when inside>outside.
Results for community datasets
Effect of protection
Multivariate analysis showed significant differences in abundance of all demersal species between inside and outside the reserve (PERMANOVA; Table 2), with higher average values observed for the reserve in most species (SIMPER; Appendix, Table 16). For all other community datasets (target species, target species above MLS, target species below MLS and non-target species), differences between protection levels in multivariate abundance were not confirmed, although result for target species was marginally non-significant (PERMANOVA,
18
p=0.06; Table 2). Differences in abundance between protection levels (average dissimilarity of all demersal species group: 43.3 %) were mainly attributed to C. julis (17.5 % contribution to dissimilarities), D. vulgaris (10.1 %), D. sargus (10.0 %), S. cabrilla (6.4 %), Mugilidae (5.8 %) and L. bergylta (5.7 %) (SIMPER; Appendix, Table 16). Average abundances of all species, except for D. vulgaris, Mugilidae and Sarpa salpa, were slightly higher inside than outside, thus indicating that a trend of greater abundances inside was present (Appendix, Table 16). The species that showed more positive results in the reserve were, from target species: D. sargus,
Oblada melanura, Diplodus cervinus and O. vulgaris, and from non-target species: C. julis, S. cabrilla, L. bergylta and Ctenolabrus rupestris.
For total abundance, univariate analysis did not show significant differences between protection levels (inside vs. outside) in any of the tested community datasets (Table 2). However, significant differences in total abundance existed when comparing the reserve to the west outside and to the east outside separately. For all demersal species and target species, total abundance was significantly greater in west outside than inside the reserve, and inside the reserve than in east outside. For non-target species, total abundance was also greater inside than in east outside (Appendix, Table 13).
Table 2: Differences in community abundance and biomass between protection levels (SBRUV). Results of
PERMANOVA and Wilcoxon test, significant p-values (p<0.05) marked *. For Wilcoxon test: inside>outside marked * and outside<inside marked **. MLS: minimum landing size.
PROTECTION (SBRUV)
PERMANOVA Wilcoxon test
Community dataset Abundance Biomass Total abundance Total biomass
All demersal species 0.003* 0.001* 0.99 0.01* Target species 0.06 0.003* 0.77 0.001* Target species above MLS 0.07 0.03* 0.35 0.002* Target species below MLS 0.16 0.43 0.84 0.16
Non-target species 0.10 0.03* 0.56 0.01*
Multivariate results (PERMANOVA) showed that biomass of all community datasets, except target demersal species below MLS, differed significantly between reserve inside and outside (Table 2). Larger significant differences were found in all demersal species and in the target species group (PERMANOVA, p < 0.01). Differences in biomass between protection levels (average dissimilarity in all demersal species: 59.2 %) were associated with D. sargus (14.3 % contribution to dissimilarities), L. bergylta (8.7 %) D. cervinus (8.6 %), Mugilidae (8.3 %) and
19
D. vulgaris (7.6 %) (SIMPER; Appendix, Table 16). Except D. vulgaris, Mugilidae and S.
salpa, higher average biomass inside than outside was found in all other species. Out of those,
the ones that seemed to have thrived the most inside the reserve were, from target taxa, D.
sargus, D. cervinus, O. melanura and O. vulgaris and, from non-target taxa, L. bergylta and C. julis (SIMPER; Appendix, Table 16). Although biomass of Dicentrarchus labrax and P. auriga
had a small but non-negligible contribution to dissimilarities of target species (7.2 % and 4.2 % respectively), the rare character made them less relevant as indicators of differences (SIMPER; diss/SD=0.43 and diss/SD=0.53; Appendix, Table 16).
Univariate analysis confirmed the same results for total biomass as PERMANOVA, showing that for all tested community datasets, except target species below MLS, total biomass was significantly greater inside than outside the reserve (Table 2). Larger significant differences were found in the datasets of target species and target species above MLS (Wilcoxon test, p < 0.01). When comparing the reserve with west and east outside, total biomass was found significantly greater inside the reserve than in the east outside, for all tested datasets (Wilcoxon test, p<0.05; Appendix, Table 13). Only for target species above MLS, total biomass was also significantly greater inside the reserve than in west outside (Wilcoxon test, p<0.05). Total biomass of community assemblages is displayed in Figure 5.
Figure 5: Total biomass of community datasets by protection (SBRUV). Mean ± standard error displayed. ADS:
all demersal species, TS: target species, TS+: target species above MLS, TS-: target species below MLS, NTS: non-target species. Significant differences marked * when inside>outside and ** when inside<outside. MLS: minimum landing size.
20
Effect of habitat
Multivariate analysis indicated that abundance of all demersal species and of non-target species differed significantly between habitats (PERMANOVA, p≤0.5; Table 3). Based on pair-wise PERMANOVA, significant differences in abundance of all demersal species and non-target species were found between hab1, the less complex habitat, and other habitats (Table 3). Differences in abundance between hab1 and other habitats (average dissimilarity of all demersal species between 43.9 % and 46.4 %) was accredited to C. julis (> 18.9 % contribution), D.
sargus (> 8.4 %), D. vulgaris (> 9.1 %), S. cabrilla (> 6.6 %) and C. rupestris (> 5.6 %)
(SIMPER, Appendix; Table 17). Average abundance was higher in hab1 than in all other habitats for D. sargus but lower for the other four above stated species. From non-target species,
C. rupestris was absent from hab1 (SIMPER). No differences between habitats were detected
for biomass based on multivariate analysis (PERMANOVA, p>0.05; Table 3), with the result for all demersal species being marginally non-significant (PERMANOVA, p=0.068). Univariate analysis did not reveal any significant differences between habitats neither for total abundance nor total biomass (Kruskal-Wallis test, p>0.05; Table 3).
Table 3: Differences in community abundance and biomass between habitats (SBRUV). Results of
PERMANOVA and Kruskal-Wallis test, significant p-values (p<0.05) marked with *. For pairwise PERMANOVA, only significant differences are shown. MLS: minimum landing size.
Interaction between protection and habitat
For the whole area and for the reserve inside, hab3 had the lowest proportion (18 %) of all habitats (Figure 6). In addition, habitats with lower complexity had greater proportions inside the reserve (inside: hab1=35 %, hab2=31 %; outside: hab1=21%, hab2= 21%). Outside the reserve, hab4 had the highest proportion (inside: 23 %; outside: 35 %) while the other habitats
HABITAT
PERMANOVA Kruskal-Wallis test
Community dataset Abundance Biomass Total
abundance
Total biomass
All demersal species 0.03* Hab1 x Hab3
Hab1 x Hab4 0.07 0.31 0.41
Target species 0.18 - 0.11 0.13 0.30
Target species above MLS 0.62 - 0.11 0.55 0.60 Target species below MLS 0.88 - 0.08 0.23 0.62
Non-target species 0.05*
Hab1 x Hab2 Hab1 x Hab3 Hab1 x Hab4
21
had equal or similar proportions (Figure 6). There was no significant relationship found between the two factors, protection and habitat (Chi-square Test of Independence, p=0.33). No significant interaction between protection and habitat existed neither for abundance, nor biomass in multivariate analysis (PERMANOVA, p>0.05) (Table 4).
Figure 6: Proportions of habitat categories in the whole sampled area and by protection.
Table 4: Results of PERMANOVA for interaction between protection and habitat (SBRUV). MLS: minimum
landing size.
Factor PROTECTION x HABITAT
Statistic Main PERMANOVA
Community assemblage/ Variable Abundance Biomass
All demersal species 0.54 0.49
Target species 0.73 0.59
Target species above MLS 0.83 0.68 Target species below MLS 0.72 0.12 Non-target species 0.34 0.42
Results for key target species
Effect of protection
No protection effect was found in abundance of D. sargus, D. sargus above MLS nor below MLS (Wilcoxon test, p>0.05; Table 5), although for D. sargus above MLS the result may be considered marginally non-significant (Wilcoxon test, p=0.065). Biomass of D. sargus was found to be significantly higher inside than outside, same as for D. sargus above MLS (Wilcoxon test, p<0.01; Table 5, Figure 8). The results of comparison between reserve inside, west outside and east outside are displayed in Appendix, Table 13, showing that for D. sargus and D. sargus above MLS, the biomass was significantly greater inside reserve when compared
hab1 27% hab2 25% hab3 18% hab4 30% whole area hab1 35% hab2 31% hab3 11% hab4 23% inside hab1 21% hab2 21% hab3 23% hab4 35% outside