UNIVERSIDADE DA BEIRA INTERIOR
Ciências
Identification of biomarkers for quality control in
human biological serum samples
Ângela Afonso
Dissertação para obtenção do Grau de Mestre em
Bioquímica
(2º ciclo de estudos)
Orientador: Doutora Joana Caetano-Lopes
Co-orientador: Prof. Doutora Cândida Ascensão Teixeira Tomaz
Agradecimentos
Quando a vida nos premeia de pessoas excecionais é difícil nomear e agradecer a todas pela forma como contribuem ou contribuíram de forma a sermos melhores.
Direto ou indiretamente este trabalho foi realizado por muitas mãos. Começo por isso, a agradecer à Doutora Joana-Caetano Lopes pela orientação, pela paciência, pela amizade e acima de tudo pela enorme disponibilidade em horas de videochamadas intercontinentais. À Professora Doutora Cândida Tomaz pela sua coorientação, por todas as dúvidas e por pacientemente me ter ajudado neste trabalho.
Ao Director do Biobanco-IMM, Professor Doutor João Eurico da Fonseca a oportunidade de crescer com este projeto e acima de tudo agradecer o voto de confiança.
Este trabalho não faria sentido, nem seria possível se não tivesse o contributo da “team lab”, muito obrigada à Mestre Ana Sofia Zhao pelo conhecimento, pelo trabalho e acima de tudo pela amizade e horas de boa disposição que tanto contribuíram para me manter firme no meu objetivo; à Doutora Rita Cascão pelo conhecimento e pela ajuda preciosa na elaboração deste trabalho.
Quero ainda agradecer aos que mais me preenchem o coração, ao meu marido, pelo contributo direto neste trabalho e pelo apoio com o qual foi impossível desistir. Aos meus pais, irmã, sobrinhos e sogros que nunca deixaram de me apoiar e de me fazer sentir que era capaz. Ao meu pequeno maior amor que é por ele que este esforço faz sentido.
Abstract
Easy access to human biological samples and respective detailed clinical information is pivotal to the progress of medical knowledge, contributing to minimize the direct and indirect health costs and improve the quality of life. The concept of biobank was born in this context, as an infrastructure composed by collections of biological samples and respective clinical information.
The impact of biobanks is measured by the presence of good quality samples associated with clinical information. Biobanco-IMM, so far, has more than 80000 samples from more than 10000 donors being the most frequent sample type the serum. Quality control of serum sample has been the subject of intense debate in European meetings of biobanks. Therefore, this study aims to find potential biomarkers for quality control of the serum samples stored at Biobanco-IMM.
200 serum samples were grouped according to the time after sampling, time to freezing, duration of storage or number of freeze-thaw cycles and were compared with a control group of samples that were processed according to the Biobanco-IMM standards. CD40L, GM-CSF, IL-1a, G-CSF and VEGF were measured in the serum by ELISA.
The results show that IL-1a and G-CSF have significant differences in the study groups wherein the analysis of the ROC curves found a cutoff of 33.9 pg/ml with 100% sensitivity for IL-1a, and a cutoff of 78.4 pg/mL with 65% specificity to G-CSF. Thus, these can act as biomarkers for serum quality control.
Keywords
Resumo
A necessidade do rápido acesso a amostras biológicas humanas e respetiva informação clínica com elevada qualidade é fundamental para o avanço científico e médico, contribuindo para a redução dos custos diretos e indiretos com a saúde, bem como para uma melhoria na qualidade de vida dos doentes. É neste contexto que nasce o conceito de biobanco, uma infra-estrutura composta por coleções de amostras biológicas e respetiva informação clínica.
O impacto dos biobancos é medido pela presença de amostras de boa qualidade com informação clínica detalhada. O Biobanco-IMM tem até agora mais de 80 mil amostras de mais de 10000 dadores, sendo a amostra mais frequente o soro. O controlo de qualidade de amostras do soro tem sido objeto de grande debate. Desta forma, este estudo tem como objetivo encontrar possíveis biomarcadores de controlo de qualidade para as amostras de soro armazenadas no Biobanco-IMM.
A qualidade das amostras de soro pode ser afetada por inúmeros fatores, como por exemplo, o aumento do tempo até centrifugação e o aumento do tempo até congelação que podem influenciar a cascata de coagulação. Por sua vez o tempo de centrifugação e a exposição a temperaturas elevadas influenciam a eficiência de separação de células. Os próprios componentes poliméricos que podem ser libertados pelos vários tipos de tubos de colheita, podem afetar alguns imunoensaios. Desta é crucial a identificação de marcadores biológicos que sejam sensíveis o suficiente para avaliar a qualidade das amostras aquando de desvios ao processamento, como o aumento do tempo até processamento e congelamento, a duração do armazenamento e do número de ciclos de congelamento e descongelamento. Um bom biomarcador sérico para avaliar a qualidade do soro deve ser transversal a todas as amostras, sejam elas provenientes de dadores com patologia ou saudáveis e mostra uma perda de atividade significativa em condições inadequadas de armazenamento.
No que respeita à qualidade das amostras de soro, várias moléculas têm sido propostas para o controlo de qualidade, por exemplo: Receptor da Transferrina, Ácido Ascórbico, Potássio, GM-CSF, IL-1a, G-GM-CSF, péptidos C3F, fibrinopeptide A, ACTH, CD40L, VEGF e MMP-7.
Neste estudo focamo-nos em 5 proteínas (CD40L, GM-CSF, IL-1a, G-CSF e VEGF) que estão presentes no soro, que de acordo com a literatura, podem ser utilizados como biomarcadores para o seu controlo de qualidade. Estas moléculas são as que atualmente possuem maior número de referências na literatura e são apontadas como sendo as indicadas para verificar a qualidade das amostras com os seguintes desvios ao procedimento: aumento do tempo de pré-centrifugação, aumento do tempo até congelamento, número de ciclos de congelamento e descongelamento e tempo de armazenamento.
Neste trabalho, 200 amostras foram dividas em 5 grupos de estudo: controlos, tempo até centrifugação, tempo até congelamento, ciclos de congelamento/descongelamento e tempo de armazenamento. Os níveis dos séricos de CD-40L, GM-CSF, IL-1a, G-CSF e VEGF quantificados por ELISA.
Os resultados mostram que IL-1a e G-CSF possuem diferenças significativas nos grupos de estudo sendo que da análise das curvas ROC se estabeleceu um cutoff de 33.9 pg/ml com 100% de sensibilidade para IL-1a e um cutoff de 78.4 pg/ml com 65% de especificidade para o G-CSF. Desta forma estes poderão ser apontados como biomarcadores para o controlo de qualidade de amostras de soro.
Palavras-chave
Contents
Introduction ... 19
1.1 Biobanco-IMM, Lisbon Academic Medical Center ... 22
1.2 Biobanco-IMM, Lisbon Academic Medical Center organization ... 24
1.3 Sample Quality ... 27
1.4 Serum ... 29
Aim ... 33
Materials and Methods ... 35
3.1 Samples ... 35
3.2 Laboratory methods ... 36
Basic ELISA Procedure ... 36
Direct ELISA ... 37
Direct detection ... 38
Assay Procedure for CD40L ... 38
Assay Procedure for IL-1a, G-CSF, GM-CSF and VEGF ... 40
3.4 Statistical analyses ... 41
Results ... 43
4.1 Performance of the biomarkers standards ... 43
4.2 Serum concentration of study biomarkers ... 45
CD40L ... 45 IL-1a ... 48 G-CSF ... 50 GM-CSF ... 53 VEGF ... 56 Discussion ... 59 Conclusion ... 63 References ... 65 Attachments ... 69
List of Figures
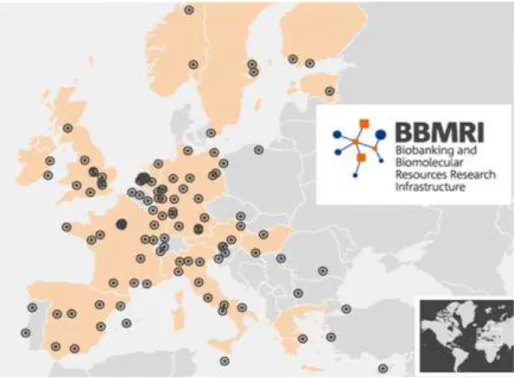
Figure 1 - Distribution of Biobanks in Europe according to BBMRI. ... 19
Figure 2 - Technological advances, procedure automation, software development in Biobank. ... 20
Figure 3 - Stem cells biobanks ... 21
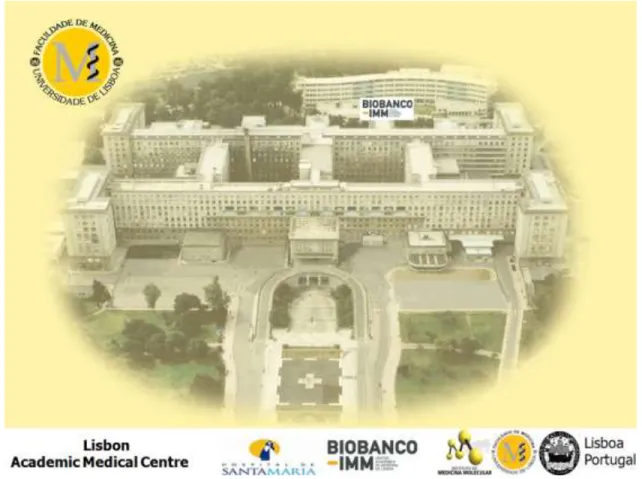
Figure 4 - Biobanco-IMM localization and organization of Biobanco-IMM. ... 22
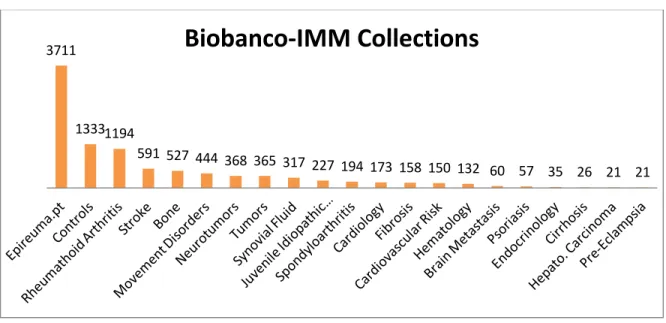
Figure 5 - Most representative collections of Biobanco-IMM. ... 23
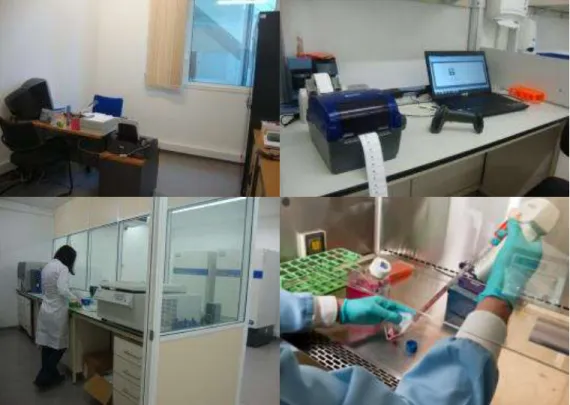
Figure 6 - Biobanco-IMM facilities... 24
Figure 7 - Workflow of Biobanco-IMM, including the data and sample collection, processing and storage ... 26
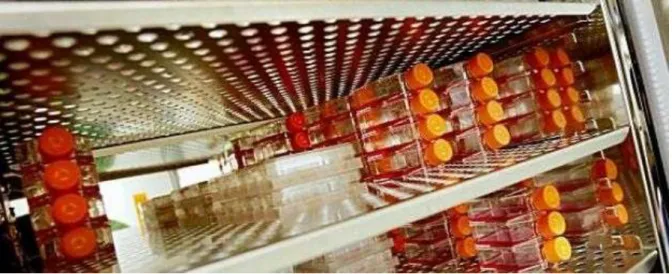
Figure 8 - The different samples types storage at Biobanco-IMM. ... 27
Figure 9 - ELISA overview flowchart and schematic. ... 37
Figure 10 - Direct Elisa scheme ... 38
Figure 11 - Multiplex Technologies for ELISA used to measure IL-1Aa, G-CSF, GM-CSF and VEGF ... 39
Figure 12 - Standard curve for CD40L. ... 45
Figure 13 – Concentrations of CD40L in the different groups of study.. ... 46
Figure 14 - ROC Curve for CD40L . ... 47
Figure 15 - Non-linear regression (5PL) for IL-1a . ... 48
Figure 16 - Concentrations of IL-1a in the different groups of study.. ... 49
Figure 17 - ROC Curve for IL-1a . ... 50
Figure 18 - Non-linear regression (5PL) for G-CSF. ... 50
Figure 19 - Concentrations of G-CSF in the different groups of study.. ... 51
Figure 20 - ROC Curve for G-CSF. ... 52
Figure 21 - Non-linear regression (5PL) for GM-CSF ... 53
Figure 22 - Concentrations of GM-CSF in the different groups of study. ... 54
Figure 23 - ROC Curve for GM-CSF. ... 55
Figure 24 - Non-linear regression (5PL) for VEGF. ... 56
Figure 25 - Concentrations of VEGF in the different groups of study. ... 57
List of Tables
Table 1 - Standard Performance. Expected and observed concentration was calculated for
each standard. ... 43
Table 2 - Lower and Higher detection limit for each standard. ... 44
Table 3 - Concentrations, IQR and %CV of CD40L in the different study groups... 45
Table 4 - Median concentrations, IQR and %CV of IL-1a in the different study groups. ... 48
Table 5 - Median concentrations, IQR and %CV of G-CSF in the different study groups. ... 51
Table 6 - Median concentrations, IQR and %CV of GM-CSF in the different groups of study. .. 53
List of Abbreviations
ACTH Adrenocorticotropic hormone
AP Alkaline Phosphatase
AUC Area Under the Curve
BBMRI Biobanking and Biomolecular Resources Research Infrastructure BRISQ Biospecimen Reporting for Improved Study Quality
CD40L CD40 ligand
CNPD Comissão Nacional de Proteção de Dados
CV Coeficient of Variation
DNA Deoxyribonucleic Acid
ELISA Enzyme-Linked Immunosorbent Assay G-CSF Granulocyte-colony stimulating factor
GM-CSF Granulocyte macrophage colony-stimulating factor
HRP Horseradish Peroxidase
IL-1a Interleukin-1 alpha
IMM Instituto de Medicina Molecular IPSCs Pluripotent stem cells
IQR Interquartile Range
LIMS Laboratory Information Management System MMP-7 Matrix Metalloproteinase-7
RIN RNA Integrity Number
RNA Ribonucleic Acid
ROC Receiver Operating Characteristic
SEM Standard Error of Median
SOP Standard Operating Procedures
TMB 3,3',5,5'-Tetramethylbenzidine
TNF Tumor Necrosis Factors
Introduction
A biobank is a biorepository that processes, stores and distributes biospecimens and associated data for use in research. The concept of biobank includes collections of plant or animal biospecimens, including human specimens but for the purposes of this dissertation, we will focus on human biobanks [1].
The aims of biobanking have changed dramatically over the past years [2]. Biobanks started as university-based repositories that were developed for the research needs of specific projects [1]. However, they gradually evolved for institutional and commercial (for-profit) biorepositories, population-based biobanks and most recently, virtual biobanks. The clinical data associated with biological samples have increased, from information such as date of collection and disease, to extensive information like patient phenotype, and now rapidly extending into genetics, proteomics, and other “omics” [3,4]. Population-wide biobanks have been developed in several countries, including Iceland, United Kingdom, Sweden, Denmark, Estonia, Canada, South Korea, Japan, Singapore, USA, Spain, Italy and now Portugal.
Figure 1 - Distribution of Biobanks in Europe according to BBMRI.(Adapted from BBMRI)
These major biobanks have been created in order to collect, analyze and store clinical information on representative samples of the country’s population [2]. Virtual biobanks are an important tool developed to help investigators locate biospecimens and for data mining from multiple biobanks in dispersed locations [3]. Virtual biobanks are accessed using specialized
software or web portals designed to connect biobanks and investigators throughout the world [1,2]. In this field, networks play an important role. BBMRI (Biobanking and Biomolecular Resources Research Infrastructure) was created in 2008 with the aim of connecting all the European biobanks together in a network.
The field of biorepository and biospecimen science is changing in response to the evolutionary needs of investigators and projects that use biobanks, as well as to external regulatory and related pressures. The emerging fields such as proteomics, genomics and personalized medicine as well as the increased precision and the development of new technologies led to a change in biobanks behavior [4], demanding high quality specimens with accurate, reliable, standardized clinical and laboratory data. Thus, optimum collection, processing, storage, tracking and shipment of biospecimens are key to the outcome of a multitude of studies [5].
Technological advances, procedure automation, software development and the Web have revolutionized the management of biobanks. Data and location can now be maintained in a database and biobanks are now able to invest in robotics to expedite specimen processing and sampling. The internet has expanded communication between biobanks and with clients and also facilitates the establishment of virtual biobanks [4].
Software companies are developing packages that support biobanks in clinical and laboratory data management and handling [6]. Biobanks host collections including those from epidemiological cohorts, clinical trials, and diagnostic and etiopathogenesis studies. Large
population biobanks have become common in the last years [7]. One example is the UK biobank, which was created after a decade of careful planning with the goal of improving the prevention, diagnosis and treatment of a wide range of serious and life-threatening illnesses, including cancer, cardiovascular disease, diabetes, osteoporosis, depression and forms of dementia. The UK Biobank recruited 500.000 people aged 40-69 years between 2006-2010 [6,8].
Depending on the purpose and reason, there are several types of biobanks: disease oriented biobanks, population-based biobanks, case-control biobanks, tissue biobanks, biobanking within the context of clinical trials, biomolecular resource centers (antibodies, etc.), biobanks for cells (cord blood, stem cells), and so forth [9]. The ability of embryonic and adult stem cells to give rise to any cell tissue type (hematopoietic and mesenchymal lineages) has led to enormous interest in their use in translational and clinical approaches.
Figure 3 - Stem cells biobanks. (Adapted Biotechnology Calendar)
Therefore, stem cell biobanks have received much attention as a new biologic resource for medical research as well as clinical transplant applications. In the last 10 years, embryonic and adult stem cell banks have been developed around the world [9]. More recently induced pluripotent stem cells (iPSCs) banks have also emerged as other potential sources for medical research and clinical applications. Currently, iPSCs derived from adult human somatic cells are used in several research areas (drug development, drug screening, disease models, etc.). In addition, iPSCs opened a new field of stem cell based therapeutic strategies for a large number of human diseases such as neurological diseases, heart disorders, liver diseases, diabetes, among others [4,10].
1.1 Biobanco-IMM, Lisbon Academic Medical Center
In order to better understand what a biobank is, how can it be created and how can it be useful for a clinician, the Biobanco-IMM, Lisbon Academic Medical Centre will be used as a case study. This biobank is part of the Lisbon Academic Medical Centre, and is located at the Egas Moniz building, on the campus that hosts the Faculty of Medicine of the University of Lisbon, as well as the Santa Maria University Hospital and the Instituto de Medicina Molecular (IMM).
Figure 4 - Biobanco-IMM localization and organization of Biobanco-IMM. (Source:Biobanco-IMM)
The vision of the Biobanco-IMM, Lisbon Academic Medical Centre, is to position itself as a major member of the European Network of Biobanks within the next 5 years, offering excellent opportunities for translational and clinical research. Its mission is to promote and facilitate biomedical research that will lead to the identification of new diagnostic and prognostic tests and new therapeutic targets. This biobank has set as goals to collect a wide variety of high quality human biological samples associated with detailed relevant clinical information and to promote its use for research purposes based on scientific and ethical criteria [11].
The project of building a biobank at the Lisbon Academic Medical Centre started in 2008. During the first two years, three goals were achieved: attraction of funding (Alto Comissariado Para a
Saúde), approval from Santa Maria University Hospital Ethics Committee and the first samples were received on an experimental basis. After that, a 2 years executive phase started, with a strategic plan that previewed the end of all the preparatory activities (including physical space, equipment, information system, training and legal / ethical authorizations, experimental phase of the operational procedures, standard operating procedures (SOP) and certification) in one year, leaving the second year for testing the model in real-life conditions [11]. In fact, by January 2012 Biobanco-IMM, Lisbon Academic Medical Centre officially entered in its full operational capacity and started to receive samples in a complete open way. A dissemination plan involved a formal opening event, interaction with media, informative sessions in all medical departments of the Lisbon Academic Medical Centre and in all Lisbon Hospitals that have shown interest on receiving information, collaboration with patient’s associations and scientific societies and presence in public events [11]. The interest raised allowed reaching more than 10500 donors and 87000 samples up to now.
Figure 5 - Most representative collections of Biobanco-IMM. (Source:Biobanco-IMM)
The Biobanco-IMM, Lisbon Academic Medical Centre is now participating in several international networks and samples are being requested for research projects all over the world.
3711
1333 1194
591 527 444 368 365 317 227 194 173 158 150 132 60 57 35 26 21 21
1.2 Biobanco-IMM, Lisbon Academic Medical Center organization
The Biobanco-IMM, Lisbon Academic Medical Centre has an office space, a room for sample collection, a laboratory for sample processing, a cold room and a culture room. The biological samples are stored in the cold room, which contains -80ºC ultrafreezers and -196ºC liquid nitrogen containers. This room is thermally controlled and the freezing equipment has a temperature control system to ensure optimal conditions and rapid detection when a fault occurs. The cold room and the laboratory have restricted access and are exclusively dedicated to the biobank samples. In addition to sample storage, this biobank provides other services, such as primary cell culture and automatic nucleic acid extraction.The Biobanco-IMM, Lisbon Academic Medical Centre is organized in collections (samples and associated clinical information that share a certain characteristic, for instance, individuals who have the diagnosis of Parkinson’s Disease). A researcher expert in the field acts as the Principal Investigator of each collection and is responsible for the planning of the clinical data to be collected and the type of biological samples that are stored. Dedicated software for sample and clinical information management can be customized according to the specific needs of each collection by the biobank staff members [11].
The Biobanco-IMM, Lisbon Academic Medical Centre, is authorized by the Portuguese National Commission for Data Protection and the Ethics Committee of Santa Maria University Hospital for
the collection of personal data and human biological samples, respectively. This biobank ensures that the stored material is high quality and manages the request of samples, all in accordance to approved SOPs [12,13]. It also guaranties that projects submitted to use samples comply with scientific and ethical requirements, after previous external approval by an Ethics Committee. A team of nine staff members, with laboratorial and medical backgrounds take care of all the operational activities and is supported by a Scientific Commission (composed by basic scientists and clinical researchers) and a Technical Commission (encompassing more eclectic knowledge, such as law and ethics, management, engineering and informatics). These commissions meet every 3 months with the staff members or whenever necessary. The Biobanco-IMM, Lisbon Academic Medical Centre is managed by its Director, who reports directly to the IMM Direction and ultimately to the direction of the Lisbon Academic Medical Centre (composed by the clinical director of Santa Maria University Hospital, the director of the medical school and IMM’s president) [11].
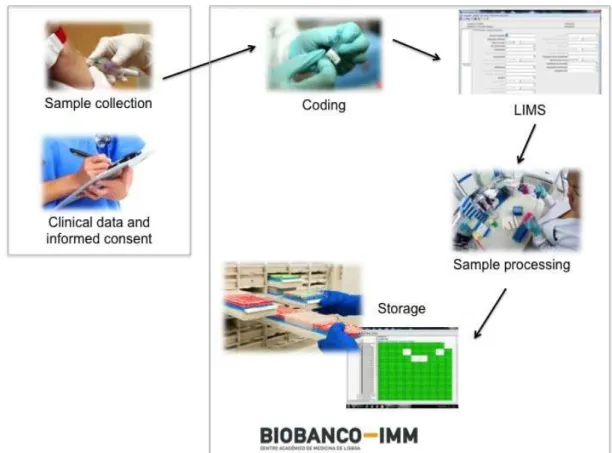
When a sample and correspondent clinical information is collected, a written informed consent specifically approved by the Ethics Committee of Santa Maria University Hospital and by the Portuguese National Commission for Data Protection is signed by the donor [12]. This document informs the donor about the future use of his/her samples and his/her clinical data, where it will be maintained, who can use it and how will his/her privacy will be protected. This informed consent allows the donor to decide which level constraints give to his/her samples [12,13]. For example the donor can decide whether or not to be contacted if something relevant to his/her health is discovered.
The Biobanco-IMM, Lisbon Academic Medical Centre ensures anonymity and confidentiality of data and samples during all operations [11].
Figure 7 - Workflow of Biobanco-IMM, including the data and sample collection, processing and storage. (Source: Biobanco-IMM)
This biobank is affiliated to Biobanking and BioMolecular Resources Research Infrastructure (BBMRI) and any researcher can request a sample from Biobanco-IMM, Lisbon Academic Medical Centre. When samples are request by a researcher external to the principal investigator responsible for the collection, the contact is redirected to the principal investigator in order to discuss a possible scientific collaboration. All applications must be approved by an Ethics Committee and by Biobanco-IMM, Lisbon Academic Medical Center Scientific Committee. Access to rare and potentially limited samples is carefully coordinated and controlled. All publications based on samples provided by the Biobanco-IMM, Lisbon Academic Medical Centre are required to make explicit reference to that fact [11].
1.3 Sample Quality
A key item on biobanking is sample quality [10,14]. The lifecycle of a sample starts with its transport from the site of harvest to the processing site for long-term storage [7,15]. Firstly, we have to take into consideration the pre-analytical phase of the sample collection, which is split into two phases: the pre-acquisition phase which can take place before the actual contact with the biobank staff and the acquisition phase when these samples are under the supervision of the biobank personnel [10,16]. During the pre-acquisition phase, a number of circumstances have to be considered. For example, it is importance to know if the donor was under any form of treatment with drugs such as antibiotics, anticoagulants or anesthetics. Another quality indicator during the pre-acquisition phase is lag time, the time between harvesting the specimen and freezing it [4,17]. After all these have been taken into consideration, it is advisable, when possible, for samples to be stored in different formats (e.g., blood: whole blood, and serum). This rule is not only in accordance to international guides of conduct but also facilitates the implementation of modern technological processes through a wider array of samples which, in turn, adds up to the value of those specific samples [10,16,18].
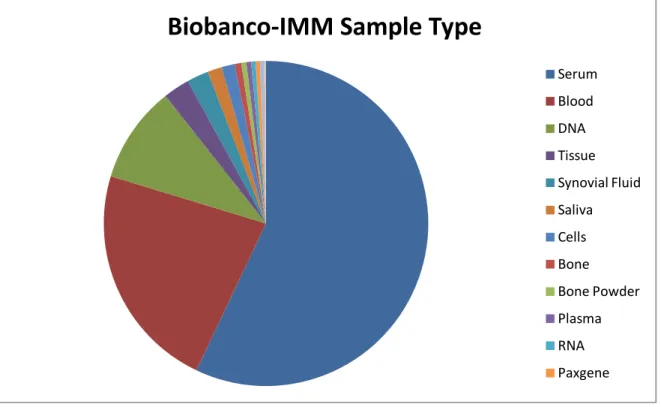
Figure 8 - The different samples types storage at Biobanco-IMM. (Source:Biobanco-IMM)
The type and how a sample is collected depend on the downstream procedures where it will be used. Different samples require different procedures prior to storage. For example, in the case of
Biobanco-IMM Sample Type
Serum Blood DNA Tissue Synovial Fluid Saliva Cells Bone Bone Powder Plasma RNA Paxgene
tissues, the sample must be kept on ice when collected until it can be snap frozen, particularly if it is to be used in molecular studies [10]. On the other hand, blood samples can be transported at 4ºC until they reach the Biobanco-IMM facilities. But in this case if during transport, the serum tubes are not properly packed they can spill or hemolysis of the sample can occur [19]. The transport temperature is also a very important point to keep in mind. If dry ice shipment is required (e.g. for plasma, serum, cell lines or tissues) attention must be given to the quantity of dry ice placed in the box and the time between shipment and arrival [20]. In order to harmonize all the proceedings, a Standard Operation Procedure manual was made [20,21].
The routine use and collection of blood samples for clinical diagnosis has provided general information on optimal methodologies to process and store samples. One effect that should be taken into consideration is hemolysis of the specimen, as it impacts the accuracy of laboratory tests [20]. However, hemolysis can be prevented by optimizing needle size, proper handling of the tubes and pipetting techniques, as described in the SOPs for handling of blood samples [19,22]. At Biobanco-IMM, only 4.2% of the serum samples collected until now have a negative quality control report and the higher incidence of hemolysis may be related with temperature, since we identified higher numbers of hemolyzed serum in the colder and warmer months [20,22]. Concerning the DNA extraction the quality control procedure consists in the absorbance ratio at 260 and 280nm and the run profile of 1% agarose gel. Samples with quality are those with concentrations above 10ng/μl, absorbance ratio between 1.7 and 2.0 and marked bands in the gel. According to these criteria we considered that 4.6% of the DNA samples fail the quality control. In the case of tissues, the samples quality control is more stringent, samples are only included in the Biobanco-IMM if they pass the quality control for DNA, RNA and tissue integrity.
Once the most critical points in a biospecimen processing method have been identified, specific tests or markers to assess the quality of the biospecimen are needed. These may be called surrogate quality biomarkers or surrogate quality indicators [7]. At present, there are few appropriate quality control tools that either are predictive of downstream method feasibility and reliability or are diagnostic of upstream biospecimen processing steps (eg, tissue fixation time)[22]. Different Quality Control assays are used to characterize viable and nonviable biospecimens. In the first case, viability and functionality (eg, pluripotency, response to antigens, motility) are assessed through microscopy, flow cytometry, or immunoenzymatic assays. In the case of nonviable specimens, molecular integrity (eg, protein phosphorylation status, epitope conformation, rRNA degradation, DNA cross-linking degree) is generally assessed through immunoenzymatic, electrophoretic, and molecular biologic assays [5,23]. It is critical to define and standardize the assays used to assess the molecular integrity of biospecimens procured in a clinical setting, because there is no consensus in the literature on which biospecimen quality markers or tools provide the best biospecimen molecular diagnostic
performance and information [24,25]. For example, standard approaches to assessing RNA integrity, such as ribosomal RNA measurements and RNA integrity number (RIN), are neither sensitive nor specific enough to assess potential bias in downstream gene expression analysis [20,26]. Several steps are needed to solve these issues. First, the scientific community must agree on the elements from the life cycle of the biospecimen that should be documented in scientific publications, as has been proposed in the Biospecimen Reporting for Improved Study Quality (BRISQ) recommendations. Second, these elements must be codified, so that recording and communication is standardized [7,23].
1.4 Serum
Quality of serum samples, as well as the quality of the analysis obtained from these samples, depends on the biological and pre-analytical variations that exist in the sample. Biological variation includes sex, age, hormonal status, morphometry, biological rhythms, exercise, xenobiotics, nutrition, smoking and genetic factors [24]. Biological variation is beyond the control of the biobank. However, the biobank does have control over specimen-associated pre-analytical variation [25].
The impact of preanalytical variantion is diverse. The time delay and storage temperature before processing influence the extent of the clot formation, cross-linking and fibrinolysis. Centrifugation time, force and temperature influence the efficiency of cell separation. The activation status of blood cells may change upon exposure to extracellular factors [26]. Environmental surfaces, during and after the phlebotomy, may modify gene expression levels [27]. Polymeric components are released by many types of collection tubes and in some cases quantitative immunoassays can be unpredictably affected by components released from blood collection tubes [28]. There is no blood collection procedure that will universally block proteases activities [5,20]. Prolongation of sampling time may stimulate the secretion of prolactin or increase the concentration of certain proteins in the serum. Time of sampling has an influence on hormone levels, subject to diurnal or menstrual cycles [20,29]. Storage-associated pre-analytical variation includes the time after sampling and freezing, the storage temperature and protocol, the duration of storage and the number of freeze-thaw cycles [23,25]. We need to identify serum biomarkers that are sensitive enough to variations of time after sampling and freezing and the duration of storage and the number of freeze-thaw cycles attesting the quality of samples stored at Biobanco-IMM. An ideal serum biomarker used for quality control should be ubiquitous and show 100% loss of activity upon inadequate storage conditions, delay time of sampling and temperature variations.
Concerning the quality of serum sample many molecules have been proposed for the quality control for example: Transferrin Receptor, Ascorbic Acid, Potassium, GM-CSF, IL-1a, G-CSF, C3f peptides, fibrinopeptide A, ACTH, CD40L, VEGF and MMP-7
Thus, we will focus only on 5 proteins (CD40L, GM-CSF, IL-1a, G-CSF and VEGF) present is serum that, according to the literature, may be used as biomarkers for quality control of these samples [20]. We choose only this 5 molecules because they have more references in literature and they are related to the parameters that we want to study, for example, the pre-centrifugation, the delay of freezing, freezing-thaw cycles and duration of storage.
CD40L. The CD40-ligand is a member of the TNF family. CD40/CD40L interaction is an essential signal for B cell proliferation, expression of activation markers, immunoglobulin production, and isotype switching. CD40/CD40L interaction is also required for formation of memory B cells and germinal centers, and signaling through CD40 prevents apoptosis of germinal center B cells. Defective expression of CD40L in humans leads to an inability to produce isotypes other than IgM (hyper IgM syndrome), and to absence of germinal centers [30]. Some studies reported soluble CD40L (sCD40L) as a quality control marker that allows assessment of serum exposure to elevated temperatures. It was found that sCD40L, measured by ELISA, undergoes complete degradation in 12 hours at 37ºC or in 48 hours at room temperature. However, freeze-thaw cycles had no effect on CD40L levels in serum. The reference values for this protein range from 7 to 17 ng/mL, and the precise threshold below which significant exposure to elevated temperatures can be ascertained as 4.3 ng/mL [20,31].
VEGF. Vascular Endothelial Growth Factor (VEGF), also called VEGF-A, belongs to the cysteine-knot superfamily of growth factors that are characterized by the presence of eight conserved cysteine residues. VEGF has endothelial cell-specific mitogenic activity and stimulates in vivo angiogenesis. VEGF also stimulates vascular permeability [32]. Studies showed that VEGF in serum is sensitive to freeze-thaw cycles and to storage duration either at -20ºC or at -80ºC. When VEGF was measured by ELISA, it became undetectable after one to six freeze-thaw cycles. The VEGF reference range reported by enzyme immunoassay kit manufacturers is between 62 and 707 pg/mL in serum. Although the results reported by Kisand et al. seem interesting, the ability of VEGF exposed to freeze-thaw cycles has not been confirmed. They tested the stability of VEGF in serum samples were frozen and then thawed up to six times. The impact of storage temperature was investigated using an accelerated stability testing protocol. Stability at -20°C and -75°C was calculated using the Arrhenius equation. Results of this study revealed that a temperature -20°C is unsuitable for prolonged storage of the biomarkers investigated, and repeated thawing of sera is not recommended. VEGF is especially unstable and should be quantitated using serum that has never been frozen [33].
GM-CSF, IL-1a, and G-CSF. Granulocyte-macrophage colony-stimulating factor (GM-CSF) is an important hematopoietic growth factor and immune modulator. GM-CSF also has profound effects on the functional activities of various circulating leukocytes. It is produced by a variety of cell types including T cells, macrophages, endothelial cells and fibroblasts [34,35]. Interleukin-1 alpha (IL-1a) is a member of the interleukin 1 cytokine family. This cytokine is a pleiotropic cytokine involved in various immune responses, inflammatory processes, and hematopoiesis and is produced by monocytes and macrophages as a pro-protein, which is processed and released in response to cell injury, and thus induces apoptosis [36]. It has been suggested that polymorphism on IL-1 genes is associated with rheumatoid arthritis and Alzheimer's disease [20,36].
Granulocyte colony stimulating factor (G-CSF) is a glycoprotein which stimulates the survival, proliferation, differentiation and function of neutrophil granulocyte progenitor cells and mature neutrophils [37]. The two forms of recombinant human G-CSF in clinical use (filgrastim and lenograstim) are potent stimulants of neutrophil granulopoiesis and have demonstrated efficacy in preventing infectious complications of some neutropenic states. They can be used to accelerate neutrophil recovery from myelosuppressive treatments [38]. A 2-hour pre-centrifugation delay at room temperature induced an 11- to 20-fold increase of GM-CSF, IL-1a, and G-CSF in blood collected without protease inhibitors and a 7- to 10-fold increase of the same proteins in blood collected with protease inhibitors [39]. Baseline reference levels were reported as 214 -163 pg/mL for GM-CSF, 9.4 -7.7 pg/mL for IL-1a, and 119-60 pg/mL for G-CSF [20, 35, 40].
Aim
At Biobanco-IMM, quality control of the samples is performed at the time of arrival at the storage facilities. In samples such as DNA and RNA the quality control method is standardized. However, for serum and other biological fluids there is no standard method of assessing the sample quality, which can be affected by freeze-thaw cycles, time before centrifugation, centrifugation temperature and time, etc. We believe that there should be a concern for the identification and validation of these biomarkers.
The goal of this dissertation was to identify tools (markers and assays) that can be used to assess quality variations for serum samples.
Materials and Methods
For this study, samples were chosen to represent the Biobanco-IMM samples population.
3.1 Samples
The samples from the Biobanco-IMM were organized in collections. Mostly the samples are from collection with interest in some pathology like: rheumatoid arthritis, Parkinson Disease, Stroke, Heart Failure and Tumors (including neurotumors, gastric tumors and breast tumors). For this study we also used samples from the healthy donors of the Biobanco-IMM. All the collections of the Biobanco-IMM are authorized by the ethic committee and the clinical data by Comissão Nacional de Protecção de Dados (CNPD). The information of samples was stored in a database (LIMS) completely anonymized.
All the samples were collected in serum tubes (5ml BD Vacutainer® Rapid Tubes or 5ml S-Monovette® Serum-Gel tubes, BD, USA). These tubes contains a polyacrylic ester gel that, due to
its density, forms a stable separating layer between the blood clot and the serum during centrifugation and serves as a barrier during sample transport and storage. Compliance with the recommended storage conditions will keep most parameters stable for up to 8 hours.
The serum was obtained by centrifugation at 800g for 10 minutes at 4ºC, after which was recovered and transferred into labeled 2 ml sterile screw cap cryovials in 200-250 μl aliquots and stored at -80ºC until further use.
For this study the samples were grouped according to the following parameters:
a) Time after sampling: 40 samples were centrifuged 48 hours after blood was drawn.
b) Time up to freezing: 40 samples were frozen 24h after centrifugation.
c) Duration of storage: 40 samples that are frozen for at least 3 years.
d) Number of freeze-thaw cycles: 40 samples that thawed at least 3 times.
e) Controls: 40 samples that were processed according to the Biobanco-IMM SOP (annex1) for whole blood.
3.2 Laboratory methods
The biomarkers levels were studied by enzyme-linked immunosorbent assay (ELISA). An ELISA is a common laboratory technique used to measure the concentration of an analyte (usually antibodies or antigens) in solution. The basic ELISA, or enzyme immunoassay (EIA), is distinguished from other antibody-based assays because separation of specific and non-specific interactions occurs via serial binding to a solid surface, usually a polystyrene multiwell plate, and because quantitative results can be achieved. The steps of the ELISA result in a colored end product that correlates to the amount of analyte present in the original sample.
Basic ELISA Procedure
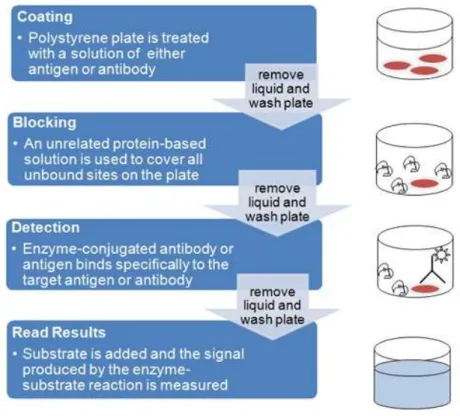
An ELISA begins with a coating step, where the first layer - either an antigen or an antibody - is adsorbed to a polystyrene 96 well plate. Coating is followed by blocking and detection steps. Since the assay uses surface binding for separation, several washes are repeated between each step to remove unbound materials. ELISAs can be quite complex, including various intervening steps and the ability to measure protein concentrations in heterogeneous samples such as blood. The most complex and varying step in the overall process is detection, where multiple layers of antibodies can be used to amplify signal.
All ELISAs rely on the specific interaction between an epitope, a small linear or three dimensional sequence of amino acids found on an antigen, and a matching antibody binding site. The antibodies used in an ELISA can be either monoclonal (derived from unique antibody producing cells called hybridomas and capable of specific binding to a single unique epitope) or polyclonal (a pool of antibodies purified from animal sera that are capable of binding to multiple epitopes). It is possible to use both monoclonal and polyclonal antibodies in an ELISA; however, polyclonal antibodies are more typically used for the secondary detection layer in indirect ELISAs, while monoclonal antibodies are more typically used for capture or primary detection of the antigen.
The ELISA provides a wealth of information in its simplest formats, but it can also be used in more complex versions to provide enhanced signal or more precise results. In our study we used direct ELISA for the detection of GM-CSF, IL-1a, G-CSF, VEGF and CD40L. Figure 9 shows all the steps for an ELISA procedure.
Figure 9 - ELISA overview flowchart and schematic. The major steps of ELISA procedure are coating, blocking, detection and finally read the results. (Source: Bio-Rad Company)
Direct ELISA
In a direct ELISA an antigen coated to a multiwell plate is detected by an antibody that has been conjugated to an enzyme. This type of ELISA has two main advantages: it’s faster, since fewer steps are required, and it’s less prone to error, since there are fewer steps and reagents involved.
ELISAs, by definition, take advantage of an enzymatic label to produce a detectible signal that is directly correlated to the antibody binding to an antigen. There are a few different types of enzymes and enzyme substrates that are typically used for ELISAs and a few slightly different methods for incorporating the enzyme step into the process. The final assay signal is measured with a spectrophotometric or fluorescent plate reader (depending upon the substrate chosen). In our case we used a direct detection.
Direct detection
Most commonly, antibodies are directly labeled with alkaline phosphatase (AP) or horseradish peroxidase (HRP). HRP and AP substrates typically produce a colored product that is read by a spectophotometer. Detection can also occur by fluorescently-labeled antibodies.
ELISAs are one of the most sensitive immunoassays available. The typical detection range for an ELISA is 0.1 to 1 fmole or 0.01 ng to 0.1 ng, with sensitivity dependent upon the particular characteristics of the antibody–antigen interaction. In addition, some substrates such as those yielding enhanced chemiluminescent or fluorescent signal, can be used to improve results. Figure10 shows how is established direct ELISA.
Figure 10 - Direct Elisa scheme. (Source: Bio-Rad Company)
Assay Procedure for CD40L
For the measurements of CD40L levels we use a simplex kit: RayBio® Human CD40L ELISA (RaybioTech, USA). This assay is an in vitro enzyme-linked immunosorbent assay for the quantitative measurement of human CD40L in serum, plasma (EDTA or heparin), cell culture supernatants and urine. This assay employs an antibody specific for human CD40L coated on a 96-well plate. Standards and samples are pipetted into the 96-wells and CD40L present in a sample is bound to the wells by the immobilized antibody. The wells are washed and biotinylated anti-human CD40L antibody is added. After washing away unbound biotinylated antibody, HRP-conjugated streptavidin is pipetted to the wells. The wells are again washed, 3,3',5,5'-Tetramethylbenzidine (TMB) substrate solution is added to the wells and color develops in proportion to the amount of CD40L bound. TMB can act as a hydrogen donor for the reduction of hydrogen peroxide to water by peroxidase enzymes such as horseradish peroxidase. The resulting diimine causes the solution to take on a blue colour, and this colour change can be read on a spectrophotometer at a wavelength of 650 nm.
The reaction can be halted by addition of acid or another stop reagent. Using sulfuric acid turns TMB yellow. The Stop Solution changes the color from blue to yellow, and the intensity of the color is measured at 450 nm. The minimum detectable dose of CD40L is typically less than 6 pg/ml.
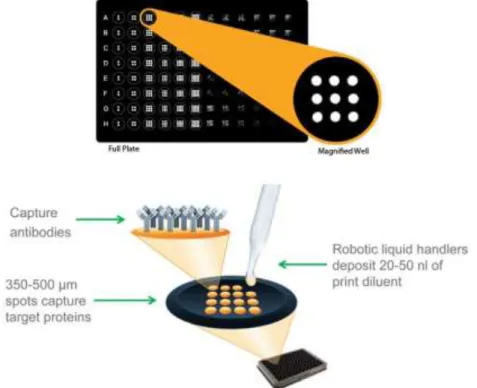
For the measurement of GM-CSF, IL-1a, G-CSF and VEGF we used a custom multiplex kit Q-Plex™ (QuansisBiosciences, USA). This assay measures the concentration of multiple proteins in each sample. Q-Plex Arrays are built by printing nano spots in defined arrays of multiple distinct capture antibodies in each well of a multiwell plate. Multiplexed ELISAs maximize data generation from each sample, and provide a low cost per data point. Figure11 shows the principle basic of this procedure.
The advantages of this technology are:
Easy to use protocol, is similar to traditional ELISA allowing to multiplex without adding complicated steps.
Using the multiplex platform, we can perform 4 ELISA tests in the same amount of time it takes to complete one conventional ELISA.
Because we can test 4 assays in a single well, you get more results from each precious sample.
Figure 11 - Multiplex Technologies for ELISA used to measure IL-1Aa, G-CSF, GM-CSF and VEGF. Q-Plex Arrays are built by printing nano spots in defined arrays of multiple distinct capture antibodies in each well of a multiwell plate. (Source: Quansys Biosciences)
Using a single kit to test multiple assays is more cost-effective than testing multiple individual kits; we will save on the price of the kit and the labor associated with performing the assays.
We can read the results by chemiluminescence.
Assay Procedure for IL-1a, G-CSF, GM-CSF and VEGF
For this assay we reconstituted the lyophilized vials by adding the indicated amount of diluents. To prepare the standard curve we added the sample diluent according to the Antigen Standard Card. All the samples were prepared with sample diluent. We loaded the standards and samples onto the plate and were incubate for 1 hour at room temperature, with shaking at 500 RPM. After this step we washed the plate 3 times and added the detection mix, and incubating for 1 hour at room temperature, shaking at 500 RPM. Once again we repeated the washing procedure and we added the Streptavidin HRP 1X. After this, we were incubating for 15 minutes at room temperature, with shaking at 500 RPM. At the same time we mixed equal volumes of Substrate A and Substrate B and allow the solution to sit at room temperature. Once again we repeated the washing procedure 6 times and we added the mixed Substrate. Finally we captured an image of the plate.
The minimum concentration detectable for these kits is typically less than 6 pg/ml.The measurement of CD40L was made in a Multimode microplate reader by Tecan (Model: Infinite M200) for the remaining analytes the image of plate was captured by Chemidoc XRS+ by Bio-Rad. Standard curves for each biomarker were generated using the premixed lyophilized standards provided in the kits. Serial 7-fold dilutions of the standards were run. Biomarkers concentrations in samples were determined from the standard curve using an 8-point-regression to transform mean observances intensities into concentrations. Each sample was run in duplicate and the average of the duplicates was used as the measured concentration.
3.4 Statistical analyses
Statistical analysis was performed using the software IBM SPSS statistics (version 21, SPSS inc, USA). Data is presented as mean ± standard error of mean (SEM) or median, interquartile range (IQR) and %CV. The distribution of each variable was tested using Shapiro-Wilk test and biomarkers concentrations were compared by the nonparametric Mann-Whitney test. Fisher’s exact test was used to compare the percentage of undetectable biomarker concentrations across groups. Receiver operating characteristic (ROC) curves were performed for each test comparing the results from the control and test groups for each one of the analysed biomarkers. A cut-off point was determined as the value of the parameter corresponding to the highest sensitivity without lowering the specificity. The area under the curve (AUC) was also determined. The significance level for the p values was set at 0.05.
Results
4.1 Performance of the biomarkers standards
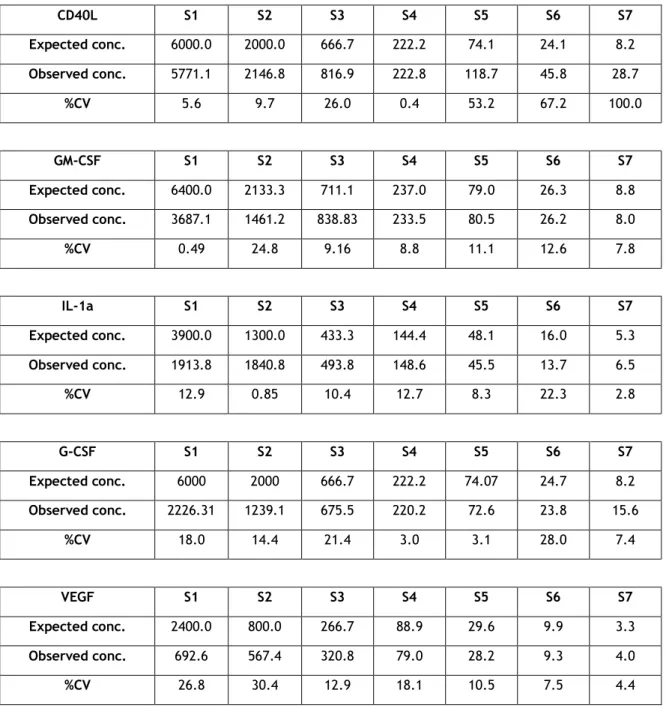
All assays were performed using the same lot of biomarker standards in order to minimize inter-plate variation. The coefficients of variation of each dilution of the standards from all inter-plates and the means of those %CVs are presented in Table 1. The expected concentration and mean of the observed concentration of each biomarker are also in Table1.
Table 1 - Standard Performance. Expected and observed concentration was calculated for each standard.
CD40L S1 S2 S3 S4 S5 S6 S7 Expected conc. 6000.0 2000.0 666.7 222.2 74.1 24.1 8.2 Observed conc. 5771.1 2146.8 816.9 222.8 118.7 45.8 28.7 %CV 5.6 9.7 26.0 0.4 53.2 67.2 100.0 GM-CSF S1 S2 S3 S4 S5 S6 S7 Expected conc. 6400.0 2133.3 711.1 237.0 79.0 26.3 8.8 Observed conc. 3687.1 1461.2 838.83 233.5 80.5 26.2 8.0 %CV 0.49 24.8 9.16 8.8 11.1 12.6 7.8 IL-1a S1 S2 S3 S4 S5 S6 S7 Expected conc. 3900.0 1300.0 433.3 144.4 48.1 16.0 5.3 Observed conc. 1913.8 1840.8 493.8 148.6 45.5 13.7 6.5 %CV 12.9 0.85 10.4 12.7 8.3 22.3 2.8 G-CSF S1 S2 S3 S4 S5 S6 S7 Expected conc. 6000 2000 666.7 222.2 74.07 24.7 8.2 Observed conc. 2226.31 1239.1 675.5 220.2 72.6 23.8 15.6 %CV 18.0 14.4 21.4 3.0 3.1 28.0 7.4 VEGF S1 S2 S3 S4 S5 S6 S7 Expected conc. 2400.0 800.0 266.7 88.9 29.6 9.9 3.3 Observed conc. 692.6 567.4 320.8 79.0 28.2 9.3 4.0 %CV 26.8 30.4 12.9 18.1 10.5 7.5 4.4
The limit of detection of the standards (lower and higher) generated by the standard curve was averaged, showing the dynamic range of each analyte; results are presented in Table2 as mean±SEM and %CV (n=5). The lower and uppers limits of detection ranged from 8.2 to 5617.1pg/mL. The highest variation in the lower limit of detection was observed for GM-CSF (79.0%) while the greatest variation in the higher limit of detection was observed for VEGF (38.7%).
Table 2 - Lower and Higher detection limit for each standard.
Standards Lower Detection Limit Standards Upper Detection Limit
Mean SE CV Mean SE CV (pg/mL) (pg/mL) (%) (pg/mL) (pg/mL) (%) CD40L 36.1 7.7 21.4 CD40L 5617.1 453.4 8.1 IL-1a 47.3 3.0 6.3 IL-1a 1449.8 55.6 3.8 GM-CSF 46.7 36.9 79.0 GM-CSF 1844.7 238.4 11.8 G-CSF 74.4 1.4 1.9 G-CSF 1852.0 128.6 6.9 VEGF 8.2 0.4 4.9 VEGF 1812.8 701.3 38.7
4.2 Serum concentration of study biomarkers
CD40L
A linear regression was used to calculate the concentrations of CD40L (figure 12).
Figure 12 - Standard curve for CD40L and linear regression with the equation (y = 0.0005x + 0.1176) and R² = 0.9834.
The R² value (R²=0.9834) confirmed the linear behavior of the curve and the equation allowed the calculation of the median concentrations and IQR (table 3)
Table 3 - Concentrations, IQR and %CV of CD40L in the different study groups.
Study Group Concentration
(pg/ml)
IQR %CV %undetectable p-value
Controls 215.3 [6-1276] 94.1% 0
Time after sampling 579.5 [44-1238] 49.9% 2.6% <0.0001
Time up to freezing 196.5 [9-1219] 192.3% 0 0.393
Number of freeze-thaw cycles
1.4 [1-1123] 173.7% 20% <0.0001
Duration of storage 56.3 [20-616] 119.0% 7.9% 0.001
IQR-Interquatile Ranges; CV-Coefficient of Variation
The Mann-Whitney test showed significant differences in concentrations of CD40L in time after sampling group (p<0.0001), number of freeze-thaw cycles group (p<0.0001) and duration of storage (p=0.001) compared to control (figure 13).
y = 0.0005x + 0.1176 R² = 0.9834 0 0.5 1 1.5 2 2.5 3 3.5 0 1000 2000 3000 4000 5000 6000 7000
The highest number of undetectable concentrations was registered in the number of freeze-thaw cycles group (20%, p-value=0.005) with significant difference when comparing to the control group. No other differences were found between groups regarding the percentage of undetectable concentration.
Figure 13 – Concentrations of CD40L in the different groups of study. Bars represent mean±standard deviation (*p<0.05). 0 50 100 150 200 250 300 350 400 450 500 550 600 650
Controls Time after sampling Time up to freezing Number of freeze-thaw cycles Duration of storage pg/m l * * *
To evaluate the performance of the CD40L as a serum biomarker, we plotted a ROC curve for controls versus non-control samples (figure 14). ROC curve analysis showed that CD40L is not a good indicator for serum quality control with area under the curve of 0.556 and p-value=0.291.
Figure 14 - ROC Curve for CD40L representing the sensitivity and specificity for the control versus the non-control groups (AUC=0.556, p-value=0.291).
IL-1a
A 5 parameter logistic (5PL) regression was used to calculate the concentrations of IL-1a (figure 15).
Figure 15 - Non-linear regression (5PL) for IL-1a with R² = 1.
The R² value (R²=1) confirmed the non-linear behavior of the curve and the equation allowed the calculation of the median concentrations and IQR (table 4).
Table 4 - Median concentrations, IQR and %CV of IL-1a in the different study groups.
Study Group Concentration
(pg/ml)
IQR %CV %undetectable p-value
Controls 49.4 [43.4-49.4] 3.3% 0
Time after sampling 6.0 [5.9-24.3] 56.1% 20% <0.0001
Time up to freezing Incalculable n.a n.a n.a n.a
Number of freeze-thaw cycles
Incalculable n.a n.a n.a n.a
Duration of storage Incalculable n.a n.a n.a n.a
Concerning the groups time up to freezing, number of freeze-thaw cycles and duration of storage the concentration were below the limit of detection, which can be related with a loss of quality of samples. The Mann-Whitney test showed significant differences in concentration of IL-1a in time after sampling group (p<0.0001) compared to control (figure 16).
In twenty percent of the samples the concentration of IL-1a was undetectable in the time after sampling group (p-value=0.005).
Figure 16 - Concentrations of IL-1a in the different groups of study. Bars represent mean±standard deviation (*p<0.05). 0 10 20 30 40 50 60
Controls Time after sampling Time up to freezing Number of freeze-thaw cycles Duration of storage * pg/m l
To evaluate the performance of the IL-1a as a serum biomarker, we plotted ROC curve for controls versus non-control samples (figure 17). ROC curve analysis suggest that IL-a could be a good indicator for serum quality control with area under the ROC curve of 1 and p-value<0.0001, suggested a cutoff of 33.9 pg/ml with 100% sensitivity.
Figure 17 - ROC Curve for IL-1a representing the sensitivity and specificity for the control versus the non-control groups (AUC=1, p-value<0.0001).
G-CSF
A 5PL regression was used to calculate the concentrations of G-CSF (Figure 18).
The R² value (R²=1) confirmed the non-linear behavior of the curve and the equation allowed the calculation of the median concentrations and IQR.
Table 5 - Median concentrations, IQR and %CV of G-CSF in the different study groups.
Study Group Concentration
(pg/ml)
IQR %CV %undetectable p-value
Controls 75.4 [55.4-75.4] 7.2% 0
Time after sampling Incalculable n.a n.a n.a n.a
Time up to freezing 59.6 [59.6-82.5] 9.4% 22.5% <0.0001
Number of freeze-thaw cycles
Incalculable n.a n.a n.a n.a
Duration of storage Incalculable n.a n.a n.a n.a
IQR-Interquatile Ranges; CV-Coefficient of Variation; n.a- not applicable
Concerning the groups time after sampling, number of freeze-thaw cycles and duration of storage the concentration were below the limit of detection and for that was incalculable, which can be related with a loss of quality of samples. The Mann-Whitney test showed significant differences in concentrations for G-CSF in time up to freezing group (p<0.0001) compared to control (figure 19). We also found a significance difference in the number of undetectable concentrations between the control and the time between freezing (22.5%) groups (p-value=0.002).
Figure 19 - Concentrations of G-CSF in the different groups of study. Bars represent mean±standard deviation (*p<0.05). 0 10 20 30 40 50 60 70 80 90
Controls Time after sampling Time up to freezing Number of freeze-thaw cycles Duration of storage pg /m l *
To evaluate the performance of the G-CSF as a serum biomarker, we plotted ROC curves for controls versus non-control samples (figure 20). ROC curve analysis showed that G-CSF is a good indicator for serum quality control with area under the curves of 0.865 and p-value<0.0001, suggested a cutoff of 78.4 pg/ml with 65% specificity.
Figure 20 - ROC Curve for G-CSF representing the sensitivity and specificity for the control versus the non-control groups (AUC=0.865, p-value<0.0001).
GM-CSF
A 5PL regression was used to calculate the concentrations of GM-CSF (figure 21).
Figure 21 - Non-linear regression (5PL) for GM-CSF with R² = 1.
The R² value (R²=1) confirmed the non-linear behavior of the curve and the equation allowed the calculation of the median concentrations and IQR (table 6).
Table 6 - Median concentrations, IQR and %CV of GM-CSF in the different groups of study.
Study Group Concentration
(pg/ml)
IQR %CV %
undetectable
p-value
Controls 26.7 [19.70-30.71] 4.8% 0
Time after sampling 29.1 [29.1-78-32] 28.8% 22.5% <0.0001
Time up to freezing 75.6 [75.6-93.7] 5.32% 30% <0.0001
Number of freeze-thaw cycles
Incalculable n.a n.a n.a n.a
Duration of storage Incalculable n.a n.a n.a n.a
IQR-Interquatile Ranges; CV-Coefficient of Variation; n.a- not applicable
Concerning the groups number of freeze-thaw cycles and duration of storage the concentration were below the limit of detection and for that was incalculable. This could be related with a loss of quality of the samples. The Mann-Whitney test showed significant differences in concentration of GM-CSF in time after sampling group (p<0.0001) and time up to freezing group (p<0.0001) compared to control (figure 22).
Both time up to freezing (30%, p-value<0.0001) and time after sampling (23%, p-value=0.002) showed significantly higher frequency of undetectable concentration samples in relation to control.
Figure 22 - Concentrations of GM-CSF in the different groups of study. Bars represent mean±standard deviation (*p<0.05). 0 10 20 30 40 50 60 70 80 90
Controls Time after sampling Time up to freezing Number of freeze-thaw cycles Duration of storage pg/m l * *
To evaluate the performance of the GM-CSF as a serum biomarker, we plotted a ROC curve for controls versus non-control samples (figure 23). ROC curve analysis showed that GM-CSF is a good indicator of serum quality control with area under the curves of 0.013 and p-value<0.0001, suggested a cutoff of 53.2 pg/ml with 49.2% specificity.
Figure 23 - ROC Curve for GM-CSF representing the sensitivity and specificity for the control versus the non-control groups (AUC=0.013, p-value<0.0001).
VEGF
A 5PL regression was used to calculate the concentrations of VEGF (figure 24).
Figure 24 - Non-linear regression (5PL) for VEGF with R² = 1.
The R² value (R²=1) confirmed the non-linear behavior of the curve and the equation allowed the calculation of the median concentrations and IQR (table 7).
Table 7 - Median concentrations, IQR and %CV of VEGF in the different groups of study.
Study Group Concentration
(pg/ml)
IQR %CV %
undetectable
p-value
Controls 143.3 [38.6-316.9] 63.3% 0
Time after sampling 117.7 [10.4-245-3] 51.7% 2.5% 0.052
Time up to freezing 87.7 [27.2-349.7] 63.6% 5.0% 0.003
Number of freeze-thaw cycles
2308.7 [3.87-2308.7] 70.2% 2.5% <0.0001
Duration of storage 83.2 [83.2-185.1] 29.4% 17.5% 0.133
IQR-Interquatile Ranges; CV-Coefficient of Variation; n.a- not applicable
The Mann-Whitney test showed significant differences in concentrations for VEGF in time up to freezing group (p=0.003) and number of freeze-thaw cycles group (p<0.0001), compared to controls (Figure 25).
The highest number of undetectable concentrations was registered in the duration of storage group (17.5%, p-value=0.012) showing significant differences in comparison to the control samples.
Figure 25 - Concentrations of VEGF in the different groups of study. Bars represent mean±standard deviation ( *p<0.05).
To evaluate the performance of the VEGF as a serum biomarker, we plotted a ROC curve for controls versus non-control samples (figure 26). ROC curve analysis showed that VEGF is not a good indicator for serum quality control with area under the curves of 0.530 and p-value of 0.562.
Figure 26 - ROC Curve for VEGF representing the sensitivity and specificity for the control versus the non-control groups (AUC=0.530, p-value=0.562).
0 500 1000 1500 2000 2500 3000
Controls Time after sampling Time up to freezing Number of freeze-thaw cycles Duration of storage pg/m l * *
Discussion
In this study we measured the concentration of 5 analytes in the serum in order to establish a quality biomarker for the samples stored at Biobanco-IMM. We have particular interest in testing 4 parameters: time between sampling, time between freezing, duration of storage and number of freeze-thaw cycles. As controls we used samples that respected the whole blood Biobanco-IMM SOP for processing and storage.
All biomarkers showed high intra-group variability, which is not surprising for human samples. Moreover, in all groups except the control the percentage of undetectable concentration of each analyte was significantly high. For the groups time between sampling and time between freezing IL-1a, G-CSF and GM-CSF showed statistical significant differences in the percentage of undetectable concentrations. On the other hand, in the number of freeze-thaw cycles IL-1a, G-CSF, GM-CSF and VEGF showed significant differences on the percentage of undetectable concentration while for the duration of storage group CD40L, IL-1a, G-CSF and GM-CSF showed significant differences. As all the analytes were detectable for the control group we believe these differences are due to incorrect manipulation and/or storage of samples that we created with the groups.
For the control group, the levels of CD40L are below the ones described in the literature [21]. Although the method used was the same the reagents were from a different supplier, therefore, more studies are needed to clarify these values. Regarding IL-1a measurements, we noted that in the control group the concentration was of 49.4 pg/ml, higher than the reference values reported in literature.[21] In terms of G-CSF, the concentration in the control group is in accordance with the values published but the GM-CSF levels in the control group were lower Concerning the measurements of VEGF, in the control group we observe a mean concentration of 143.3pg/ml which is according with baseline levels reported.[21] More studies should be conducted in larger sample sizes to clarify differences between diseases, gender or race.
For the time between sampling group we observed that CD40L recorded higher levels compared with the control group. The Main-Whitney test shows significant difference in concentrations between the control group and this study group suggesting that this biomarker may not be adequate to verify this parameter. However, most of the samples of biobank are derived from donors with chronic inflammatory conditions, which might influence the increase of CD40L levels. For IL-1a we observed a decrease in the time between sampling group suggesting loss of activity of IL-1a probably due to loss sample quality. However, a study showed that a 2-hour pre-centrifugation delay at room temperature induced an 11- to 20-fold increase in this marker [41].