Maria de Fátima de Jesus Leal Júlio
Licenciatura em Ciências da Engenharia Química e Bioquímica
Carbon key-properties for microcystin adsorption
in drinking water treatment:
Structure or surface chemistry?
Dissertação para obtenção do Grau de Mestre em Engenharia Química e Bioquímica
Orientador: Rui Viegas, Doutor, LNEC
Co-orientadora: Isabel Fonseca, Professora Doutora,
FCT-UNL
Júri:
Presidente: Professora Doutora Maria Madalena Alves Campos de Sousa Dionísio Andrade, FCT-UNL
Arguente: Doutora Maria João Filipe Rosa, LNEC
FACULDADE DE CIÊNCIAS E TECNOLOGIA
CARBON KEY-PROPERTIES FOR MICROCYSTIN
ADSORPTION IN DRINKING WATER TREATMENT:
STRUCTURE OR SURFACE CHEMISTRY?
MARIA DE FÁTIMA DE JESUS LEAL JÚLIO
Dissertação para Obtenção de Grau de Mestre em Engenharia Química e Bioquímica
Orientador:
Rui Viegas, Doutor, LNEC
Co-orientadora:
Isabel Fonseca, Professora Doutora, FCT-UNL
Júri:
Presidente: Professora Doutora Maria Madalena Alves Campos de Sousa Dionísio Andrade, FCT-UNL
Arguente: Doutora Maria João Filipe Rosa, LNEC
CARBON KEY-PROPERTIES FOR MICROCYSTIN ADSORPTION IN DRINKING WATER TREATMENT: STRUCTURE OR SURFACE CHEMISTRY?
Copyright @ Maria de Fátima de Jesus Leal Júlio, FCT /UNL, UNL
ACKNOWLEDGEMENTS
I would like to express my sincere appreciation to everyone who contributed to the development of this thesis.
First, I would like to express my gratitude to my supervisor Dr. Rui Viegas for promoted truly stimulating discussions and gave me valuable suggestions which have helped steering this work. A special thanks to Dr. Maria João Rosa for his insightful suggestions and discussions. Their support was determinant to improve the quality of the thesis.
My gratitude also goes to Eng. Sérgio Teixeira for receiving me at the National Laboratory for Civil Engineering and to Dr. José Menaia for receiving me at the LABES.
I am also very grateful to Professor Isabel Fonseca for all affection and availability suggestions. Thanks to Nuno and Carla for the analytical determination of the activated carbon surface functional groups and elemental analysis and to Inês for help me in activated carbon preparation.
I would like to thank to my colleagues at the LABES, Ana, Laura, Rosário and Cristina. But a special thanks to Vítor Napier because will not be possible the entire laboratory work without him.
A loving thanks to Elsa Mesquita for the constant support, for her suggestions that helped me so much in the conclusion of this work.
Rita, thank you for you friendship and support, without you this was not possible, you know it!
i
ABSTRACT
The carbon key-properties (structure and surface chemistry) for microcystin-LR (MC-LR) adsorption onto activated carbon were investigated. Waters with an inorganic background matrix approaching that of the soft natural water (2.5 mM ionic strength) were used. Also, model waters with controlled ionic make-up and NOM surrogate with similar size of MC-LR (tannic acid - TA) with MC-LR extracts were tested with activated carbon NORIT 0.8 SUPRA. For this AC, two particle sizes, 125-180 µm and 63-90 µm were tested. The surface chemistry of NOR 125-180 µm was modified by thermal treatment and was also preloaded with TA. The
integrated analysis of carbon’s chemical and textural characterization and of kinetic and isotherm modeling using non-linear models allowed concluding that: i) the heating method is an efficient and simple process for reducing a relatively hydrophilic activated carbon and thereby enhancing its MC-LR adsorption capacity; ii) from a combination of the modification of the carbon surface chemistry and the carbon structure, it is demonstrates that both properties play an important role in the adsorption process, although carbon surface chemistry seems to be more important than its porous structure – MC-LR adsorption correlated with meso and macroporous volume and particularly well with carbon hydrophobicity (inverse of oxygen content); iii) the smaller the particle size, the more important is external mass transfer over intraparticle diffusion; iv) similar sized NOM strongly competes with MC-LR for the same AC sites; v) direct competition governs the simultaneous MC-LR and NOM adsorption; vi) the preloading phenomena reduces significantly the performance of activated carbon adsorption.
Key-words: Activated carbon adsorption, drinking water treatment, microcystin-LR, natural
iii
RESUMO
As propriedades-chave (estrutura e química de superfície) para a adsorção em carvão activado de microcistina-LR (MC-LR) foram investigadas. Foram usadas águas com uma matriz inorgânica que se aproxima da água natural macia (2.5 mM de força iónica). Além disso, águas modelo em condições controladas de pH e força iónica, mas com NOM com tamanho similar ao de MC-LR (ácido tânico) e com extractos de MC-LR foram testadas com o carvão activado NORIT 0.8 SUPRA. Para este carvão, duas granulometrias foram usadas: 125-180 µm e 63-90 µm. A química de superfície do carvão NOR 125-180 µm foi modificada por tratamento térmico e foi também carregado (preloaded) com ácido tânico. A análise integrada da caracterização química e textural do carvão, assim como a modelação de cinéticas e isotérmicas de equilíbrio utilizando modelos não-lineares permitiu concluir que: i) o método de tratamento térmico é um processo simples e eficiente para modificar a superfície do carvão tornando-o mais básico e reforçando assim a adsorção de MC-LR; ii) a partir da combinação da modificação química da superfície do carvão e da sua estrutura, demonstrou-se que ambas as propriedades têm um papel importante na adsorção, embora a química de superfície do carvão pareça ser mais importante do que a sua estrutura porosa – a adsorção de MC-LR correlacionada com o volume de meso e macroporos é particularmente bem relacionada com a hidrofobicidade do carvão (inverso do teor de oxigénio); iii) quanto mais pequena a granulometria, mais importante se torna a transferência de massa externa ao longo da difusão dentro da partícula; iv) NOM de tamanho similar ao da MC-LR compete fortemente com MC-LR pelos mesmos locais de adsorção; v) a competição directa governa a adsorção simultânea de MC-LR e NOM; vi) o fenómeno de preloading reduz significativamente o desempenho da adsorção em carvão activado.
Palavras-chave: Adsorção, Carvão activado, Tratamento de água, Microcistina-LR,
v
TABLE OF CONTENTS
1. INTRODUCTION ... 1
1.1. BACKGROUND ... 1
1.2. OBJECTIVES ... 3
1.3. STRUCTURE OF THESIS ... 4
2. LITERATURE REVIEW ... 5
2.1. CYANOBACTERIA ... 5
2.2. CYANOBACTERIAL TOXINS ... 7
2.2.1. General ... 7
2.2.2. Microcystin-LR ... 8
2.3. WATER TREATMENT OPTIONS FOR CYANOTOXINS ... 11
2.4. FUNDAMENTALS OF ADSORPTION ... 16
2.4.1. General ... 16
2.4.2. Production, physical and chemical characteristics of activated carbon ... 17
2.4.3. Adsorption properties ... 20
2.4.4. Solution chemistry ... 23
2.4.5. Adsorption mechanisms and models ... 24
2.4.6. Competitive adsorption ... 32
2.5. ACTIVATED CARBON APPLICATION FOR MICROCYSTIN-LR CONTROL .. 34
3. MATERIALS AND METHODS ... 37
3.1. RESEARCH STRATEGY ... 37
3.2. ACTIVATED CARBON ... 39
3.2.1. Carbon preparation ... 39
3.2.2. Carbon surface chemistry modification ... 40
3.2.3. Carbon preloading ... 40
3.3. ADSORBATES ... 41
3.3.1. Microcystin-LR ... 41
3.3.2. Tannic acid ... 42
3.4. ASSAYED WATERS ... 43
3.5. METHODS FOR WATER ANALYSIS ... 43
3.5.1. pH and conductivity ... 43
3.5.2. Quantification of microcystin-LR ... 43
vi
3.6. CHEMICAL AND TEXTURAL CHARACTERIZATION OF THE ACTIVATED
CARBONS ... 46
3.6.1. Surface charge characterization... 46
3.6.2. Characterization of the surface functional groups ... 46
3.6.3. Textural characterization ... 47
3.7. BATCH STUDIES OF ACTIVATED CARBON ADSORPTION ... 48
3.7.1. General procedure ... 48
3.7.2. Studies for determining the MC-LR equilibrium time ... 50
3.7.3. Adsorption kinetic studies of MC-LR ... 50
3.7.4. Adsorption kinetic studies of TA ... 51
3.7.5. Kinetic studies of competitive adsorption between MC-LR and TA ... 51
3.7.6. Isotherm studies for MC-LR adsorption ... 52
3.7.7. Isotherm studies for TA adsorption ... 53
3.7.8. Isotherm studies of competitive adsorption between MC-LR and TA ... 53
3.7.9. Calculation methods ... 54
4. RESULTS AND DISCUSSION ... 55
4.1. CHEMICAL AND PHYSICAL CHARACTERIZATION OF THE ADSORBENT ... 55
4.1.1. Surface charge of the activated carbon ... 55
4.1.2. Functional Groups ... 56
4.1.3. Textural Characterization ... 57
4.2. ADSORPTION OF MICROCYSTIN-LR ONTO ACTIVATED CARBON ... 60
4.2.1. Equilibrium time for MC-LR adsorption ... 60
4.2.2. Adsorption of MC-LR onto NOR 125-180 ... 62
4.2.3. Adsorption of MC-LR onto NOR 63-90 ... 66
4.2.4. Adsorption of MC-LR onto modified NOR 125-180 ... 69
4.2.5. Comparative analysis of the three NOR carbons for MC-LR adsorption ... 72
4.3. ADSORPTION OF TANNIC ACID ONTO ACTIVATED CARBON ... 78
4.3.1. Comparative analysis of the MC-LR adsorption and TA adsorption as single-solutes 78 4.3.2. Comparative analysis of the three NOR carbons for TA adsorption ... 80
4.4. COMPETITIVE ADSORPTION BETWEEN MC-LR AND TA ... 85
4.4.1. Competitive adsorption between MC-LR and TA onto NOR 125-180... 85
4.4.2. Competitive adsorption between MC-LR and TA onto NOR 63-90... 87
vii
4.5.1. General ... 90
4.5.2. Adsorption of MC-LR onto TA-preloaded NOR 125-180 carbon ... 90
4.5.3. Competitive adsorption between MC-LR and TA onto TA-preloaded NOR 125-180 92 5. CONCLUSIONS AND FUTURE DEVELOPMENTS ... 95
5.1. CONCLUSIONS ... 95
5.2. FUTURE DEVELOPMENTS ... 101
6. REFERENCES ... 103
ANNEX I. CALIBRATION CURVE FOR HPLC CALIBRATION ... 111
ANNEX II. QUANTIFICATION OF TANNIC ACID ... 112
ANNEX III. PORE SIZE DISTRIBUTION OF ACTIVATED CARBONS ... 113
ANNEX IV. TEXTURAL PROPERTIES OF THE ACTIVATED CARBONS ... 115
viii
INDEX OF FIGURES
Figure 2.1. Some countries (●) where cyanobacteria water blooms producing cyanotoxins have been documented (adapted from Carmichael, 2007). ... 6 Figure 2.2. Structural formula (C49H74N10O12) of microcystin-LR (adapted from Antoniou, Cruz
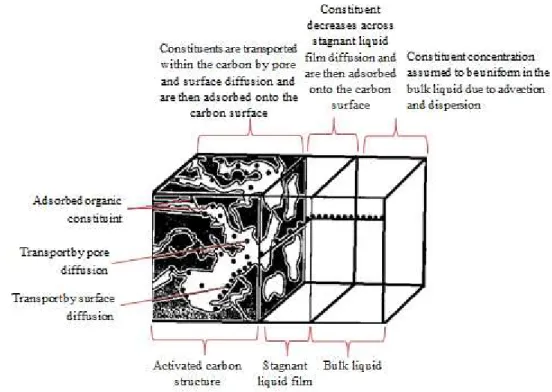
and Dionysiou, 2005). ... 8 Figure 2.3. Typical structural dimensions of microcystin-LR (adapted from Pendleton et al., 2001). ... 10 Figure 2.4. MC-LR species fraction and MC-LR net charge graph. ... 11 Figure 2.5. Macropore, mesopore, micropore and submicropore adsorption sites on activated carbon (adapted from Metcalf and Eddy, 2003). ... 17 Figure 2.6. Granular (a) and powdered (b) activated carbon (adapted from Xinhui Carbon Co., 2010). ... 18 Figure 2.7. Electroestatic interactions between the carbon surface and the adsorbate molecules. ... 21 Figure 2.8. Definition sketch for the adsorption of an organic constituent with activated carbon (adapted from Metcalf and Eddy, 2003). ... 25 Figure 3.1. Strategy of the thesis. ... 38 Figure 3.2. Retsh Sieves (ASTM E-11)(a); Ceramic Ball Mill (The Pascall Enginerering Co, Ltd)
(b); and Ceramic Ball Mill holder (c) (Chemistry Department of the Faculty of Sciences and Technology – New University of Lisbon). ... 39 Figure 3.3. Tubular oven used in the experiment (Chemistry Department of the Faculty of Sciences and Technology – New University of Lisbon). ... 40 Figure 3.4. Chemical structure of tannic acid (adapted from Gülçin et al., 2010). ... 42 Figure 3.5. Solid phase extraction apparatus used in the experiments (Sanitary Engineering Laboratory (LABES) of the Urban Water Division (NES) of LNEC´s Hydraulics and Environment Department (DHA)). ... 44 Figure 3.6. Apparatus used in the kinetic and isotherm batch experiments (Edmund-Bühler
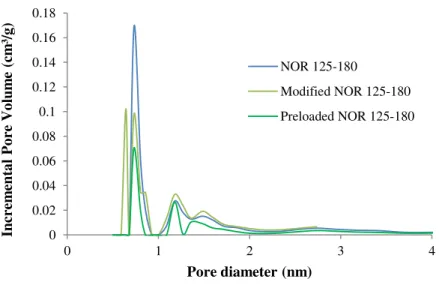
orbital shaker). ... 48 Figure 4.1. Pore size distribution (microporous structure) of NOR 125-180 virgin, modified and preloaded. ... 58 Figure 4.2. Pore size distribution (mesoporous structure) of the studied activated carbons. ... 58 Figure 4.3. Adsorption kinetics of MC-LR (extract) in 2.5 mM IS electrolyte (1 mM IS KCl + 1.5 mM IS CaCl2) onto NOR 125-180 for determining the MC-LR adsorption equilibrium time.
... 60 Figure 4.4. Comparison between the adsorption kinetic of MC-LR (extract in 2.5 mM IS
ix Figure 4.9. Intraparticle diffusion model (a), and Boyd plot (diffusion coefficient) (b), for MC-LR adsorption onto NOR 125-180 (2.5 mM IS electrolyte). ... 64 Figure 4.10. Langmuir isotherm fitting for MC-LR adsorption onto NOR 63-90 (2.5 mM IS electrolyte). ... 66 Figure 4.11. Pseudo-first order and pseudo-second order adsorption kinetic models for MC-LR adsorption onto NOR 63-90 (2.5 mM IS electrolyte). ... 67 Figure 4.12. Pseudo-second order adsorption kinetic model fitting of C (µg/L) and q(µg/mg) for MC-LR adsorption onto NOR 63-90 (2.5 mM IS electrolyte). ... 68 Figure 4.13. Intraparticle diffusion model for MC-LR adsorption (a) and Boyd plot (diffusion coefficient) (b) onto NOR 63-90 (2.5 mM IS electrolyte). ... 68 Figure 4.14. Langmuir isotherm fitting for MC-LR adsorption onto modified NOR 125-180 (2.5 mM IS electrolyte). ... 70 Figure 4.15. Pseudo-first order and pseudo-second order adsorption kinetic models for MC-LR adsorption onto modified NOR 125-180 (2.5 mM IS electrolyte). ... 70 Figure 4.16. Pseudo-second order adsorption kinetic model fitting of C (µg/L) and q(µg/mg) for MC-LR adsorption onto modified NOR 125-180 (2.5 mM IS electrolyte). ... 71 Figure 4.17. Intraparticle diffusion model (a), and Boyd plot (diffusion coefficient) (b), for MC-LR adsorption onto modified NOR 125-180 (2.5 mM IS electrolyte). ... 71 Figure 4.18. Langmuir isotherm fitting for adsorption of MC-LR onto the studied ACs. ... 72 Figure 4.19. Correlation of the qmax of the MC-LR adsorbed with the mesopore and macropore
volumes (BJH) and with micropore volume. ... 74 Figure 4.20. Correlation between the amounts of MC-LR adsorbed with oxygen content on AC´s (2.5 mM IS electrolyte). ... 74 Figure 4.21. Adsorption kinetics for adsorption of MC-LR onto the studied ACs. ... 75 Figure 4.22. Intraparticle diffusion model for MC-LR adsorption onto the studied activated carbons (2.5 mM IS electrolyte). ... 76 Figure 4.23. Diffusion coefficients of MC-LR through the studied ACs. ... 77 Figure 4.24. Single-solute isotherms (Langmuir plot) of MC-LR and TA adsorption onto NOR 125-180 (2.5 mM IS background electrolyte). ... 79 Figure 4.25. Single-solute adsorption kinetics of MC-LR and TA adsorption in the presence of 2.5 mM IS background onto NOR 125-180 µm... 79 Figure 4.26. Langmuir isotherm fitting for adsorption of TA onto the studied ACs (2.5 mM IS electrolyte). ... 80 Figure 4.27. Correlation of the qmax of the TA adsorbed with the mesopore and macropore volumes (BJH) and with micropore volume. ... 81 Figure 4.28. Correlation between the amounts of TA adsorbed with oxygen content on AC´s (2.5 mM IS electrolyte). ... 81 Figure 4.29. Pseudo-second order adsorption kinetics fitting for adsorption of TA onto NOR 125-180 and modified 125-180 (2.5 mM IS electrolyte). ... 82 Figure 4.30. Pseudo-second order fitting of C (µg/L) and q(µg/mg) for NOR 125-180 (●) and
x
xi
INDEX OF TABLES
Table 2.1. Guidelines or legislation for MC-LR in drinking waters (adapted from Antoniou et
al., 2005, Burch 2007 and WHO 2008). ... 9
Table 2.2. Cyanotoxin removal in drinking water treatment processes. ... 12
Table 2.3. Summary of techniques for treatment of cyanobacterial toxins (adapted from Newcombe and Nicholson, 2004). ... 14
Table 2.4. Comparison of granular and powdered activated carbon (adapted from Metcalf and Eddy, 2003). ... 18
Table 2.5. Advantages (+) and disadvantages (-) of the PAC and GAC systems (Cecílio et al., 2007). ... 19
Table 2.6. Linear and non-linear forms of pseudo-first order and pseudo-second order equations. ... 30
Table 2.7. Maximum capacity of some AC for removing MC-LR from ultrapure water. ... 34
Table 2.8. Properties of the studied AC based on literature (Rivera-Utrilla and Sánchez-Polo, 2002; Sánchez-Polo et al., 2006; Lyubchik et al., 2008; Costa 2010; Sze e McKay, 2010). ... 35
Table 2.9. Elemental analysis (wt %) of the NOR 0.8 (Costa, 2010). ... 36
Table 2.10. Product specifications given by manufacturer (NORIT, 2007). ... 36
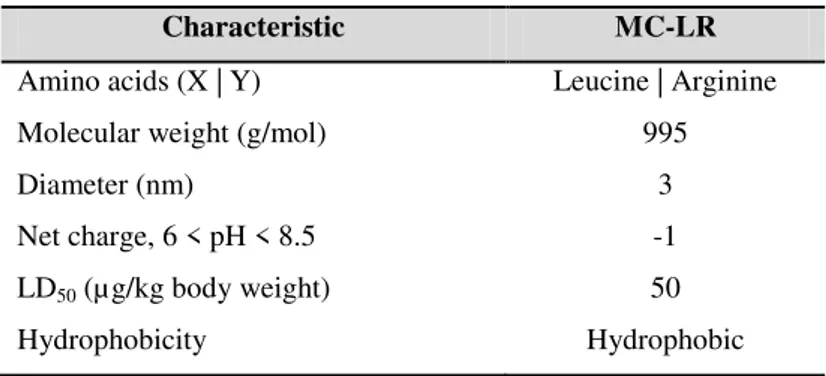
Table 3.1. Characteristics of the microcystin MC-LR used in this study (Antoniou et al., 2005 and Ho et al., 2011). ... 41
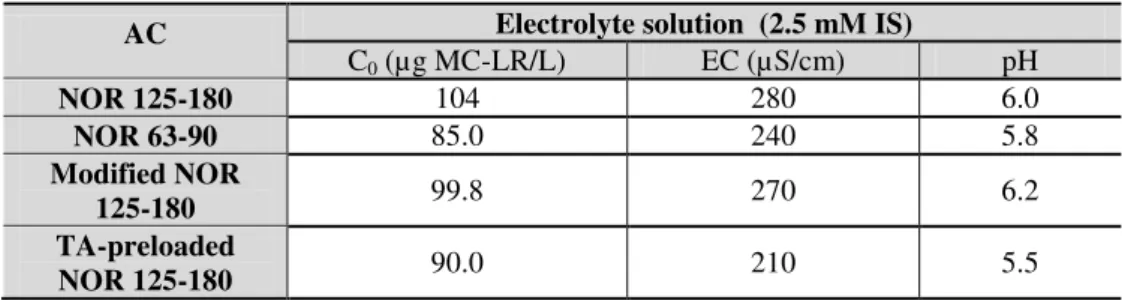
Table 3.2. Characteristics of electrolyte solution used in all experiments. ... 43
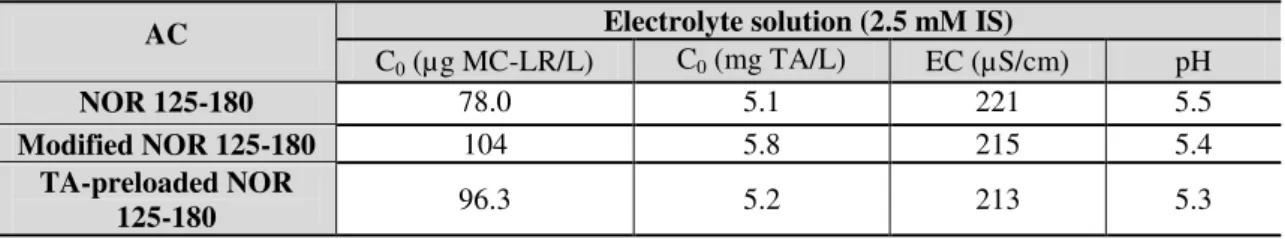
Table 3.3. General characteristics of the assayed waters before spiking with MC-LR. ... 43
Table 3.4. Gradient program of mobile phase for analysis of MC-LR. ... 45
Table 3.5. Summary of the experimental conditions tested. ... 49
Table 3.6. Characteristics of activated carbon and assayed water used in the MC-LR adsorption kinetic for determining the MC-LR equilibrium time. ... 50
Table 3.7. Characteristics of the assayed water used in the MC-LR adsorption kinetic studies. 50 Table 3.8. Characteristics of the activated carbon used in the MC-LR adsorption kinetic studies. ... 51
Table 3.9. Characteristics of the assayed water used in the TA adsorption kinetic studies. ... 51
Table 3.10. Characteristics of the activated carbon used in the TA adsorption kinetic studies. . 51
Table 3.11. Characteristics of the assayed water used in the kinetic studies for competitive adsorption of MC-LR and TA. ... 51
Table 3.12. Characteristics of the activated carbon used in the kinetic studies for competitive adsorption of MC-LR and TA. ... 52
Table 3.13. Characteristics of the assayed water used in the MC-LR adsorption isotherm studies. ... 52
Table 3.14. Characteristics of the activated carbon used in the MC-LR adsorption isotherm studies. ... 52
Table 3.15. Characteristics of the assayed water used in the TA adsorption isotherm studies. .. 53
Table 3.16. Characteristics of the activated carbon used in the TA adsorption isotherm studies. ... 53
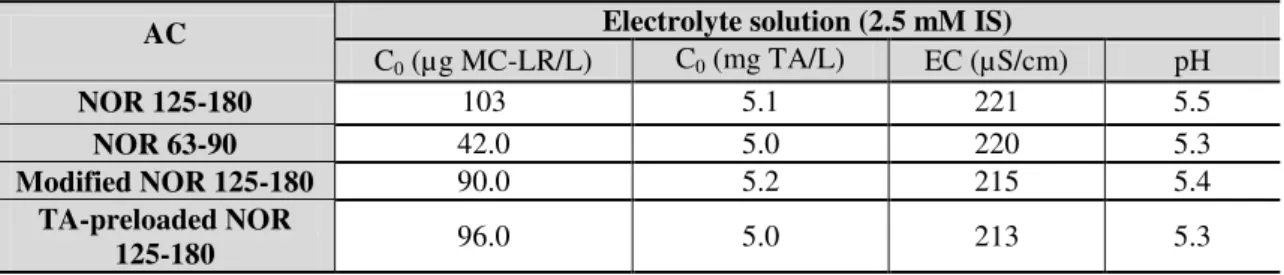
Table 3.17. Characteristics of the assayed water used in the competitive adsorption isotherm studies of MC-LR and TA. ... 53
xii
Table 4.1. Point of zero charge of the studied carbons. ... 55
Table 4.2. Elemental analysis (wt%) of the studied activated carbons. ... 56
Table 4.3. Textural properties of the studied NOR carbons. ... 59
Table 4.4. Properties of microcystin variants (adapted from Campinas and Rosa, 2006). ... 61
Table 4.5. Langmuir isotherm parameters with 95% confidence interval for NOR 125-180 adsorption of MC-LR from 2.5 mM IS electrolyte solution. ... 62
Table 4.6. Adsorption kinetics constants with 95% confidence interval for pseudo-first order and pseudo-second order models for MC-LR adsorption onto NOR 125-180 (2.5 mM IS electrolyte). ... 63
Table 4.7. Parameters for intraparticle diffusion model and Boyd plot for MC-LR adsorption onto NOR 125-180. ... 65
Table 4.8. Langmuir isotherm parameters with 95% confidence interval for MC-LR adsorption onto NOR 63-90 (2.5 mM IS electrolyte). ... 66
Table 4.9. Adsorption kinetics constants with 95% confidence interval for pseudo-first order and pseudo-second order models for MC-LR adsorption onto NOR 63-90 (2.5 mM IS electrolyte). ... 67
Table 4.10. Parameters for intraparticle diffusion model and Boyd plot for MC-LR adsorption onto NOR 63-90 (2.5 mM IS electrolyte). ... 69
Table 4.11. Langmuir isotherm parameters with 95% confidence interval for MC-LR adsorption onto modified NOR 125-180 (2.5 mM IS electrolyte). ... 70
Table 4.12. Adsorption kinetic constants with 95% confidence interval for pseudo-first order and pseudo-second order models for MC-LR adsorption onto modified NOR 125-180 (2.5 mM IS electrolyte). ... 71
Table 4.13. Parameters for intraparticle diffusion model and Boyd plot for MC-LR adsorption onto modified NOR 125-180 (2.5 mM IS electrolyte). ... 72
Table 4.14. Langmuir isotherm parameters with 95% confidence interval for adsorption of MC-LR onto the studied ACs. ... 72
Table 4.15. Summary of activated carbon properties. ... 73
Table 4.16. Adsorption kinetic parameters with 95% confidence interval for adsorption of MC-LR onto the studied ACs (2.5 mM IS electrolyte). ... 76
Table 4.17. Intraparticle diffusion model parameters for MC-LR adsorption onto the studied activated carbons (2.5 mM IS electrolyte). ... 77
Table 4.18. Boyd’s model parameters for MC-LR adsorption onto the studied activated carbons. ... 78
Table 4.19. Single-solute isotherms (Langmuir parameters) of MC-LR and TA adsorption onto NOR 125-180 (2.5 mM IS background electrolyte). ... 79
Table 4.20. Single-solute adsorption kinetics of MC-LR and TA adsorption in the presence of 2.5 mM IS background onto NOR 125-180 µm... 80
Table 4.21. Langmuir isotherm parameters with 95% confidence interval for adsorption of TA onto the studied ACs (2.5 mM IS electrolyte)... 81
Table 4.22. Adsorption kinetics parameters with 95% confidence interval for adsorption of TA onto NOR 125-180 and modified NOR 125-180 (2.5 mM IS electrolyte). ... 83
Table 4.23. Intraparticle diffusion and Boyd’s parameters for TA adsorption onto NOR 125-180 and modified NOR 125-180 (2.5 mM IS electrolyte). ... 84
xiii
ABBREVIATIONS
AC Activated Carbon
AOM Algogenic organic matter
BET Brunauer, Emmet and Teller
C/F/S Coagulation/flocculation/sedimentation
C0 Initial concentration
DOC Dissolved organic carbon
DPB Disinfection byproducts
EC Electrical conductivity at 25ºC
EOM Extracellular organic matter
GAC Granular activated carbon
HPLC High performance liquid chromatography
IOM Intracellular organic matter
IR Infrared spectroscopy
IS Ionic strength
LD50 Lethal dose (50%)
MC Microcystins
MC-LA Microcystin-LA MC-LF Microcystin-LF MC-LR Microcystin-LR MC-LW Microcystin-LW MC-LY Microcystin-LY
MIB Methylisoborneol
MW Molecular weight
NF Nanofiltration
NOM Natural organic matter
xiv
PAC/UF Powdered activated carbon adsorption/ultrafiltration
PDA Photo diode array
pHpzc pH at the point of zero charge
PSD Pore size distribution
TA Tannic acid
TCE Trichloroethylene
TFA Trifluoracetic acid
TPD Temperature programmed desorption
UF Ultrafiltration
UPW Ultrapure water
WHO World Health Organization
WTP Water treatment plant
1
1.
INTRODUCTION
1.1. BACKGROUND
Eutrophication of freshwater resources has been studied worldwide and its consequences are of concern especially in waters used for recreation or human consumption (Vasconcelos, 2006). The occurrence of cyanobacteria blooms in surface water used for water catchment for human consumption is now the most important problem associated to the growing attendance conditions od eutrophication in surface waters (Menaia and Rosa, 2006). Cyanobacterial blooms seasonally challenge drinking water treatment due to the massive input of cells and also the release of algogenic organic matter (AOM) into the water, causing poor settling, filter clogging, tastes and odors, disinfectant consumption and production of disinfection by – products (Campinas, 2009). But the greatest concern is the ability of several cyanobacteria strains to
produce and release (during “cell death” – lysis) potent toxins as secondary metabolites, cyanotoxins, including cyclic peptide hepatotoxins (e.g. Microcystins).
Microcystins-LR are the most frequently occurring cyanotoxins and may cause both severe and chronic effects (liver damage and tumor promoting). Furthermore, microcystins (MCs) are the only ones for which the World Health Organization (WHO) derived a drinking water provisional guideline value (1 μg/L for daily exposure to the microcystin-LR (MC-LR)), adopted as a national standard for drinking water quality (DL 306/2007). Additionally, these toxins where found in water reservoirs in Portugal (Vasconcelos, 2006; Osswald, 2007) which increases the importance of developing knowledge related to their removal (and to promote its dissemination) at national level.
For cyanotoxins, the removal in treatment processes is difficult by the fact that the toxins may be contained inside the intact cell (intracellular), and may be dissolved (extracellular). The microcystins are formed inside cyanobacterial cells. Cyanobacteria lysis releases the microcystins into the water. Once released from the cell, the toxins, being highly soluble, will exist in dissolved form (Drikas et al., 2001). An optimal water treatment requires the removal of intact cyanobacterial cells.
2
these toxins from water is presently a major challenge and concern for the water management authorities and the water industry.
Activated carbon has been widely used for many years as an adsorbent in the drinking water and wastewater treatment, in the food, beverage, pharmaceutical and chemical industries and is the adsorbent of choice in most commercial adsorption separation processes due to its performance relative to its cost (Pendleton et al., 2001). It is also proven to be particularly effective on the removal of cyanotoxins from water, either in powdered (PAC) or granular (GAC) form (Lambert et al., 1996; Pendleton et al., 2001). The use of PAC has been mostly limited to a seasonal period when episodes of high levels of cyanotoxins occur. On the other hand, GAC is generally applied in water treatment plants when a permanent and safe barrier is required, not just for cyanotoxins (and other micropollutants) control, but also for the removal of the cyanobacterial cells (Hrudey et al., 1999). Also, several studies have been published showing the removal potential of MC-LR by activated carbon treatment (Falconer et al., 1989; Donati et al., 1994; Lambert et al., 1996; Drikas et al., 2001; Campinas, 2009; Costa, 2010).
However, AC performance depends on the type of water, carbon properties and raw water characteristics (inorganic and organic background matrices). Regarding the carbon properties most affecting the adsorption of microcystins, a broad consensus has not been obtained. Some
authors’ show that the removal efficiency depends upon the physical properties of activated carbon and the water background matrix, while surface chemistry characteristics do not affect the adsorption of microcystin-LR (Donati et al., 1994). However Huang and Cheng (2007) showed that both physical and chemical properties simultaneously affect the adsorption process. This thesis search for answers about these properties, looking for “key properties” of AC that lead to a better adsorption rate and capacity.
3 carbon adsorption because is usually present in much higher concentrations (mg/L levels) than toxins (µg/L levels) and compete directly for adsorption sites or by blocking pores.
The focus of this thesis was on MC-LR removal by AC adsorption. The impact of several carbon properties was evaluated and, with the aim of being able to understand and predict the process efficiency in real waters, an inorganic matrix was used and the competing mechanisms with NOM was studied. The NOM surrogate used for this study is tannic acid (TA). Tannic acid was selected as a representative of hydrophobic organics with a molecular weight of approximately 1700 g/mol. It contains phenolic groups and is expected to have a high competitive adsorption with MC-LR due to their similar molecular weight and charge (Campinas and Rosa, 2006).
It is within this context that arises the development of this thesis, focusing on the main questions involving the adsorption and the properties of the activated carbon for the adsorption of MC-LR, TA and for the competitive adsorption between MC-LR and TA.
1.2. OBJECTIVES
The present work attempts to contribute to the knowledge of MC-LR adsorption by AC’s by
investigating the effects of adsorbent surface chemistry and structure as well as the water background matrix, making the main objective to study the key properties of activated carbons, trying to reveal which has more importance: the structure of AC or its surface chemistry on the adsorption of microcystins in drinking water treatment. Recent studies indicate that not only the mesoporosity of an AC is important, but also its surface chemistry (Costa, 2010). This question and consequently, this thesis arise with the problematic suggested by Costa, 2010.
For this purpose, this general objective comprehends:
Modify activated carbon (NOR 0.8 SUPRA) in order to modify its surface chemistry: reducing the oxygen content making it more basic;
Studying mechanisms of competitive adsorption with natural organic matter with similar characteristics to those of MC-LR (tannic acid) in waters with similar characteristics of those of “blooms” occur, soft natural water (2.5 mM IS electrolyte: 1
mM KCl + 1.5 mM CaCl2);
4
Non-linear modeling of kinetic and isotherm adsorption models.
1.3. STRUCTURE OF THESIS
The thesis is divided in six chapters: (1) Introduction; (2) Literature review; (3) Materials and methods; (4) Results and discussion; (5) Conclusions and future work and (6) References.
The first chapter is introductory. This first chapter is also a brief presentation of the problem and
“how to deal with the problem”, the relevance of this study and the objectives of the thesis.
Chapter 2 includes a literature review to introduce the fundamentals and principles, and to characterize the state of the art of the main themes of this thesis. Chapter 2 presents a review regarding the main aspects of cyanobacteria and cyanotoxins, mainly the microcystin-LR, and a review of relevant legislation and guidelines for their presence in drinking water. The different treatment options for the removal of cyanobacteria and cyanotoxins (including MC-LR) are described. In particular, the activated carbon adsorption and the methodologies for the evaluation of the activated carbon performance are detailed (including the activated carbon properties, water matrix and the competitive mechanisms).
Chapter 3 includes the research strategy and describes the materials, methods and procedures used in the experiments to achieve the results presented in chapter 4, along with discussion.
Chapter 4 is divided in four sections. The first one describes the carbons used and their characterization. The second section presents and discusses the kinetic and isotherm studies with MC-LR and different activated carbons, discussing the effects of the surface chemistry and structure of activated carbon, and the models applied. The subchapter 4.3 presents and discusses the kinetic and isotherm studies with tannic acid onto different activated carbons, discussing also the effects of the surface chemistry and structure of activated carbons. The competitive adsorption between MC-LR and TA with different activated carbons is addressed in section 4.4. The MC-LR adsorption onto preloaded carbon is discussed on section 4.5. An integrated analysis of the results is made and the performances of the different types of activated carbon in similar conditions are compared.
5
2.
LITERATURE REVIEW
2.1. CYANOBACTERIA
Cyanobacteria, more commonly known as blue-green algae, are found worldwide in various aquatic environments as well as in water distribution systems (Antoniou et al., 2005). They are known as blue-green algae because these organisms have characteristics of both algae and bacteria. This is the only prokaryote group of algae and they have the distinction of being the oldest known fossils, more than 3500 million years old.
Cyanobacteria occur in a wide variety of habitats and partly because of their ability to fix
atmospheric nitrogen, act as “primary colonizers” of terrestrial habitats in which few other organisms can multiply. They are able to carry out photosynthesis with the production of oxygen and their presence in large numbers in surface waters may reduce the potability of the water and may pose a risk to the health of those ingesting or having skin contact with the water (Mara and Horan 2003).
These bacteria are omnipresent in soil and surface waters, where, in the absence of eutrophication, are imperceptible to the naked eye. However, in the presence of conditions that promote eutrophication of water, lush blooms are formed and are predominantly composed of cyanobacteria. Sunlight is the energy source that cyanobacteria use to multiply, hence its importance for the formation of blooms (Menaia and Rosa, 2006).
Freshwater cyanobacteria may accumulate in surface waters as “blooms” and may concentrate
on the surface as blue-green scum (Guidelines of Canadian Drinking Water, 2002).
The growth of cyanobacteria and the formation of blooms are influenced by a variety of physical, chemical and biological factors. Cyanobacteria blooms persist in water supplies when adequate levels of nutrients, especially phosphorus and nitrogen, are coupled with favorable environmental conditions: water temperatures generally between 15 and 30°C and a pH between 6 and 9 (Lambert et al., 1994). Timing and duration of the cyanobacterial bloom season depend largely on the climatic conditions of the region. In temperate zones, cyanobacterial blooms are most prominent during the late summer and early autumn and may last for 2-4 months. In warmer climates, like the ones of Portugal and Spain, blooms may occur for up to 6 months or longer (Sivonen and Jones, 1999).
These blooms report color, odor, and taste problems in water. More importantly, such blooms
6
irreversible effects on mammalian health. Exposure to cyanobacterial toxins can affect the number and diversity of wild animal populations, cause bioaccumulation of toxins in the tissues of fish and shellfish, and indirectly affect other organisms through the food chain. Moreover, the presence of cyanobacterial toxins in sources of drinking water supply has raised major concerns (Antoniou et al., 2005). Microcystis species are the most common toxic bloom-forming cyanobacteria in Europe, with M. aeruginosa, M. viridis and M. weisenbergii (Premazzi and Volterra, 1993).
7
2.2. CYANOBACTERIAL TOXINS
2.2.1.General
A toxin is a substance which has specific functional groups arranged on the molecule resulting in a strong physiological toxicity. When compared against other biological toxins, algal toxins rank more toxic than plant, fungal and somewhat less toxic than most bacterial toxins (Premazzi and Volterra, 1993).
As previously stated, cyanobacterial toxins are toxins produced by cyanobacteria. They include neurotoxins which affect the nervous system (e.g. anatoxins), hepatotoxins (e.g. microcystins), dermatotoxins, which cause irritations of the skin and other organs. About 50 species of cyanobacteria are known to produce toxins, but not all compounds produced during cyanobacterial blooms are toxic to humans and animals (Antoniou et al., 2005). Cyanobacterial toxins can also be grouped based on structure: cyclic peptides (hepatotoxins), alkaloids (neurotoxins) and lipopolysaccharides (LPSs). The hepatotoxins and neurotoxins are produced by cyanobacteria commonly found in surface water supplies and therefore appear to be of most relevance to water supplies at present (Guidelines for Canadian Drinking Water, 2002).
Microcystins (MC) have a molecular weight of 900-1100 Da (Vesterkvist e Meriluoto, 2003). Structurally, they are monocyclic heptapeptides that contain two variable L-amino acids and two novel D-amino acids. The two novel D-amino acids in microcystins are N-methyl dehydroalanine (Mdha), which hydrolyses to methylamine, and a unique non-polar-linked amino acid 3-amino-9-methoxy-2, 6, 8-trimethyl-10-phenyldeca-4, 6-dienoic acid, also known as Adda. The key component for biological activity appears to be linked with the Adda side chain, as cleavage of the Adda side chain from the cyclic peptide renders both components non-toxic (Dawson, 1998; Guidelines for Canadian Drinking Water, 2002).
Microcystins are amphiphatic molecules containing some hydrophilic functions such as the carboxyl groups and the guanidine group in the frequently present arginine residue, and some hydrophobic parts such as the Adda residue (which contains two conjugated double bonds).
8
2.2.2. Microcystin-LR
Microcystins are named according to their variable L-amino acids, so microcystin-LR (MC-LR) contains leucine (L) and arginine (R) (Dawson, 1998). MC-LR is a hydrophobic compound with a molecular mass of 994 g/mol. MC-LR was found to have a half-life of three to four days in aquatic systems under laboratory conditions. Even so, some studies have reported persistence of MC-LR for up to nine days in concentrations as high as 1300-1800 µg/L before any significant
degradation occurred (Antoniou et al., 2005).
Figure 2.2. Structural formula (C49H74N10O12) of microcystin-LR (adapted from Antoniou, Cruz and Dionysiou, 2005).
Health related episodes in humans and animals caused by MC-LR contamination have been reported in several countries, including the United States, Australia, China, Great Britain and Brazil (Carmichael, 2005). After the first human fatal incident ocurred in Brazil in 1996, the World Health Organization (WHO) set the provisional concentration limit of MC-LR in potable water to 1µg/L (WHO, 2008). The guideline value is the concentration at which, over a lifetime
9 water consumption, and the amount of water ingested (based on 60 kg, 80%, and 2L/day, respectively).
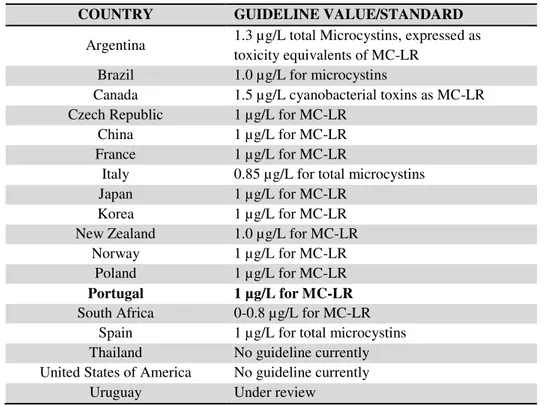
Table 2.1. Guidelines or legislation for MC-LR in drinking waters (adapted from Antoniou et al., 2005, Burch 2007 and WHO 2008).
COUNTRY GUIDELINE VALUE/STANDARD
Argentina 1.3 µg/L total Microcystins, expressed as toxicity equivalents of MC-LR
Brazil 1.0 µg/L for microcystins
Canada 1.5 µg/L cyanobacterial toxins as MC-LR Czech Republic 1 µg/L for MC-LR
China 1 µg/L for MC-LR France 1 µg/L for MC-LR
Italy 0.85 µg/L for total microcystins Japan 1 µg/L for MC-LR
Korea 1 µg/L for MC-LR New Zealand 1.0 µg/L for MC-LR
Norway 1 µg/L for MC-LR Poland 1 µg/L for MC-LR
Portugal 1 µg/L for MC-LR
South Africa 0-0.8 µg/L for MC-LR Spain 1 µg/L for total microcystins Thailand No guideline currently United States of America No guideline currently
Uruguay Under review
In Portugal, the Decree-Law Nº306/2007 establishes the value of 1µg/L for total (extra and
intracellular) MC-LR in drinking water analyzed at the water treatment plant exit whenever the raw surface water is suspected of eutrophication.
MC-LR exerts their toxic effect by interfering with a major cellular signal transduction mechanism, i.e., reversible phosphorylation. Reversible phosphorylation is like a switch that turns biological processes on and off. This is used to control a wide variety of cellular processes as diverse as muscle contraction, cell division, metabolism, and memory. MC-LR inhibits reversible phosphorylation by inhibiting the function of protein phosphatases and has been shown to significantly inhibit the catalytic subunits of only two specific types of protein phosphatases, protein phosphatase 1 (PP-1c) and protein phosphatase 2A, which leads to contraction of hepatocytes (liver cells) (Lambert et al., 1994). The cells start to separate, and the blood retained between them leads to local hepatocellular damage and shock (Falconer, 1996). Lethal doses lead to death within a few hours; however the intake of small doses leads to chronic disorder of the digestive system and liver. The lethal dose resulting in 50 per cent deaths (LD50) is in range 25-150 µg/kg body weight in mice (intra-peritoneal) (a value of 50 or 60
10
Human intoxications can occur when cyanobacteria toxin enter human organism orally, by inhalation or through the skin. Depending on the way of entrance and the dominant species in the bloom, intoxications can be divided into gastrointestinal, respiratory and dermatological (Premazzi and Volterra, 1993). Genera Microcystis is responsible practically for gastrointestinal intoxications.
MC-LR is believed to absorb into the intestinal cells and parenchymal cells via bile acid transporters. MC-LR may be excreted into the bile duct and excreted back into the intestine. The kidney removes MC-LR from blood by filtration in the glomerulus or possibly by active transport in the proximal tubules, as we can see in Figure 2.4 (Lambert et al., 1994).
When MC-LR is solvated in water, the solvated volume is 2.63 nm3 and the solvated area is 1.8
nm2. The longest molecular length in MC-LR, shown in Figure 2.3, is approximately 1.9 nm
(Pendleton et al., 2001). MC-LR has an estimated diameter between 1.2 – 2.6 nm (Antoniou et al., 2005).
Figure 2.3. Typical structural dimensions of microcystin-LR (adapted from Pendleton et al., 2001).
11 The graphical representation of the fractional concentration of the species in solution and the overall charge is presented below (Figure 2.4). MC-LR carryies a -1 net charge at pH 6-9, which is the common pH range in water treatment.
Figure 2.4. MC-LR species fraction and MC-LR net charge graph.
2.3. WATER TREATMENT OPTIONS FOR CYANOTOXINS
Soluble and particulate contaminant removal used in the by drinking water treatment: physical operations, chemical processes and biological processes (Table 2.2).
These operations may work singularly or in combination with each other to succeed contaminant reduction, which could be done through the ways of removal, degradation, and/or a reduction or inactivation of toxicity of the target compound. For cyanotoxins, the efficiency of removal in treatment processes is complicated by the fact that the toxins exist in two main forms: contained inside the intact cell (intracellular), and dissolved (extracellular). The microcystins are formed inside cyanobacterial cells. Dying and lysis of cyanobacteria release the microcystins into the water. Once released from the cell, the toxins, being highly soluble, will exist in dissolved form. The removal of intact cells is an effective way to prevent high
-2 -1 0 1 2
0 0.25 0.5 0.75 1
0 1 2 3 4 5 6 7 8 9 10 11 12 13 14
MC
-L
R
net
cha
rg
e
MC
-L
R
species
fra
ct
io
n
pH
MLRH3+ MLRH2 MLRH-
12
microcystin concentration in the treated water. Physical removal processes would therefore likely be the best form of treatment, although a toxin residual will be always released to water and dissolved toxins may require some additional treatment (Drikas et al., 2001).
Processes are considered with respect to their ability to remove both cyanobacterial cells and dissolved cyanotoxins, consequently evaluating total toxin removal capability. Physical and biological processes are often evaluated together.
Table 2.2. Cyanotoxin removal in drinking water treatment processes.
CHEMICAL PHYSICAL/BIOLOGICAL
Oxidation
Chlorine Chloramines Chlorine dioxide
Potassium Permanganate
Ozone
Coagulation Sedimentation
Flotation
Filtration
Rapid rate Slow sand Membrane Advanced oxidation Adsorption Activated carbon
In addition to the form of cyanotoxin in water, the types of toxin and water matrix composition are important for consideration in treatment process evaluation. The chemical composition, structure, and molecular weight and charge vary between toxin types. Water quality parameters, such as pH and temperature, will impact chemical and biological reaction rates and the performance of physical treatment. Background contaminants, such as natural organic matter (NOM), may also impact the efficiency of some processes.
Chemical processes for cyanotoxins removal mainly involve the use of oxidants to break the organic molecules which cause toxicity. Oxidants may also cause damage to cyanobacterial cell membranes, which may result in cell lysis and subsequent toxin release. Thus the application of chemical processes for cyanotoxin removal must therefore be approached with caution, especially when used during the first stages of treatment.
Conventional water treatment processes by coagulation/flocculation/sedimentation/filtration can remove cyanobacterial cells, but not the dissolved toxins (Falconer et al., 1989). These processes have generally proven ineffective at removing microcystin toxins in drinking water (Himberg et al., 1989 and Lambert et al., 1994).
13 removal if the toxins are still contained within the cell, but should most likely be used in combination with another process (es) if dissolved toxin removal is required.
Some treatment technologies have been developed to effectively remove the dissolved cyanotoxins. These technologies include oxidation and biological processes, membrane filtration and activated carbon adsorption. With respect to chemical removal, further studies are still needed for different cyanotoxins since they would respond differently to oxidation. For instance, permanganate, chlorine and ozone can effectively oxidize MC-LR (Arnette, 2009).
Micro-filtration (MF) and Ultra-filtration (UF) are used for particulate (i.e. cyanobacterial cell) removal and nanofiltration (NF) and reverse osmosis (RO) would be applicable for dissolved toxin removal, based on size exclusion. Nanofiltration has proved to be effective in the removal of cyanotoxins and cyanobacteria cells (Ribau Teixeira and Rosa, 2006).
Adsorption onto activated carbon (AC) is another technology that has proven to be mostly effective on the removal of cyanotoxins from water, although the efficiency of the removal depends on the type of water, carbon and type of toxin (Falconer et al., 1989 and Lambert et al., 1996; Campinas, 2009; Costa, 2010).
14
Table 2.3. Summary of techniques for treatment of cyanobacterial toxins (adapted from Newcombe and Nicholson, 2004).
Treatment
Process Cyanobacteria/Toxin Treatment Efficiency
Intact cells
Coagulation
Sedimentation Cyanobacterial cells Very effective for the removal of intracellular toxins
Rapid filtration Cyanobacterial cells Very effective for the removal of intracellular toxins
Slow sand
filtration Cyanobacterial cells
As for rapid sand filtration, with additional possibility of biological degradation of dissolved toxins Combined coagulation/ sedimentation/fi ltration Cyanobacterial cells
Extremely effective for the removal of intracellular toxins
Membrane
processes Cyanobacterial cells
Very effective for the removal of intracellular toxins
Dissolved Air
Flotation (DAF) Cyanobacterial cells
Very effective for the removal of intracellular toxins
Oxidation
processes Cyanobacterial cells
Not recommended as a treatment for cyanobacterial cells as this process can lead to cell damage and lysis and consequent increase in dissolved toxin levels Dissolved Toxins ADSORPTION Adsorption-powdered activated carbon (PAC)
Microcystins Very effective. Doses required vary with water quality.
Adsorption-granular activated
carbon (GAC) All dissolved toxins
Very effective Depending on the type of toxin and the water quality
Biological
filtration All dissolved toxins
15 Treatment
Process Cyanobacteria/Toxin Treatment Efficiency
Dissolved toxins
OXIDATION
Ozonation All dissolved toxins Ozonation is effective for all dissolved toxins except the saxitoxins. Doses will depend on water quality
Chlorination All dissolved toxins Most microcystins and cylindrospemopsin should be destroyed.
Chloramination All dissolved toxins Ineffective
Chlorine dioxide All dissolved toxins Not effective with doses used in drinking water treatment
Potassium
permanganate All dissolved toxins Effective for microcystin, limited or no data for other toxins
Hydrogen
peroxide All dissolved toxins Not effective on its own
UV radiation All dissolved toxins
Capable of degrading microcystin-LR and cylindrospermopsin, but only at impractically high doses or in the presence of a catalyst
EXCLUSION
Membrane
16
2.4. FUNDAMENTALS OF ADSORPTION
2.4.1.General
Adsorption is the phenomenon of accumulating substances that are in solution on a suitable interface. Adsorption is a mass transfer operation in that a constituent in the liquid phase is transferred to the solid phase. The adsorbate is the substance that is being removed from the
liquid phase at the interface (e.g. pollutant). The adsorbent (e.g. activated carbon) is the solid,
liquid, or gas phase onto which the adsorbate accumulates (Metcalf and Eddy, 2003).
Adsorbates are held on the surface by various types of chemical forces such as hydrogen bonds, dipole-dipole interactions, and van der Walls forces. If the reaction is reversible, as it is for many compounds adsorbed to activated carbon, molecules continue to accumulate on the surface until the rate of the forward reaction (adsorption) equals the rate of the reverse reaction (desorption). When this condition exists, equilibrium has been reached and no further accumulation will occur (Snoeyink and Summers, 1999).
When the process involves only van der Walls forces and there is no chemical change of adsorbed molecules, this is called physical adsorption (Figueiredo and Ribeiro, 2007).
The adsorption is chemical when established chemical bonds may be with the surface active
centers, leading to the formation of a chemical surface compound or a complex of adsorption (Figueiredo and Ribeiro, 2007).
Adsorbents of interest in water treatment include activated carbon, ion exchange resins; adsorbent resins; metal oxides, hydroxides, and carbonates; activated alumina; clays; and other solids that are suspended in or in contact with water (Snoeyink and Summers,1999).
Activated carbon (AC) adsorption is considered one of the best available technologies for
17
2.4.2. Production, physical and chemical characteristics of activated carbon
Activated carbon can be used to adsorb specific organic molecules that cause taste and odor, mutagenicity, and toxicity, as well as natural organic matter (NOM) that causes color and that can react with chlorine to form disinfection byproducts (DPBs) (Snoeyink and Summers, 1999). Activated carbon is prepared by first making a char from organic materials such as almond, coconut, walnut hulls and other materials including woods, bone, and coal (Metcalf and Eddy, 2003). Wood, peat, lignite, subbituminous coal, and bituminous coal are the substances predominately used for drinking water treatment carbons (Snoeyink and Summers, 1999).
Both the physical and chemical manufacturing processes involve carbonization. The char is produced by heating the base material to a red heat (less than about 700°C) in a retort to drive off the hydrocarbons, but with an insufficient supply of oxygen to sustain combustion. The carbonization or char-producing process is essentially a pyrolysis process. The char particle is then activated by exposure to oxidizing gases such as steam and CO2 at high temperatures, in
the range from 800 to 900°C. These gases develop a porous structure in the carbon (Figure 2.5), and thus create a large internal surface area (Metcalf and Eddy, 2003). The resulting pore sizes are defined as macropores (> 500Å), mesopores (20Å - 500Å) and micropores, these can be
divided into primary micropores (< 8Å) and secondary micropores (8Å - 20Å) (IUPAC,
2001).
The surface properties that result are a function of both the initial material used and the preparation procedure, so that many variations are possible. The type of base material from which the activated carbon is derived may also affect the pore-size distribution and the regeneration characteristics (Metcalf and Eddy, 2003).
18
After activation, the carbon can be separated into, or prepared in, different particle sizes with different adsorption capacities. The Figure 2.6 shows the two particle size classifications:
powdered activated carbon (PAC), which typically has a diameter of less than 0.074 nm (200
sieve), and granular activated carbon (GAC), which has a diameter greater than 0.1 nm (~140
sieve) (Metcalf and Eddy, 2003). The correct selection of AC (PAC or GAC) is crucial for determining the efficiency and cost of the process (Table 2.4).
Figure 2.6. Granular (a) and powdered (b) activated carbon (adapted from Xinhui Carbon Co., 2010).
The common methods for the selection of AC are the molass test, the methylene blue number, the phenol test, the alkylbenzene sulphonate test, the iodine number and the dechlorination column test (Summers and Cummings, 1992). The values of these numbers give useful information about the abilities of various activated carbons to adsorb different types of organics. However, even though these tests can give some information of the behaviour of AC, they do not evaluate the kinetics and the capacity to adsorb a specific micropollutant (Snoeyink and Summers, 1999).
Table 2.4. Comparison of granular and powdered activated carbon (adapted from Metcalf and Eddy, 2003).
Parameter Unit
Type of Activated Carbon (a)
GAC PAC
Total surface area
(BET) m2/g 700-1300 800-1800
Bulk density kg/m3 400-500 360-740
Particle density, wetted
in water (b) kg/L 1.0-1.5 1.3-1.4
Particle size range mm (µm) 0.1-2.36 (5-50)
Effective size mm 0.6-0.9 -
Iodine number 600-1100 800-1200
Ash % ≤ 8 ≤ 6
Moisture as packed % 2-8 3-10
(a) Specific values will depend on the source material used for the production of the activated carbon (b)
The particle density wetted in water is the mass of solid activated carbon plus the mass of water required to fill the internal pores per unit volume of particle (Metcalf and Eddy, 2003).
19 dose as the water quality changes (Table 2.5). This advantage is especially important for systems that do not require an adsorbent for much of the year (Snoeyink and Summers, 1999).
The disadvantages (Table 2.5), according to Snoeyink and Summers (1999), are the high operating costs if high PAC doses are required for long periods of time, the inability to regenerate, the low TOC removal, the increased difficulty of sludge disposal, and the difficulty of completely removing the PAC particles from the water. GAC therefore becomes a more economical choice in larger systems or where taste and odor must be controlled continuously.
Table 2.5. Advantages (+) and disadvantages (-) of the PAC and GAC systems (Cecílio et al., 2007).
CHARACTERISTIC PAC GAC
Easy adaptation to existing water treatment plants + - Variation of dosage with the water quality + - Removal capacity of AC on the downstream treatment - + Larger volume of sludge and holding costs - + Lower initial costs of investment + - Higher adsorption capacity and better process control - + Lifetime of AC (increased by biodegradation) - +
The point of PAC addition in the water treatment plant can occur in the rapid mix, in the flocculation stepor at the filter influent, not requiring any additional investment or special equipment, and being possible to use at any time. This is one of the major advantages of PAC. The major cost is related to the amount of PAC required, as it depends, not only on the micropollutant concentration, but also on the characteristics of the raw water. If the removal of microcystins from water is considered, doses above 20 mg/L of PAC are often required (Hrudey et al., 1999). Moreover, since PAC is not reutilized the amount of sludge produced is very high, and the cost of the treatment can be very high, especially if PAC is needed on a continuous basis.
20
Although the elemental composition of activated carbons can vary substantially, typical average elemental composition of activated carbon is approximately 88% C, 6-7% O, 1% S, 0.5% N, and 0.5% H, with the remainder being mineral matter (i.e., ash) (Edzwald, 1999).
Because of its abundance and significant effects on activated carbon hydrophilicity and surface charge, oxygen is generally the most important heteroatom of activated carbon surface chemistry. Oxygen commonly occurs in the form of carboxylic acid groups (–COOH), phenolic hydroxyl groups (–OH), and quinone carbonyl groups (>C=O). The activated carbon acidity is explained primarily by the formation of carboxylic acid and phenolic hydroxyl groups. The heteroatoms are important in determining the acidity/basicity of the AC surfaces in aqueous dispersion. Oxidation of activated carbon surfaces also occurs during the exposure of activated carbon to common oxidants used in water treatment, such as chlorine, permanganate, and ozone (Edzwald, 1999). Activated carbon can acquire an acidic character when exposed to oxygen between 473K and 973K or to oxidants such as air, water vapor, nitric acid, a mixture of nitric and sulfuric acids, and hydrogen peroxide, and acquire a basic character upon high-temperature (> 973K) treatment (Campinas, 2009).
2.4.3.Adsorption properties
Both physical and chemical characteristics of activated carbon affect its performance. Important adsorbent characteristics that affect adsorption include surface area, pore size distribution,
and surface chemistry (Snoeyink and Summers, 1999).
The manufacturer provides typical data that usually include the BET surface area. This
parameter is determined by measuring the adsorption isotherm for nitrogen gas molecules and then analyzing the data using the Brunauer-Emmett-Teller (BET) isotherm equation to determine the amount of nitrogen required to form a complete monolayer of nitrogen molecules on the carbon surface (Edzwald, 1999).
As one of the most important properties which influence the adsorption process, the pore size distribution (PSD) determines the fraction of the total pore volume that can be accessed by an
21 adsorption of contaminants. In aqueous systems, size exclusion is observed when the pore width is smaller than about 1.7 times the second largest dimension of the adsorbate (Li et al., 2002).
Hereupon, compounds are preferentially adsorbed in a pore of approximately its size, where there will be greater number of contact points and more promising adsorption energy (Newcombe et al., 1997) and they are size excluded if pores are too small compared to their size and shape. Consequently a correct pore size distribution provides not only the adsorption sites, but also the appropriate channels to transport, as a high volume of large transport pores (macro and mesopores), favors rapid diffusion to adsorption sites.
The chemical surface of the AC is heterogeneous due to the presence of atoms such as oxygen,
nitrogen, hydrogen, sulphur and phosphorus. The acidic character of an AC is related to the oxygen contents. Functional groups such as carboxyl, phenol, lactones, lactol and quinones have been described as sources of surface acidity (Boehm, 1994). Hydrophobic adsorbents (i.e. activated carbons with low oxygen content) exhibit larger adsorption capacities for organic micropollutants than hydrophilic adsorbents (i.e. activated carbons with high oxygen content) with similar physical characteristics (Edzwald, 1999).
The carbon surface charge will change from positive to negative by increasing the pH of the
wetting solution. This feature makes the point of zero charge (pHpzc) a very common and
important property of activated carbons. The point of zero charge (pzc) represents a pH condition where the surface ionic groups are neutralized to give an effectively uncharged surface (Pendleton et al., 2001). Below the pHpzc carbons will carry a net positive charge,
whereas they will be negatively charged above this point.
The electrostatic interactions between the carbon surface and the adsorbate molecules play an
important part in the adsorption process. This means that a positive surface will attract a negatively charged molecule (Figure 2.7a) while a negatively charged surface will repel a negatively charged molecule (Figure 2.7b) (Newcombe et al., 1997).
22
The mechanism and extent of adsorption have been shown to depend on: i) adsorbate structure (section 2.2.2); ii) AC characteristics (above mentioned); iii) solution chemistry and presence of competing compounds (section 2.4.4).
Both surface chemistry and pore volume distribution of AC play an important part in the adsorption, however, its relative importance will vary depending on the adsorbates and carbons. For example, for NOM, at pH 7, there is a strong evidence that electroestatic effects are determinant for adsorption (Newcombe and Drikas, 1997; Bjelopavlic et al., 1999). On the other hand, for microcystins, Pendleton et al., (2001) concluded about the major influence of the pore volume distribution (with a positive correlation with the volume of secondary micropores and mesopores) while Donati et al., (1994) showed no significant effect of the carbon surface chemistry.
The experimental techniques used to evaluate the AC properties include:
Elemental analysis, employed in most studies as a quantitative and qualitative
measurement for changes in carbon chemistry as a result of chemical modifications;
Surface titration, which include Boehm titration (Boehm, 1994) and mass titration, to
determine the pHpzc (Bjelopavlic et al., 1999 and Moreno-Castilla et al., 2000);
Temperature-programmed desorption (TPD), for the characterization of the solid
surfaces, namely surface oxygen groups on carbon materials decompose upon heating by releasing CO and CO2 at different temperatures, producing distinct peaks
(Figueiredo and Ribeiro, 2007);
Infrared spectroscopy (IR), for the determination of surface groups, namely by
Fourier Transform IR (FTIR) (Moreno-Castilla et al., 2000);
X-ray photoelectron spectroscopy (XPS), based on the photoelectric effect, where the
23
2.4.4. Solution chemistry
Besides the characteristics of the target adsorbate (e.g. molecular size, hydrophobicity, functional groups) and the adsorbent (e.g. AC surface area, pore size distribution, functional groups) which determine the adsorbent - adsorbate interactions and the adsorbate access to the adsorbent pores, the characteristics of the solution (e.g. temperature, pH, ionic strength, NOM) also influence the adsorption.
Although the greatest concern is the ability for several strains of cyanobacteria to produce potent toxins as secondary metabolites, the cyanotoxins, cyanobacterial blooms seasonally challenge drinking water treatment due to the massive input of cells and also the release of
algogenic organic matter (AOM) into the water, causing poor settling, filter blockage, tastes
and odors, disinfectant consumption and production of disinfection by-products. These organic substances include a wide range of compounds, such as oligo and polyssaccharides, proteins, peptides, amino acids and also traces of other organic acids (Pivokonsky et al., 2006).
2.4.4.1. Natural Organic Matter (NOM)
Natural organic matter (NOM) is present in all drinking water sources and is a complex mixture of compounds formed from the breakdown of plant and animal material in the environment (Bjelopavlic et al., 1999). Although strongly dependent on the nature of the local environment, NOM includes a wide range of compounds, from small, low molecular weight species (such as carboxylic and amino acids), to larger, high molecular weight (from 500 to 30000 Da) humic and fulvic acids and proteins.
Most of the compounds present in NOM carry a negative charge, generally attributed to carboxylic acid and phenolic groups, meaning that the larger compounds behave as polyelectrolytes in aqueous solution (Newcombe and Drikas, 1997).
The presence of NOM has been shown to impact upon all drinking water treatment processes, from alum coagulation (the removal of particulate and colloidal matter using aluminium sulphate) to chlorine disinfection. It has also a harmful effect on activated carbon adsorption as NOM is usually present in much higher concentrations (mg/L levels) than the target microcontaminants (µg/L levels) pesticides and algal toxins, and nanocontaminants (ng/L
24
This process is known as “carbon fouling” and is of special concern in water treatment plants (Newcombe and Drikas, 1997).
Carbon-adsorbate interactions are mainly of hydrophobic or electrostatic nature. In case of electrostatic interactions, the water ionic matrix plays an important role. Ionic strength may reduce or enhance AC adsorption of NOM (Newcombe and Drikas, 1997) and microcystins (Campinas and Rosa, 2006). Whenever the electrostatic interactions between the carbon surface
and the adsorbate are attractive and the adsorbate’s concentration on the carbon surface (surface
concentration) is low, an ionic strength increase will lessen adsorption (Newcombe and Drikas, 1997). Converse, if electrostatic interactions are repulsive or high concentrations occurs (which lead to lateral repulsion between adsorbed molecules), non-electrostatic forces govern adsorption and an ionic strength increase will enhance adsorption (Newcombe and Drikas, 1997; Campinas and Rosa, 2006) due to electrostatic shielding effects.
For both NOM (Newcombe and Drikas, 1997) and microcystins (Campinas and Rosa, 2006), such different ionic strength effects may be due to the prevailing type of adsorbate-adsorbent interactions (which depend upon the carbon and the adsorbent net charges and hydrophobicity),
the cation charge (mono or divalent), and the adsorbate’s surface concentration and molecular
size.
2.4.5. Adsorption mechanisms and models
The adsorption capacity of adsorbents is one of the most important criterions to assess the performance of the adsorbents. The most convenient and direct way to investigate the adsorption capacity for an adsorbent to an adsorbate is to conduct an equilibrium isotherm study (Ip et al., 2010). When the amount of solute being adsorbed onto the adsorbent is equal to the amount being desorbed, equilibrium is achieved and the capacity of the carbon has been reached (Metcalf and Eddy, 2003).