Miguel Tiago Nunes Fernandes
Licenciado em Biologia Celular e Molecular
Studies on the Wine Spoilage Yeast
Brettanomyces bruxellensis
: 4-Ethylphenol
Production and Improved Detection
Dissertação para obtenção do Grau de Mestre em
Biotecnologia
Orientador: Professor Manuel Malfeito Ferreira
Presidente: Prof. Doutora Susana Filipe Barreiros
Arguente: Prof. Doutora Paula Maria Theriaga Mendes Bernardo Gonçalves
Studies on the wine spoilage yeast
Brettanomyces bruxellensis
: 4-ethylphenol
production and improved detection
i
Agradecimentos
Queria agradecer a todas as pessoas que, de uma maneira ou de outra, me ajudaram à realização deste trabalho.
Em primeiro lugar queria agradecer ao Professor Manuel Malfeito pela oportunidade de trabalhar no seu grupo de investigação, crescendo tanto a nível profissional como pessoal. Agradeço especialmente todo o conhecimento transmitido e entusiasmo e dedicação incutidos ao longo de todo o ano, criando as condições necessárias para o sucesso deste trabalho. Não posso também deixar de agradecer as várias oportunidades de conhecer a indústria vitivinícola desde a participação em vindimas, produção e análise de vinho e empresas de biotecnologia associadas ao sector através da participação nos seus congressos científicos.
À Sara Santos, um especial agradecimento pela orientação e críticas construtivas, disponibilidade constante na discussão dos resultados e acima de tudo, pela partilha de conhecimentos contribuindo de forma determinante para o trabalho desenvolvido. De salientar também a nível pessoal, a sua
“permanente” boa disposição, a sua constante e agradável voz e a grande amizade criada ao longo
destes meses.
O meu maior obrigado também à Joana Viseu de Alvalade e à impecável Marta Egídio por toda a disponibilidade e apoio proporcionado no dia-a-dia de trabalho bem como a grande amizade criada. Joana, obrigado também pela boa disposição e sportinguismo. Marta, muito obrigado também pelos convites e pelas interessantíssimas conversas sobre moda. Obrigado por serem tal e qual como são.
Um obrigado ao “grupinho” da fisiologia do ISA, Ricardo, Alexandre e Catarina pelos bons momentos
de descontracção e ajuda prestada sempre que precisava.
Aos membros do laboratório de Microbiologia do ISA, Carla Silva, Rute Coutinho, Mahesh Chandra, dona Helena e dona Manuela agradeço a vossa constante disponibilidade para tudo.
Aos amigos da licenciatura, Diane, Pedro Rodrigues, Vasco, Marta, Pedro Dionísio obrigado por me fazerem crescer sempre com um grande sorriso e ultimamente com enormes saudades. Aos amigos
do “nicho de Biotec” incluindo o Duarte, um grande obrigado por fazerem o mestrado passar tão
rápido. Em especial aos amigos de maior data Tiago e Cláudia. Muito obrigado por estarem presentes e pelos poucos mas bons double dates.
Agradeço também aos meus pais. Pai, mãe, muito obrigado pelo apoio constante, por tudo o que fizeram por mim e pelo amor incondicional que sempre demonstraram. À minha mana, ao Pedro, aos meus lindos sobrinhos e ao meu padrinho, obrigado por tudo e mais alguma coisa. Obrigado também pelos almoços e jantares em família que me fazem sempre feliz. Um agradecimento especial também para a minha namorada Cláudia. Obrigado por estares sempre comigo nos bons e maus momentos, por me fazeres feliz todos os dias e acreditares de forma incondicional em mim.
iii
Table of Contents
Agradecimentos
... i
Index of Figures
... v
Index of Tables
... vii
Abstract
... ix
Resumo
... xi
1
Introduction
... 1
1.1
The wine economy and market... 3
Wine production ... 3
Wine consumption ... 4
Wine market ... 4
1.2
Wine microbiology ... 5
Wine microbial consortium ... 5
Control measures ... 7
1.3
Dekkera/Brettanomyces
... 7
History and taxonomy ... 7
Growth conditions ... 8
Secondary metabolism ... 9
Viable but non culturable state ... 10
1.4
Volatile Phenols ... 11
The formation pathway ... 11
Presence in wines and quality depreciation ... 12
Non-
Brettanomyces
species and volatile phenols ... 13
Detection by gas chromatography... 14
1.5
Detection and Quantification... 14
Culture media ... 15
Molecular methods ... 16
Real-Time PCR ... 17
1.6
Objectives ... 19
2
Materials and Methods
... 21
2.1
Species and strains ... 23
iv
2.3
Equipment ... 24
2.4
Software ... 25
2.5
General methods ... 25
Growth media preparation ... 25
Determination of 4-ethylphenol ... 25
DNA extraction and Real-Time PCR ... 26
2.6
Impact of growth phase in the nonculturable
Brettanomyces bruxellensis
population and 4-ethylphenol production ... 26
2.7
Growth features of
Brettanomyces bruxellensis
on existent culture media ... 27
2.8
Development of a new selective medium ... 27
2.9
Real-Time PCR implementation ... 28
3
Results and Discussion
... 29
3.1
Impact of growth phase in the nonculturable
B. bruxellensis
population and
4-ethylphenol production ... 31
3.2
Growth features of
Brettanomyces bruxellensis
on existent culture media ... 36
3.3
Development of a new selective medium ... 38
3.4
Real-Time PCR implementation ... 41
4
Conclusions
... 45
v
Index of Figures
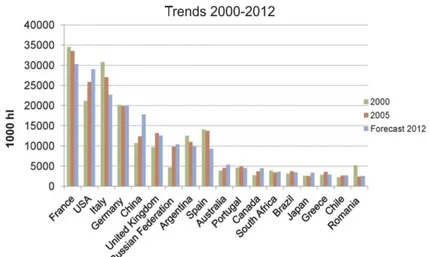
Figure 1.1 - Growth rate of wine production from 2008 to 2012 for main wine producers worldwide. ... 3
Figure 1.2 - Consumption of wine in leading countries and in 3 different years. ... 4
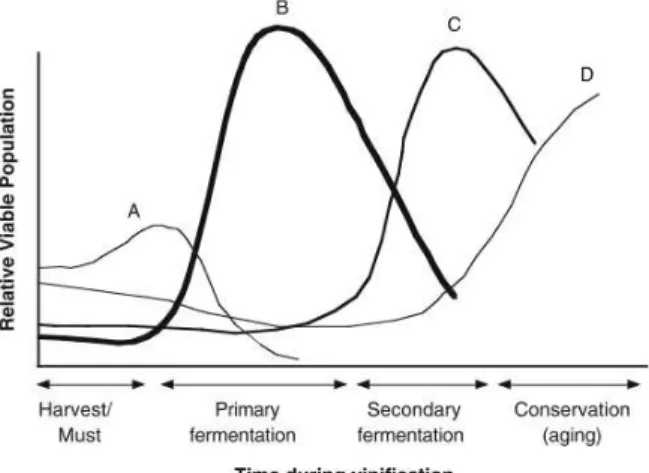
Figure 1.3 - Microbiological population during vinification. (A) non-Saccharomyces yeasts, (B) Saccharomyces spp., (C) Oenococcusoeni and (D) spoilage microorganisms. ... 5
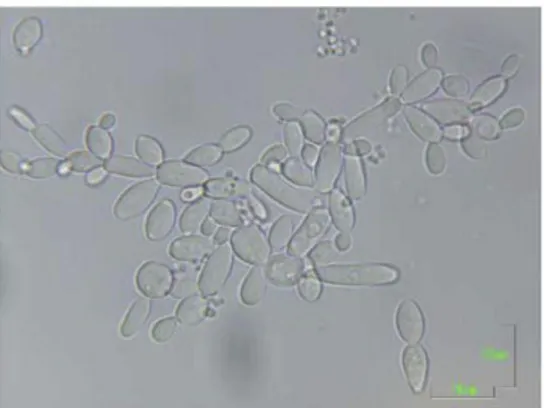
Figure 1.4 – Morphological differences of Brettanomyces spp. under optical microscope observation
at 1000x amplification. ... 8
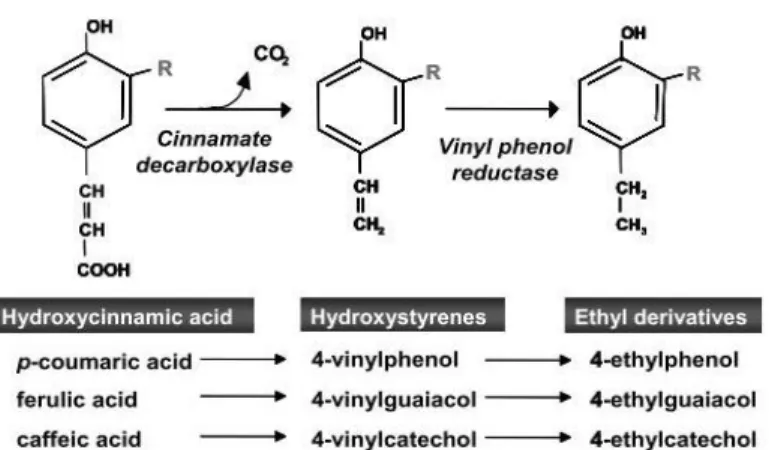
Figure 1.5 – Synthesis of volatile phenols from the hydroxycinnamic acids. ... 11
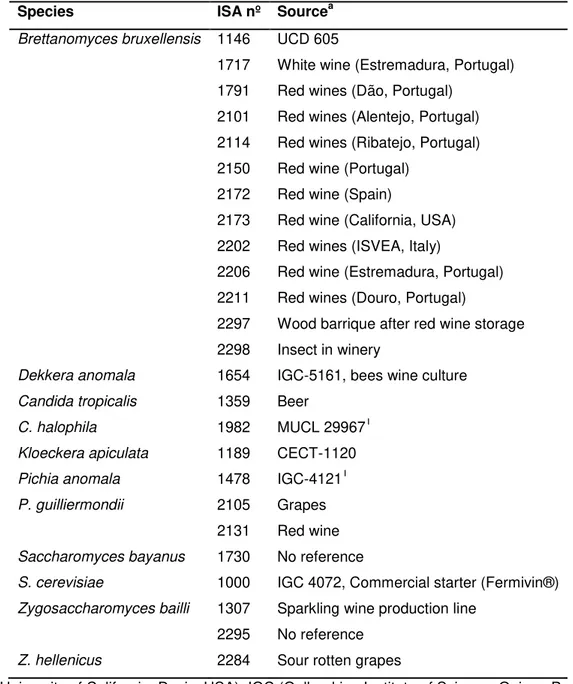
Figure 3.1 - Growth of B. bruxellensis ISA 2211 strain in GYP medium. Concentration of B. bruxellensis was measured in GYP plate (cfu/mL), hemocytometer count with vital staining (viable
cells/mL, nonviable cells/mL and total cells/mL) and absorbance at 620nm. ... 31
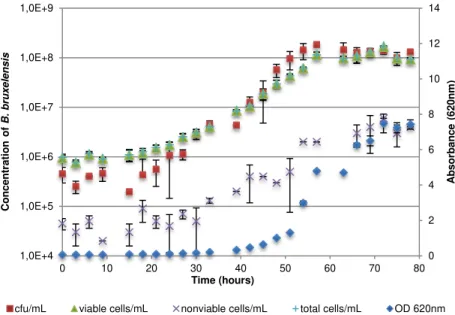
Figure 3.2 - Growth of B. bruxellensis ISA 1791 strain in GYP medium. Concentration of B. bruxellensis was measured in GYP plate (cfu/mL), hemocytometer count with vital staining (viable
cells/mL, nonviable cells/mL and total cells/mL) and absorbance at 620nm. ... 32
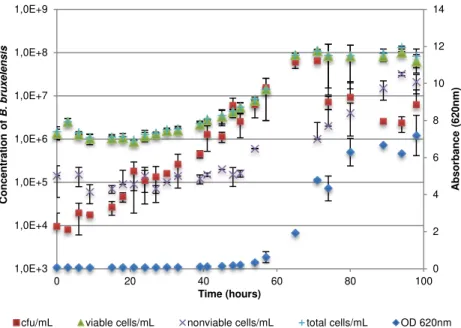
Figure 3.3 - Growth of B. bruxellensis ISA 1791 in synthetic culture medium GYP. (1) Addition of
p-coumaric acid at day 0, (2) addition of p-p-coumaric acid at day 1, (3) addition of p-p-coumaric acid at day 2 and (4) addition of p-coumaric acid at day 3. ... 33
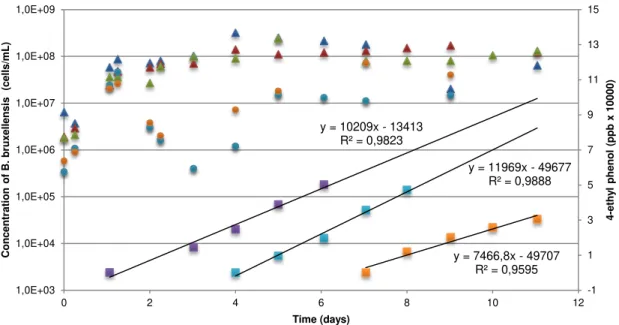
Figure 3.4 - Growth of B. bruxellensis ISA 1791 in synthetic culture medium GYP. (1) Addition of
p-coumaric acid at day 1, (2) addition of p-p-coumaric acid at day 4 and (3) addition of p-p-coumaric acid at day 7. ... 34
Figure 3.5 - Evolution of the maximum diameter for every 13 strains of B. bruxellensis growth in solid
GYP, modified WL and DBDM. ... 36
Figure 3.6 - Evolution of the maximum diameter for B. bruxellensis strain ISA 2211 in lag phase (A)
and exponential phase (B) growth in solid GYP, WL, Media A and Media B. ... 39
Figure 3.7 - Evolution of the maximum diameter for B. bruxellensis strain ISA 1791 in lag phase (A)
and exponential phase (B) growth in solid GYP, WL, Media A and Media B. ... 39
Figure 3.8 - Amplification curves (A) of RT PCR analysis of serial dilution of DNA extracted from cells of B. bruxellensis ISA 2211 and melting temperature curves (B) of the generated amplicons. ... 41
Figure 3.9 - Standard curve obtained from the DNA extracted of B. bruxellensis ISA 2211 serially
vi
Figure 3.10 - Standard curve obtained from DNA extracted from serially diluted concentrations of B. bruxellensis ISA 1791. ... 42
Figure 3.11 - One of the three quantifications tests done using a standard curve obtained from DNA extracted from serially diluted concentrations of B. bruxellensisISA 1791 (●) and DNA extracted from
2 different concentrations of B. bruxellensis ISA 2211 (). ... 43
Figure 3.12 - Graphical representation of the quantification difference of B. bruxellensis ISA 2211 by
vii
Index of Tables
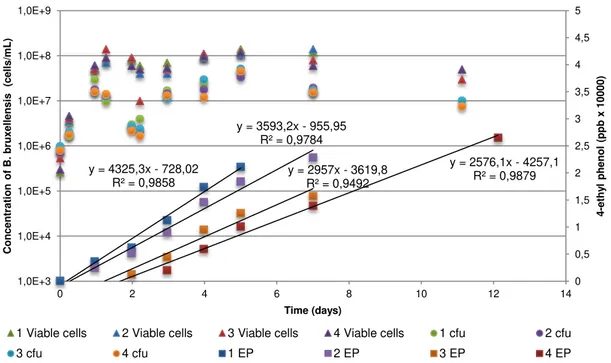
Table 2.1 - Source and code of used strains. ... 23
Table 3.1 – Parameters calculated from the growth curves of B. bruxellensis ISA 2211 and ISA 1791
strains. ... 33
Table 3.2 - Production rate determined for each 4 flasks with the addition of p-coumaric at different times. Production rate was determined by the slope of the trend line of 4EP concentration vs. time. . 34
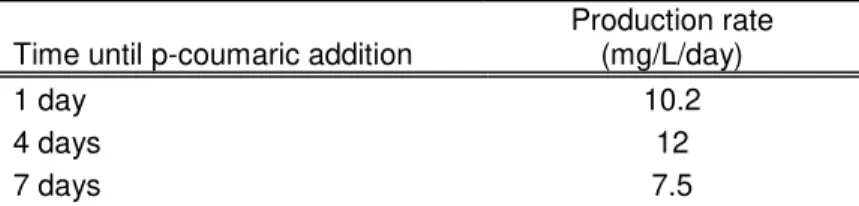
Table 3.3 - Production rate determined for each 3 flasks with the addition of p-coumaric at different times. Production rate was determined by the slope of the trend line of 4EP concentration vs. time. . 35
Table 3.4 - Important data from the incubation of 13 strains of B. bruxellensis on solid GYP, WL and
DBDM media. ... 37
Table 3.5 - Evaluation of medium selectivity by growth, acid production and phenolic smell inoculated with several yeast species. ... 38
Table 3.6 – Results regarding two strain in different growth phases. Viable cell concentration was determined by hemocytometer count with vital staining. Culturable cells were determined by plate counting in different media. Percentage of recovery from viable cells on each media is labeled as %.40
Table 3.7 - B. bruxellensis ISA 2211 quantification by three Real-Time PCR analysis and their
respective correlation coefficients and efficiencies. ... 43
Table 3.8 - B. bruxellensis ISA 2211 quantification by plate counting on GYP and Medium B, by
ix
Abstract
Brettanomyces bruxellensis is a major threat to wine industry due to its spoilage ability characterized
by high production of volatile phenols, mainly 4-ethylphenol. The horse sweat odor, characteristic of this phenol, causes large economic losses to wineries. A better understanding of the behavior of this yeast and better detection methods may lead to a decrease in 4-ethylphenol incidence in red wines worldwide.
In the present work, we studied: (i) the ability of B. bruxellensis to enter the viable but nonculturable
state by using both vital staining and plate counts to distinguish between viable and culturable cells; (ii) the production of 4-ethylphenol at different growth phases; (iii) the improvement of selective culture media; (iv) the application of a Real-Time PCR protocol for the rapid detection of B. bruxellensis.
The existence of a viable but nonculturable state was evidenced during growth in synthetic medium ranging from 2% in strain ISA 2211 to 71% in strain ISA 1791 of the viable cells. The production rate of 4-ethylphenol was maximum when the precursor p-coumaric acid was added during exponential growth and decreased in stationary phase with incubation time. The developed selective medium presented recovery rates higher than the general purpose medium GYP and selectivity similar to DBDM. Response time lasted from 3 to 5 days while DBDM colonies appeared only after 12 days or more of incubation. Real-Time PCR showed to be an easy and faster method for a highly selective detection, taking 3 hours to obtain a positive response. The detection threshold was 700 cells/mL which may be decreased using sample concentration by centrifugation. However, results were 3.7 times higher than the viable counts, probably due to the DNA of dead or lysed cells.
Collectively, this work represented a step forward in understanding the spoiling behavior of this yeast species and enabled the development of better detection methods for B. bruxellensis.
Keywords:Brettanomyces bruxellensis, wine spoilage, viable but nonculturable state, 4-ethylphenol,
xi
Resumo
Brettanomyces bruxellensis é uma grande ameaça na indústria vinícola devido à sua capacidade de
alteração do vinho. O cheiro a suor de cavalo, característico deste fenol, cria grandes perdas económicas na indústria vinícola. Um maior conhecimento do comportamento desta levedura e melhores métodos de detecção podem levar a uma diminuição na incidência de 4-etilfenol em vinhos tintos.
Neste trabalho estudámos: (i) a capacidade de B. bruxellensis entrar no estado viável mas não
cultivável usando coloração vital e contagem de placas, distinguindo células viáveis de cultiváveis; (ii) a produção de 4-etilfenol em diferentes fases de crescimento; (iii) o melhoramento de meios de cultura selectivos; (iv) a aplicação de um protocolo de Real-Time PCR para uma rápida detecção de
B. bruxellensis.
O estado viável mas não cultivável foi demonstrado durante o crescimento em meio sintético, variando entre 2% da população viável na estirpe ISA 2211 e 71% na estirpe ISA 1791. A taxa de produção do 4-etilfenol foi máxima quando o percursor ácido p-cumárico foi adicionado durante a fase exponencial e menor na fase estacionária. O meio de cultura selectivo desenvolvido apresentou taxas de recuperação superiores às do meio de cultura GYP e selectividade idêntica ao DBDM. O tempo de resposta foi de 3 a 5 dias comparativamente aos 13 dias ou mais no DBDM. O Real-Time PCR mostrou ser um método de detecção específico, fácil e rápido, com resultados em 3 horas. O limite de detecção de 700 células/mL pode ser reduzido concentrando a amostra por centrifugação. No entanto, este método sobrestima a quantidade em 3,7 vezes, provavelmente devido ao DNA de células mortas ou lizadas.
Em suma, este trabalho representa um passo em frente no conhecimento do comportamento de alteração desta espécie e permitiu o desenvolvimento de melhores métodos de detecção de B. bruxellensis.
Palavras-chave: Brettanomyces bruxellensis, alteração de vinhos, estado viável mas não cultivável,
1
3
Figure 1.1 - Growth rate of wine
production from 2008 to 2012 for main wine producers worldwide (Organisation internationale de la Vigne et du Vin, 2013d).
1.1 The wine economy and market
Biotechnology, as we know it, can be defined as the use of biological systems in industrial processes. As so, it’s easy to link it to the wine industry since wine is undoubtedly the oldest biotechnological effort since signs of large-scale winemaking activities date to, at least, 5000 BC (Borneman et al., 2013). In the biotechnology world, the economy and market surrounding the industry are of extreme importance. However, it is not easy to study the wine industry economy since it comprehends 3 sections of the agriculture sector: the agriculture activity by itself, the agriculture industry and the market of agriculture products.
In 2011, the agriculture sector in Portugal had 28 thousand companies from which 82% were microenterprises, 17.6% small and medium enterprises and only 0.4% were big enterprises (Banco de Portugal, 2012) with an active population of 500 thousands (Pordata, 2013).
The wine industry is an important part of the agriculture in Portugal representing 13% of the total agriculture generated value in 2007 being the second most valuable product in the vegetal production
with 861 millions € (Instituto da Vinha e do Vinho I.P., 2009).
The wine industry itself is analyzed mainly by the Organisation internationale de la Vigne et du Vin (OIV) in an international view and by Instituto da Vinha e do Vinho (IVV) with more emphasis on the national situation. OIV is an intergovernmental organization of a scientific and technical nature, of recognized competence for its works concerning vines, wines and other vine-based products (Organisation internationale de la Vigne et du Vin, 2011). This organization is responsible for the regulation of the viti-viniculture practices and treatments, aiming at a standardization of the sector. All the OIV member countries approved the International Code of Oenological Practices which constitutes a technical and legal reference document for the sector (Organisation internationale de la Vigne et du Vin, 2013a). The mission of the IVV consists in coordinate and control the institutional organization of the vitiviniculture sector, audit the system of quality control, following the European Union policy and prepare the rules for its implementation (Instituto da Vinha e do Vinho I.P., 2013).
Wine production
4
Wine consumption
Because of the financial crisis, the wine consumption started to fall since 2007 (Organisation internationale de la Vigne et du Vin, 2013b). In 2007 the world consumption of wine was around 255 or 251 millions of hl and until the year 2009 where it stabilizes, the world consumption dropped around 11 millions of hl. The European countries continue leading by far the world consumption with 65% in 2009. The major wine consumers in descending order are summarized in Figure 1.2.
Another interesting view is the consumption per capita per year. With this, we can consider the population of a country and estimate the individual human consumption of a country. The countries with a major individual human consumption per year in 2011 are Luxembourg with 49.8 L per capita per year, France with 46.4 and Portugal with 42.6 (Organisation internationale de la Vigne et du Vin, 2013b, 2013c, 2013d).
Wine market
The wine market is important in the wine economy and we can see how important it is when we know that from 10 liters of wine consumed, 4 of them have always been exported or imported (Organisation internationale de la Vigne et du Vin, 2013c). Exports of wine worldwide are increasing since 2000 with an exception of a small decrease in 2008 (-3.5% from 2007) where the financial crisis took an important role. In 2000 the exports were around 60 millions of hl but in 2012 the exports ascend to 101.4 millions of hl (+69%). If we talk about the wine trade in value, in 2000 the sum of all exports was around 13700€ but in 20011 the number goes up to 23245€ (+70%) (Instituto da Vinha e do Vinho I.P., 2012; Organisation internationale de la Vigne et du Vin, 2013b, 2013c, 2013d).
The major wine exporters in the year of 2011 were Italy, Spain and France (Organisation internationale de la Vigne et du Vin, 2013c, 2013d). Portugal comes in 10th place with almost 3 millions of hl in 2011 and 3.27 millions hl in 2012 (Instituto da Vinha e do Vinho I.P., 2012; Organisation internationale de la Vigne et du Vin, 2013d). The top importers countries of Portuguese wine are Angola with 0.5 million of hl, France with 0.325 and Germany and United Kingdom with around 0.150 each (Portugal, 2009).
Figure 1.2 - Consumption of wine in leading countries and in 3
5
1.2 Wine microbiology
Wine microbiology represents a complex interaction of microorganisms there present. The microorganisms found in wine, are present on grapes before their reception in the vinery. Louis de Pasteur, in 1872, was the first to study wine microbiology and showed that the microorganisms responsible for wine fermentations are present on the surface of grapes in the vineyard environment and that they play an important role in wine quality (Barata et al., 2012; Martins et al., 2012; Renouf et al., 2005).
The diversity present on the grapes surface that can support the harsh conditions of the wine, play an important role on wine production. The high concentration of sugars, the nitrogen, the salts, some trace elements and oxygen in grape must become a selective ecosystem. In fact, at the start of vinification, many microorganisms undergo sequential substitutions due to competitive exclusion from less adapted ones (Figure 1.3A) (Fugelsang and Edwards, 2007; Perrone et al., 2013).
Wine microbial consortium
The wine microbial consortium (WMC) consists of yeasts, acetic acid bacteria and lactic acid bacteria that can grow in conditions such as the high alcohol concentration, low pH and low nutrients availability. The consortium can be divided in 3 groups (Barata et al., 2012):
1. Innocent or innocuous species, easily controllable species, meaning they can’t spoil wine when good manufacturing practices (GMP’s) are used. GMP’s consist mainly in washing and sanitizing tanks, lines, and other equipment between each use and the proper use of chemical preservative agents or physical treatments like filtration or pasteurization (Loureiro and Malfeito-Ferreira, 2003);
2. Fermentative species, responsible for sugar and malic acid conversion;
3. Spoilage sensu stricto species responsible for wine spoilage when GMP’s are used.
In the first group, regarded as innocent, are acetic acid bacteria (AAB) mostly from the genera
Acetobacter like Acetobacter pasteurianus. AABs can spoil wine with an excessive production of
acetic acid from ethanol, however, they can easily be controlled using GMP’s in wine production (Barata et al., 2012; Bartowsky et al., 2003; Martins et al., 2012).
In the second group, we find one of the most important species of the WMC, Saccharomyces cerevisiae (Figure 1.3B). This fermentative yeast is the major responsible for the alcoholic
fermentation (AF) of turning grape juice into wine, but others (S. bayanus and S. paradoxus) can do or
cooperate in the fermentation (Perrone et al., 2013). In the exothermic reaction of the AF, the yeast consumes the sugar and produces carbon dioxide, increasing temperature and alcohol, inhibiting more sensitive microorganisms. Even though S. cerevisiae is responsible for wine AF and easily found
Figure 1.3 - Microbiological population during
vinification. (A) non-Saccharomyces yeasts, (B)
Saccharomyces spp., (C) Oenococcusoeni and
6
in wine and wineries, it is rarely found in healthy grapes. First, Martini (1993) concluded that S. cerevisiae does not live in nature at all and could only be found in the winery environment. This was
proven wrong in 1999, where Mortimer and Polsinelli (1999) demonstrated that even rarely, S. cerevisiae was found about 0.05 to 0.1% in healthy berries and 25% in damaged ones with numbers
between 105-106/berry. So, the origin of the yeast responsible for wine AF holds a still open debate regarding if it is maybe the first domesticated microbe (Loureiro and Malfeito-Ferreira, 2003; Martini, 1993).
Another important species in the second group of the WMC is Oenoccocus oeni, the best adapted
lactic acid bacteria (LAB) to the stressful wine environment. O. oeni is the most common
representative agent in spontaneous malolactic fermentation (MF) (Figure 1.3C) however, other species of LAB like Lactobacillus, Pediococcus and Leuconostoc may also participate in it. Due to its
characteristics, O. oeni is the selected bacteria for commercial starter cultures worldwide. In MF,
normally after AF, the malic acid is converted into lactic acid with production of CO2. This
bioconversion (and not a real fermentation) helps to increase the pH, increasing the microbial stability of wines. Also, the MF plays an important role to the wine aroma and flavor profile. After MF is completed, other species are still able to metabolize residual sugar, the sugar not used by previous microorganisms, spoiling the wine with off-flavors or ropiness (an increase in viscosity and a slimy mouth feel). O. oeni, just like S. cerevisiae, is also rarely detected in grapes being the others
mentioned LABs much more frequently observed in the vineyard (Barata et al., 2012; Lerm et al., 2010; Martins et al., 2012; Renouf et al., 2005).
As for the third group of WMC, the group of species that are responsible for wine spoilage when
GMP’s are used, it includes Lactobacillus spp. and Pediococcus spp. Their activity can continue after
the MF, when they are most likely to spoil the wine (Barata et al., 2012; Lerm et al., 2010). However, in this third group, yeasts are the main intervenient since improvement in GMPs like equipment design, sanitation procedures, better use of preservatives and wine technological advances led to the extinction of most traditional bacterial spoilage (Loureiro, 2003). The spoilage yeasts are technologically relevant typically due to their ability to produce diverse secondary metabolites. The most common are: acetaldehyde by film-forming yeasts during bulk storage; hydrogen sulphide by S. cerevisiae during fermentation with nitrogen shortage; volatile phenols by Dekkera/Brettanomyces bruxellensis between fermentation, during storage or after bottling; sediment and cloudiness formation
by Zygosaccharomyces bailii (Barata et al., 2012; Malfeito-Ferreira, 2010a).
Even using preventive measures, some hazards are difficult to avoid like the production of volatile phenols by Dekkera/Brettanomyces bruxellensis posing a major concern to wine quality and wine
economy today (Loureiro and Malfeito-Ferreira, 2006, 2003; Malfeito-Ferreira, 2010a; Oelofse et al., 2008). The most critical points for contamination with the spoilage yeas B. bruxellensis is between the
two fermentations, in bottling line and at the aging step (Figure 1.3C), especially when this aging is made in wood barrels because of the difficult to sanitize them. Commonly, B. bruxellensisisn’t present
7
Control measuresWine spoilage can be a big problem since it causes depreciation or rejection of the product, leading to serious economic losses (Fugelsang and Edwards, 2007; Loureiro and Malfeito-Ferreira, 2003; Malfeito-Ferreira, 2010a; Oelofse et al., 2008; Zuehlke et al., 2013). Most of the hazards mentioned above, can be avoided by current preventive or curative measures. This control normally involves the use of chemical compounds, filtration or even temperature control. The chemical compounds normally used are sulphur dioxide (SO2) and dimethyl dicarbonate (DMDC). The most used preservative agent
in winemaking, SO2, may inhibit the growth of microorganisms but does not necessarily kill them so
the timing of the addition and concentration added is of extreme importance (Fugelsang and Edwards, 2007). For example, after AF and before MF starts, the addition should be minimal or inexistent to let LAB make the fermentation. However, some spoilage microorganisms may intervene in this step. The other preservative commonly used in winemaking is DMDC. DMDC activity is related to metabolic enzymes inhibition. It has shown to be effective too, but is little soluble in water and it needs expensive special equipment to ensure product homogenization. Moreover, this chemical is toxic by ingestion and inhalation before his hydrolysis (Costa et al., 2008; Fugelsang and Edwards, 2007; Organisation internationale de la Vigne et du Vin, 2013e).
1.3
Dekkera/Brettanomyces
History and taxonomy
The first description of the Brettanomyces genus was made by Claussen in 1904. Claussen isolated
the yeast responsible for a slow stock beer secondary fermentation of an old English stock beer producing typical strong flavors. Back then, the flavors produced by this yeast were characteristic of British beers (Loureiro and Malfeito-Ferreira, 2006; Oelofse et al., 2008).
Regarding wine contamination, it was only around 1950s that Brettanomyces was isolated in French,
South African and Italian wines (Fugelsang and Edwards, 2007; Zuehlke et al., 2013). However, some authors say that the first appearance of Brettanomyces genus was in 1933 in a French grape must under the name of Mycotorula intermedia (Loureiro and Malfeito-Ferreira, 2006). In fact, this
nomenclature was revised in 1940 by Custers in the first systematic study on Brettanomyces (Loureiro
and Malfeito-Ferreira, 2006; Oelofse et al., 2008).
Originally, the genus Brettanomyces included the species B. bruxellensis, B. lambicus, B. clausenii
and B. anomalus, all of them described by Custers and reproducing asexually by budding. Later, in
1964, Van der Walt and Van der Kerken introduced the genus Dekkera to the taxonomy after they
observed the production of ascospores by Brettanomyces (Loureiro and Malfeito-Ferreira, 2006;
Oelofse et al., 2008). Thus, the genus Brettanomyces refers to the anamorph state, which means the
asexually reproducing stage of the life cycle and the genus Dekkera to the teleomorph state, which
8
D. anomala and D. bruxellensis (Fugelsang and Edwards, 2007; Loureiro and Malfeito-Ferreira, 2006;
Oelofse et al., 2008; Zuehlke et al., 2013). From the 5 species of the genera, B. bruxellensis (D. bruxellensis anamorph form) is the primarily associated with wine contamination being the best
represented species (Loureiro and Malfeito-Ferreira, 2006; Oelofse et al., 2008; Zuehlke et al., 2013). Even though technically incorrect, the name B. bruxellensis, is commonly seen in a winemaking
context since the sporulating form or ascospores were never reported in wine (Oelofse et al., 2008). That is probably why it is not uncommon to see the denomination “Dekkera/Brettanomycesspp.” used
frequently in wine research (Loureiro and Malfeito-Ferreira, 2006; Oelofse et al., 2008). The cells of the Dekkera/Brettanomyces genus are
spherical, ogival or cylindrical to elongate with typical dimensions of 2 to 7µm (Figure 1.4). Occasionally, cells can even appear in form of pseudomycelium (Fugelsang and Edwards, 2007; Smith, 2011a, 2011b; Zuehlke et al., 2013). Brettanomyces reproduces asexually by
multilateral budding and Dekkera reproduces sexually by
asci forming one to four hat-shaped or spherical ascospores. The ascospores tend to agglutinate when released (Smith, 2011a).
Growth conditions
B. bruxellensis is a slow growth yeast, nutritionally low
demanding and dependent on specific carbon sources. B. bruxellensis can grow using the
monosaccharides glucose, fructose, galactose and the disaccharides sucrose, maltose, cellobiose and trehalose (Conterno et al., 2006; Smith, 2011a).
B. bruxellensis has an optimal growth temperature range between 25°C and 32°C being able to grow
from 10°C to 37°C. Some authors however, reported a complete loss of viability if some strains were submitted to 36°C for less than 12 hours (Barata et al., 2008b; Brandam et al., 2008; Zuehlke et al., 2013).
The capacity to resist the wine acidic condition (pH≈3.5) is known since B. bruxellensis was detected
in wine, however, a recent study showed that B. bruxellensis could grow at even more acidic
conditions such as pH 1.5 (Bassi et al., 2013; Conterno et al., 2006).
The resistance to ethanol is also a remarkable feature of this yeast. It was shown by Barata et al. (2008a) that, in synthetic media, some strains could grow in conditions of 15.0% (v/v) of ethanol and most of the strain was able to grow under 14.5% (v/v). Although the authors couldn’t grow the strains in a 14% (v/v) ethanol adjusted wine, it was observed growth in real wine with 13.8% (v/v). The authors suggest that, under winery conditions, cells are better adapted to overcome environmental stresses. In previous studies, initial ethanol levels of 13% (v/v) or even 11.4% (v/v) in synthetic media were shown to be enough to limit B. bruxellensis growth (Loureiro and Malfeito-Ferreira, 2006). These
different values can be explained by the combination of various factors, in example, high ethanol and
Figure 1.4 –Morphological differences of
Brettanomyces spp. under optical microscope
9
low pH results in an increased loss of viability of B. bruxellensis when compared to the same
treatments alone (Bassi et al., 2013).
Another important factor for the growth of B. bruxellensis is the concentration of the main preservative
in wines, the sulphur dioxide. The resistance to sulphur dioxide is dependent on its presence in molecular sulphur dioxide since this form is not electrically charged. The sulphur dioxide exists either in free or bound forms and within the free form, a pH equilibrium exists between molecular, bisulfite and sulfite forms (du Toit et al., 2005; Fugelsang and Edwards, 2007; Loureiro and Malfeito-Ferreira, 2006).
Different results regarding the resistance to sulphur dioxide have generated controversy in this topic. Some authors refer that B. bruxellensis is sensible to free sulphur dioxide higher than 30mg/L and
others reported growth under more than 30mg/L (Agnolucci et al., 2010; Barata et al., 2008a). As it was said previously, pH has an important effect on the concentration of molecular sulphur dioxide and this can be the reason for this differences (Barata et al., 2008a; du Toit et al., 2005; Zuehlke et al., 2013). An example of this is a reported loss of viability in white wines due to the efficiency of sulphur dioxide at lower pH environment (Loureiro and Malfeito-Ferreira, 2006).
B. bruxellensis is also affected by DMDC. The concentration of B. bruxellensis in wine affect the
efficiency of DMDC, it was showed that for high cell concentrations (106 cfu/mL) it was needed
300mg/L of DMDC, a higher concentration than the legal limit. For concentrations of 104 cfu/mL, the population was killed with 200mg/L of DMDC, being this the legal limit. Its inhibitory effect is transitory because it decreases over time, causing single addition to be insufficient (Costa et al., 2008; Malfeito-Ferreira, 2010a; Renouf et al., 2008).
B. bruxellensis uses oxygen for ATP production but, if not, it can ferment to produce energy being
considered a facultative anaerobe yeast (Smith, 2011a). In the presence of oxygen, the glucose metabolism rate increases and the fermentation of glucose is also stimulated, contrarily to what happens with S. cerevisiae. This effect is known as Custer’s effect, which is attributed to a temporarily
repression of the alcoholic fermentation under anaerobic conditions (Aguilar Uscanga et al., 2003; Loureiro and Malfeito-Ferreira, 2006; Smith, 2011a; Zuehlke et al., 2013). Recently, it was demonstrated that under anaerobic conditions, nitrate assimilation abolishes the Custer’s effect and, with this and the intrinsic characteristics of B. bruxellensis, this species could become a new
industrially relevant ethanol-producing organism (Galafassi et al., 2013).
Secondary metabolism
The Dekkera/Brettanomyces genus is known to produce high amounts of acetic acid. This was the
10
acetic acid formed being higher under aerobic conditions (Aguilar Uscanga et al., 2003; Fugelsang and Edwards, 2007).
The acetic acid constitutes more than 90% the volatile acidity of a wine, and an increase in acetic acid concentration can detriment wine quality since it gives a vinegar taint to the wine (Oelofse et al., 2008). It is also known that high levels of acetic acid like those produced by B. bruxellensis can be
sufficient to slow or even stuck the wine fermentation showing it is sufficient to inhibit or kill other microorganisms (Fugelsang and Edwards, 2007; Oelofse et al., 2008). The ability to produce acetic acid from B. bruxellensis species depends on many factors as it was said previously and it is common
to see heavily contaminated wines with B. bruxellensis showing normal levels of acetic acid (Loureiro
and Malfeito-Ferreira, 2006).
Other secondary metabolites produced by the Dekkera/Brettanomyces genus are the
tetrahydropyridines. All species of Dekkera/Brettanomyces are capable of producing the
2-acetyltetrahydropyridin (ETHP) and the 2-acetylpyrroline (ATHP). These chemical compounds are responsible for the mousy off-flavor in wines, also known as mousiness. The mousy off-flavor has been described as resembling the smell of mice urine. It produces a very disagreeable taste in mouth and is extraordinarily persistent (may exceed 10 minutes). At wine’s pH, this compounds are not
volatile so only after contact with the saliva this mousiness is perceived (Fugelsang and Edwards, 2007; Malfeito-Ferreira et al., 2009; Snowdon et al., 2006; Suárez et al., 2007).
Another group of secondary metabolites produced by B. bruxellensis are the biogenic amines. They
are produced mainly by decarboxylation of amino acids and if consumed in excessive amounts can cause headache, nausea, diarrhea and red skin coloration just to name a few health problems. The effect of the biogenic amines is even worse in presence of alcohol since it inhibits the diamine oxidase enzyme, responsible for the conversion of these biogenic amines into harmless products. However, the production by the yeast B. bruxellensis has little importance given the small production rate and
the lack of some of the most threatening biogenic amines (Caruso et al., 2002; Fugelsang and Edwards, 2007; Oelofse et al., 2008; Vigentini et al., 2008).
Without underestimating the previous referred secondary metabolites produced by B. bruxellensis,
one of the most serious microbial problems of modern enology worldwide are in fact the volatile phenols. Because of its importance, it will be given an entire chapter on this subject (Chapter 1.4).
Viable but non culturable state
The viable but nonculturable (VBNC) state is characterized by a dormant physiological state where microorganisms fail to grow in culture media when still viable retaining metabolic activity (Fugelsang and Edwards, 2007; Oelofse et al., 2008; Serpaggi et al., 2012; Zuehlke et al., 2013). This state is induced as a response to environmental stress factors like osmotic pressure, temperature, oxygen concentration and others (Agnolucci et al., 2010; Fugelsang and Edwards, 2007; Zuehlke et al., 2013). It is known since late 1900 that bacteria could enter in a VBNC state, however, it was only suggested in the year 2000 that wine yeasts like B. bruxellensis could also enter in this state (Millet and
11
Figure 1.5 –Synthesis of volatile phenols from the
hydroxycinnamic acids.(Oelofse et al., 2008)
VBNC cells of B. bruxellensis display a significant reduction of cell size when compared to the viable
and culturable ones (Agnolucci et al., 2010; Serpaggi et al., 2012; Umiker et al., 2012). This fact can be a mechanism that allows the reduction in energetic consumption of the cells. For B. bruxellensis in wine, it is believed that SO2 is the main trigger to a VBNC state (Agnolucci et al., 2010; Serpaggi et al.,
2012; Umiker et al., 2012; Willenburg and Divol, 2012; Zuehlke et al., 2013). Serpaggi et al. (2012) was the first to demonstrate that eukaryotic cells could exit the nonculturable state when favorable environmental conditions are restored; in this case, B. bruxellensis regain the capacity to grow in
culture media when the stress factor (SO2) was removed.
Recent reports demonstrate that the spoilage metabolism of B. bruxellensis is still active in VBNC
cells. The VBNC cells can produce volatile phenols even though the amounts are roughly half of the produced by normal cells. Therefore, B. bruxellensis in VBNC state can also be harmful for wine
quality since this quantity is sufficient to be detected by the consumer (Agnolucci et al., 2010; Laforgue and Lonvaud-Funel, 2012; Serpaggi et al., 2012). This topic is of extreme importance for the wine industry perspective. VBNC state could lead to false negatives in plate counting when wine is analyzed and consequently the necessary measures to control B. bruxellensis are not done leading to
economic losses. Thus, is of extreme importance better detection methods then plate counting.
1.4 Volatile Phenols
The main reason why VPs are so important is due to their spoilage effects: the “horse sweat” off-flavor and off-taste especially in premium red wines matured in oak barrels (Loureiro and Malfeito-Ferreira, 2006; Malfeito-Ferreira et al., 2009).
The formation pathway
The capacity of B. bruxellensis to
produce volatile phenols was first demonstrated in 1986 (Heresztyn, 1986). The production of VPs is based on a two-step reaction illustrated in Figure 1.5. The precursors hydroxycinnamic acids p-coumaric, ferulic and caffeic are decarboxylated into the hydroxystyrenes 4-vinylphenol (VP), vinylguaiacol (VG) and 4-vinylcathecol (4-VC) respectively by
12
Hydroxycinnamic acids are present in grapes and are extracted to the juice mainly in the maceration process and some may be converted into vinylphenol and ethylphenol derivatives depending on the microbial population (Kheir et al., 2013; Malfeito-Ferreira et al., 2009).
The decarboxylation reaction can be achieved by a large number of bacteria and yeasts, like S. cerevisiae during fermentation. However, the reduction of the vinylphenols derivatives to the
ethylphenols are much rarer (Loureiro and Malfeito-Ferreira, 2006; Malfeito-Ferreira et al., 2009; Oelofse et al., 2008). This reaction has been reported to have no inhibition by substrate excess and no inhibition by product. Plus, conversion rates of 90% have been reported for B. bruxellensis (Kheir et
al., 2013). B. bruxellensis can theoretically benefit from species like S. cerevisiae that can produce
vinyl phenols since B. bruxellensis can produce 4-EP from 4-VP in the absence of the
hydroxycinnamic acids (Dias et al., 2003; Fugelsang and Edwards, 2007).
The conversion of the others hydroxycinnamic acids besides p-coumaric acid has not been much studied. Knowing that caffeic acid exists in wine in higher concentration, a higher concentrations of 4-EC could be expected, however, some published results show the opposite probably because the utilization of caffeic acid is less preferable then p-coumaric acid (Malfeito-Ferreira et al., 2009).
It is still not known when a higher production rate of 4-EP is observed during the growth of
Brettanomyces. Some authors say the production is higher in stationary phase, others report a higher
production rate in exponential phase and others showed that the production occurred roughly between the two previous phases (Conterno et al., 2013; Dias et al., 2003; Kheir et al., 2013). Recently, it was reported that the production of ethyl phenol was higher in a richer ethanol environment. Ethanol increased lag phase duration and limited the cell growth but not the metabolic efficiency to produce ethyl phenols (Conterno et al., 2013).
Presence in wines and quality depreciation
Wine spoilage by microorganisms is not easy to define. Microbial metabolites, especially in fermented foods and beverages play an important role in the taste and aroma and their pleasantness or displeasure is very subjective. The spoilage is so dependent of cultural reasons, habits and opinion makers that become hard to define it. One great example of this is the presence of volatile phenols in red wines due to the presence of B. bruxellensis. Some consumers and opinion makers prefer wine
with some level of volatile phenols stating it gives a distinctive aged character to young red wines. Others consider, even at low concentrations, that it makes wine unpleasant due to diminished flavor complexity. Also, the mixture of different aromas are experienced differently than the aromas alone which makes it even harder (Fugelsang and Edwards, 2007; Kheir et al., 2013; Loureiro and Malfeito-Ferreira, 2006; Malfeito-Malfeito-Ferreira, 2010b).
Wines affected by Dekkera/Brettanomyces have various sensory descriptors like “spicy”, “smoky”, “leather”, “cedar”, “medicinal”, “animal”, “wet dog”, “barnyard”, or one of the most known “horse sweat”
13
The detection/preference threshold can measure the spoilage effect with sensorial activity. This threshold is defined as the minimum concentration under which 50% of the tasters, in a 70-person jury, detect/reject the sample. As said before, the matrix in which the aroma is inserted plays an important role in the detection. An example of this, in Bordeaux red wines, the preference threshold for 4-EP is around 620 µg/L, however, when 4-EG is present in a concentration of one tenth of the 4-EP (normal rate in wines by not always observed), the detection/preference threshold decreases to 426 µg/L. If the concentrations of these compounds are inferior to this threshold, volatile phenols can increase the complexity of wine aroma. Above this threshold, the ethyl phenols dominate the aroma and affect the mouthfeel with metallic notes. Wines, in this case, are normally rejected by the majority of the consumers but still remain pleasant for others due to the reasons previously said (Fugelsang and Edwards, 2007; Kheir et al., 2013; Loureiro and Malfeito-Ferreira, 2006; Malfeito-Ferreira et al., 2009). This thematic is so subject that other authors, Licker et al.(1998), described thresholds that far exceed the above mentioned: a “high Brett” wine contains 3000 µg/L of 4-EP, a medium one 1700
µg/L and a “no Brett” wine 690 µg/L.
It is not easy to estimate the real incidence of volatile phenols contamination in wines, however, Loureiro and Malfeito-Ferreira (2003), estimated that more than 25% of the red wines have concentrations of ethyl phenols higher than the detection/preference threshold of 620 µg/L. More recently, based in data from analytical laboratories, the incidence of volatile phenols in a concentration superior to 690 µg/L show a range from 6% to 74% depending on the year and locations of the wines (Loureiro and Malfeito-Ferreira, 2006). However, these values are overestimated because winemakers normally send to analyzes samples suspected to have problems (Malfeito-Ferreira et al., 2009). The detection/preference threshold of the other volatile phenol, the 4-EC, is around 50 µg/L. Moreover, the hydroxycinnamic acid precursor, the caffeic acid, is present in relatively high concentrations. Knowing that 4-EC is described as having a phenolic smell similar to that of 4-EP, the differences in sensorial detection and the quantification of 4-EP and 4-EG analyzed by Gas Chromatography (GC) may be explained by the hidden presence of 4-EC (Loureiro and Malfeito-Ferreira, 2006; Malfeito-Ferreira et al., 2009).
Non-Brettanomyces species and volatile phenols
Besides Brettanomyces many wine related microorganisms like Oenococcus oeni, several Lactobacillus species, S. cerevisiae, Pichia guilliermondii, and several Candida species can produce
vinyl phenols from the hydroxycinnamic acids (Fugelsang and Edwards, 2007; Kheir et al., 2013; Loureiro and Malfeito-Ferreira, 2006). However, like it was said before, few can reduce the vinyl phenols to produce ethyl phenols. Those who can in fact produce ethyl phenols effectively are B. bruxellensis and B. anomala, Pichiaguilliermondii and some species from the genus Candida. Still, B. bruxellensis poses the main threat to wine quality since Candida species are more associated with soy
sauces. P. guilliermondii, apparently, can’t produce 4-EP in wines with normal conditions (12% (v/v)
alcohol and 3.5 pH) since they lose viability after 24h and B. anomala is less common (Barata et al.,
14
Detection by gas chromatographyGas chromatography (GC) has been used by wineries or external laboratories for detection and quantification of spoilage activity of Brettanomyces namely, the chemical compound 4-ethylphenol.
GS is a chromatography method for detection of volatile compounds. The method enables a separation of the compounds present in a sample since some compounds elute faster than the other giving different retention times for each compound. The intensity measured by each compound is proportional to its concentration. With this said, the GC method can detect and quantify volatile phenols of a sample after phenols extraction from wine.
As far as we know, Brettanomyces is the only microorganism growing in wines that produces high
concentrations of 4-EP. Therefore, GC analyses of a wine can act as an indicator to its presence or previous presence. However, many authors reported that ethyl phenols synthesis is strain dependent and population dependent which precludes a direct comparison with cell concentration (Barata et al., 2013; Dias et al., 2003; Fugelsang and Edwards, 2007; Fugelsang and Zoecklein, 2003; Loureiro and Malfeito-Ferreira, 2006; Sangorrín et al., 2013).
The detection of volatile phenols has faster results than plate counts but it is usual to see wine with high levels of volatile phenols and no growth in culture media. These results can be explained by the VBNC state or viability loss of Brettanomyces after production of EPs. On the other hand, low levels of
EPs with positive results in plate counting indicate a serious threat for wine quality demanding fast action (Laforgue and Lonvaud-Funel, 2012; Loureiro and Malfeito-Ferreira, 2006; Serpaggi et al., 2012).
The major drawback of this method is that it is not a good preventive detection method since when it is detected the presence of ethyl phenols it may be too late to do something about the spoiled wine.
1.5 Detection and Quantification
The detection and quantification of B. bruxellensis in wine is extremely important due to the spoilage
activity of this yeast and the consequently economic losses for the wine industry. The detection of this yeast should be fast, so the enologists can act fast and prevent high spoilage, accurate with a low detection limit, to know how to treat the contaminated wine and not too expensive so the cost to analyze the samples be cost effective.
The most common and suitable method of detection and quantification of B. bruxellensis is the plate
counting. However, the burden of the costs of equipment needed for a simple plate counting, the limitation of advanced instruments for other techniques and the requirement of skilled labor in small/medium wine enterprises made wineries ask for external laboratories help (Fugelsang and Edwards, 2007; Loureiro and Malfeito-Ferreira, 2006).
It is known how difficult it is the isolation in plate media of Brettanomyces from the environment,
15
Culture mediaA culture media is a liquid (normally named broth) or solid mixture of components to able microorganisms to multiply. A successful cultivation of microorganisms requires the medium to have all nutritional demands of the desired group of microorganisms. There are also some selective agents that select a growth of a specific group of microorganisms in detriment of others resulting in a selective media. This is the most common technique to identify microorganisms in food industry (Loureiro and Malfeito-Ferreira, 2006).
Commonly, media for yeasts maintenance are based on glucose, peptone and yeast extract with some differences in concentration and pH. Some authors suggest that vitamins such as thiamine and biotine are beneficial to the growth of Brettanomyces although some authors disagree (Loureiro and
Malfeito-Ferreira, 2006; Oelofse et al., 2008).
Another general culture medium used for yeasts is WL. This media also called WLN (WL-Nutritional) is used for determination of total viable yeast population (Fugelsang and Edwards, 2007). This media contains a pH indicator, bromocresol green, which changes media color when acidification of media is observed.
The culture medias above mentioned are not selective for Brettanomyces spp.. For the selective
growth of B. bruxellensis present in wine, one of the more commonly used selective agent is
cycloheximide (Actidione®). This antibiotic inhibits protein biosynthesis in many eukaryotes including
Saccharomyces, the most common yeast of the alcoholic fermentation in wine. B. bruxellensis on the
contrary, can resistant to the concentrations commonly used (10-100 mg/L). When B. bruxellensis is
the predominant yeast in the wine, a non-selective media added of cycloheximide is efficient enough. It is now usual to see in many research articles the use of a Differential medium (WLD) or WL-Cycloheximide (WLC). This is due to the addition of cycloheximide in the WL culture media to select
Brettanomyces against Saccharomyces. Unfortunately, some other wine spoilage yeasts including Hanseniaspora uvarum, Pichia guilliermondii and Schizosaccharomyces pombe, when present, can
also grow in 50 mg/L of cycloheximide (Fugelsang and Edwards, 2007; Loureiro and Malfeito-Ferreira, 2006; Morneau et al., 2011; Oelofse et al., 2008; Zuehlke et al., 2013).
Rodrigues et al. (2001) presented the Dekkera/Brettanomyces Differential Medium (DBDM). This
medium uses 6% (v/v) ethanol as a two way selective agent. First, to reject species that can’t support
growth with 6% ethanol concentrations and second, to select species that can grow with ethanol as sole carbon source. This media also contains 6.7 g/L of yeast nitrogen base (YNB), the pH indicator bromocresol green, 10 mg/L of cycloheximide for the purpose above mentioned and 100 mg/L of p-coumaric acid. The latter compound, as above mentioned, is the precursor of the 4-EP which leads to a distinct phenolic off-odor if Brettanomyces spp. grow in this media. Pichia guilliermondii is,
theoretical, the single false positive in this medium since it can grow in DBDM, produce acetic acid and produce 4-EP in sufficient rate to identify the off-odor (Loureiro and Malfeito-Ferreira, 2006; Oelofse et al., 2008; Rodrigues et al., 2001; Zuehlke et al., 2013). However, this media has a major limitation since it was demonstrated that not all strains of B. bruxellensis can use ethanol as sole
carbon source. Some authors reported low frequencies (26-39%) of B. bruxellensis strains that could
16
this, Morneau et al. (2011) measured colonies size in WL with increasing concentrations of cycloheximide and DBDM. The results showed that some strains couldn’t grow or grew poorly on DBDM. However, when Brettanomyces was inoculated in DBDM with a small volume of wine, the
strains grew better. The author proposes 2 reasons for these observations: an inability of those strains to quickly metabolize ethanol as a sole carbon source or a lack of an unidentified nutrient. It is also important to refer that, given the stressful conditions of this media and the slow growing ability of
Brettanomyces, an incubation time of two weeks or more is needed. This result takes too much time
which can lead to the spoilage of the wine even before it is known that is contaminated (Fugelsang and Edwards, 2007; Loureiro and Malfeito-Ferreira, 2006; Oelofse et al., 2008).
Renouf et al. (2007) developed an enrichment media named EBB medium. This media contained 200 mL/L of grape juice, 4% ethanol, malt extract, yeast extract, ammonium and magnesium sulfate and tween 80. With this media, after 10 days of enrichment, either no B. bruxellensis was detected or it
largely outnumbered the other yeasts present in the sample.
Although plating on selective media is the normal and most common technique used in food industry, this method is yet insufficient for detection and quantification of B. bruxellensis in the winemaking
process where a period of a week is crucial. Given this, the lack of an effective culture media to rapid presume the presence of Brettanomyces spp. makes place for a large and needy market for new low
cost products due to its recurring need.
Molecular methods
Given the B. bruxellensis slow growth in selective culture media, a rapid and reliable identification of
this spoilage yeasts demands modern techniques and molecular approaches have shown its potential. Stender et al. (2001) used fluorescence microscopy for detection and quantification of Brettanomyces
spp. in wine. This method is based in a known technique called fluorescence in situ hybridization (FISH) known since 1982 (Langer-Safer et al., 1982). This technique uses oligonucleotide probes fluorescently marked to hybridize to a sequence of interest in situ. It is then possible to see in
whole-cell preparations under a fluorescent microscope the target whole-cells appearing as bright fluorescent colors depending on the fluorescent dyes. After Stender et al., Dias et al. (2003), used the same method but directly in pellets of centrifuged wine. This method is a high sensitivity way to specifically detect and quantify the presence of B. bruxellensis with detection limit depending on the volume of centrifuged
samples. If not centrifuged, the microscopic-based technique is only suitable when contamination is high (around 104 cells/mL).
Other molecular techniques that are fast, sensitive and accurate normally involves polymerase chain reaction (PCR). This technique, developed in 1983 by Kary Mullis (Mullis, 1990), is now one of the most used methods in molecular biology laboratories. As it is commonly known, PCR involves 3 steps: denaturation of DNA helix, annealing of the primers and elongation of the complementary sequence. The product of these thermal cycles is an immense amplification of the target sequence. Based on PCR, several methods for detection and/or quantification of Brettanomyces spp. have been reported.
The first PCR-based method used to detect Brettanomyces spp. was reported by Ibeas et al. (1996).
17
culture being used directly in wine. The nested-PCR is used normally to prevent unspecific binding of the primers using in this case a second set of primers to amplify a region within the first one (Ibeas et al., 1996; Loureiro and Malfeito-Ferreira, 2006; Oelofse et al., 2008).
After the year 1996, a lot of studies used PCR-based methods for the identification of Brettanomyces
spp. In 1999, a random amplification of polymorphic DNA (RAPD-PCR) (Mitrakul et al., 1999) and a restriction fragment length polymorphisms (RFLP-PCR) (Esteve-Zarzoso et al., 1999) were reported. After this date, many PCR-based methods were reported to identify Brettanomyces spp. using the
specific 5.8S ribosomal genes and their flanking internal transcribed spacer (ITS1 and 2) (Egli and Henick-Kling, 2001; Loureiro and Malfeito-Ferreira, 2006; Oelofse et al., 2008; Suárez et al., 2007; Zuehlke et al., 2013). However, these studies relied on fresh colonies and so the isolation problem of culture media above mentioned remained. Cocolin et al. (2004), compared the PCR-based techniques like restriction endonuclease PCR (RE-PCR), denaturing gradient gel electrophoresis (DGGE) and a dot blot RNA against the classical method of plate counting. The main fault reported by the authors and also commonly attributed to other direct methods is the high detection limit of 104 cfu/mL. At this concentration of Brettanomyces spp. wine can already be spoiled. However, some of these techniques
can be rendered more sensitive if wine is centrifuged first (Loureiro and Malfeito-Ferreira, 2006; Oelofse et al., 2008).
In the Ibeas et al. (1996) report, it was also used a dot blot hybridization for simple present or not present Brettanomyces spp. analyzes. In Cocolin et al. (2004) work above mentioned, the dot blot
RNA test was also a present or not present analyzes in wine samples, however, a detection limit of around 104 cfu/mL was shown from serial dilutions. This year, Cecchini et al. (2013) reported a dot blot method which allows the detection of B. bruxellensis in wine samples without amplification steps
or enrichments with a 10 cells/mL detection limit. These results show a promising tool for winemakers hence it gives quick results with a great sensitivity.
In 2007, the use of a recent method called loop-mediated isothermal amplification (LAMP) to detect and quantify Brettanomyces spp. was reported by Hayashi et al. (2007). This method, developed by
Notomi et al. (2000), relies on an enzyme with strand displacement activity under isothermal conditions. It uses four to six primers recognizing six to eight regions of the target DNA sequence. The auto-cycling reaction lead to accumulation of a large amount of the target DNA and other reaction by-products, such as magnesium pyrophosphate (a white precipitate), allowing a rapid detection by spectrophotometry (Hayashi et al., 2007; Njiru, 2012; Notomi et al., 2000). Hayashi et al. (2007) reported a detection limit of 10 cfu/mL in a 60 minutes method showing the usefulness of this method for quality control in wineries.
Real-Time PCR
18
SYBR green, dye molecules attached to the reaction primers or probes that hybridize with PCR product during amplification. Since the PCR is based on an exponential increase of amplicons, the exponential phase of the reaction can yield information on the initial amount of the target: if the target sequence is abundant, the amplification starts in earlier cycles; if the sequence is in low concentration, amplification takes place in later cycles.
This method was first used to quantify Brettanomyces spp. by Phister and Mills (2003). The authors
reported a 3 hours test with a detection limit of 10 cells/mL of wine. After this, in the following year, Delaherche et al. (2004) reported another RT-PCR method but the detection limit was 104 cells/mL
instead. The reason of this difference is because the latter author used a different protocol, probably because the previous work was not known yet since there was no reference to it in this article. In 2007, a personal communication by the same authors referred that a change of the DNA extraction method improved the detection limit to the same 10 cfu/mL of Phister and Mills work (Loureiro and Malfeito-Ferreira, 2006; Oelofse et al., 2008; Zuehlke et al., 2013).
Tessonnière et al. (2009) tested six different protocols of DNA extraction and isolation from wine and three PCR reaction compositions to select the best method. The selected method allowed a detection limit of 31 cfu/mL.
Willenburg and Divol (2012) compared the efficiencies of DNA and mRNA as template and concluded that mRNA was a better template. One of the reasons was that DNA can remain intact for more time than mRNA and this cause an overestimation of cell numbers due to dead cells. The authors also showed that cells in VBNC state induced by SO2 addition were detected by RT-PCR and not by plate
counting which is of great importance due to reason previously mentioned. The detection limit was around 10 cells/mL of wine. The other article published in the past year was from Tofalo et al. (2012). In this work, the authors have also compared plate counting analyzes with RT-PCR and they also found some wine samples with negative results in plate counting but positive in RT-PCR probably due to the VBNC state of B. bruxellensis. The authors also tested different commercial kits for DNA
extraction since it is one of the most critical steps in no-culture PCR-based applications and found out that DNAPowerSoil® Isolation Kit (MO BIO Laboratories) gave the best results and was fast and simples to use. A detection limit of 10 cells/mL was also achieved.
Portugal and Ruiz-Larrea (2013) also reported a comparison of RT-PCR with conventional plate counting method. From 324 wine samples, there were 31.8% that gave positive results in RT-PCR and negative in plate count and only 7.7% that gave positive in plate count and negative in RT-PCR. The false negative results were probably due to low yeast populations of <100 cfu/mL. These low concentrations could be lost in DNA extraction or washing stages. The group of 31.8% false negative in plate count was explained by the authors as nonviable Brettanomyces cells and DNA that still
19
1.6 Objectives
Despite the threat B. bruxellensis poses to the wine industry, there are much to learn about this yeast
and much to do in order to help wineries decreasing the incidence of the phenolic odor in their wines with faster and efficient detection. The production of 4-ethylphenol is not yet fully understood and disagreements about in which growth phase, the production rate is higher and if cells without active growth are able to produce this compound, still exists. DBDM shows to be highly selective but has the disadvantage of large incubation times and using ethanol as sole carbon source. Real-time PCR seem promising for specific and rapid detection but it is expensive for the most wineries. To better understand the behavior of this yeast and find new solutions to wineries, we established the following objectives:
To study the difference in viability and culturability as well as evaluate the 4-ethylphenol production in the absence of actively growing populations.
To develop a new selective medium with a rapid, labor free and efficient detection.
To make a Real-Time PCR protocol with lower costs for the detection of B. bruxellensis in our