monitored by flow cytometry while culturable populations were followed by plating on culture medium. Twenty-four hours after the application of the stress, the comparison between the culturable population and the viable population demonstrated the presence of viable cells that were non culturable. In addition, removal of the stress by increasing the pH
of the medium at different time intervals into the VBNC state allowed the VBNCS. cerevisiaecells to ‘‘resuscitate’’. The
similarity between the cell cycle profiles of VBNC cells and cells exiting the VBNC state together with the generation rate of cells exiting VBNC state demonstrated the absence of cellular multiplication during the exit from the VBNC state. This provides evidence of a true VBNC state. To get further insight into the molecular mechanism pertaining to the VBNC state,
we studied the involvement of theSSU1gene, encoding a sulfite pump inS. cerevisiae. The physiological behavior of
wild-typeS. cerevisiaewas compared to those of a recombinant strain overexpressingSSU1and nullDssu1mutant. Our results
demonstrated that theSSU1gene is only implicated in the first stages of sulfite resistance but not per se in the VBNC
phenotype. Our study clearly demonstrated the existence of an SO2-induced VBNC state inS. cerevisiaeand that the stress
removal allows the ‘‘resuscitation’’ of VBNC cells during the VBNC state.
Citation:Salma M, Rousseaux S, Sequeira-Le Grand A, Divol B, Alexandre H (2013) Characterization of the Viable but Nonculturable (VBNC) State in
Saccharomyces cerevisiae. PLoS ONE 8(10): e77600. doi:10.1371/journal.pone.0077600 Editor:Valerie de Cre´cy-Lagard, University of Florida, United States of America
ReceivedJuly 3, 2013;AcceptedSeptember 11, 2013;PublishedOctober 29, 2013
Copyright:ß2013 Salma et al. This is an open-access article distributed under the terms of the Creative Commons Attribution License, which permits unrestricted use, distribution, and reproduction in any medium, provided the original author and source are credited.
Funding:This research was funded by the French Minister of Research. The funders had no role in study design, data collection and analysis, decision to publish, or preparation of the manuscript.
Competing Interests:The authors have declared that no competing interests exist.
* E-mail: [email protected]
Introduction
Microorganisms, like all living organisms, naturally respond to changing environmental conditions. They display a remarkable ability to adapt to certain physical and chemical stresses in their environment. Survival mechanisms are activated following the detection of environmental signals and generate a complex adaptive response that leads to a state of tolerance and thus survival under sub-optimal or even sub-lethal conditions [1]. When the environmental conditions threaten their survival or prevent them from living in optimal conditions, the cells are described as stressed [2]. This notion of stress plays a fundamental role in the survival of microorganisms in foodstuff. Giraffa et al. [3] argued that the ability of microorganisms to grow, survive and display a metabolic activity in foodstuffs is the result of stress response.
However, between the unstressed state and death, different physiological states have been described: viable and culturable, injured, dormant, viable but non culturable (VBNC) and dead [4]. These physiological adaptations require a variable response time depending on the intensity and abruptness of exposure to the stress-inducing factor(s). The VBNC state, which has been extensively studied in bacteria, is characterized by an inability of
the cells to grow on culture media, even though they are still viable and maintain a detectable metabolic activity [5]. This state is reversible upon return of favorable conditions. Various environ-mental factors can induce entry into VBNC state: temperature [6,7], the physiological age of the culture, salinity [8], the oxygen content [9], light and ventilation [10]. Most studies on VBNC cells have focused on pathogenic bacteria. More than 60 bacterial species are described as being able to enter into a VBNC state, Gram-positive (e.g. Listeria monocytogenes, Enterococcus, Micrococcus luteus) and Gram negative(e.g. Escherichia coli, Vibrio cholerae, Vibrio vulnificus, Legionella pneumophila, Campylobacter jejuni, Salmonella enterica, Pseudomonas aeruginosa, Helicobacter pylorii) [11]. In contrast, the VBNC state has received much less attention in other microor-ganisms.
wines, suggested the presence of cells in a VBNC state inCandida stellata [16]. Sulfur dioxide (SO2) has been identified as the
chemical stress factor inducing VBNC state in Brettanomyces bruxellensisgrown in a wine synthetic medium [17–19]. The same observations were made forS. cerevisiaeandZygosaccharomyces bailii [20]. In order to sustain the hypothesis that the VBNC state is a physiological survival mechanism, it ultimately requires demon-strating the recovery of the culturable state from a VBNC population cells after removal of the stress factor [11,21]. This resuscitation process is often triggered simply by removal of the stress that initially induced the VBNC response [11,18]. There has also been numerous reports of resuscitation induced by other mechanisms such as nutrient addition [22], temperature upshift [23] and heat shock [24]. However, most of these resuscitation processes were successful only with cultures which had been in the VBNC state for only a short period of time [17,21,25]. In the case of wine yeasts that entered into a VBNC state as a response to SO2
exposure, various authors have shown that a substantial decrease in molecular SO2concentration induced resuscitation [17,19,20].
A number of methods have been employed to examine the viability of non culturable cells in order to suit different needs. The viability of bacteria can indeed be assessed in populations (bulk assay) or in single cells (cytological assay) [4,25]. The latter appear to be preferred since it is based on growth-independent viability techniques such as the assessment of cell viability by the maintenance of stable cellular structure. These methods include the use of nucleic acid stains, redox indicators, membrane potential probes or metabolic indicators such as fluorescein diacetate that can be detected by fluorescence microscopy [19,20] or flow cytometry [17].
In this study, we evaluated the effect of SO2on the entry ofS. cerevisiaecells into the VBNC state, the resuscitation capability of VBNC S. cerevisiae cells using a flow cytometry and trying to demonstrate that the recovery of culturability is due to a true resuscitation and not to the presence and growth of a few residual cells with a normal metabolism. Finally, we investigated the role of SSU1in the VBNC state.
Materials and Methods
Strains, Plasmids and Culture Conditions
The different bacteria, yeast strains and plasmid used in this study are listed in Table 1.
Plasmids were constructed and amplified in Escherichia coli DH5a, grown in Luria Bertani (LB) medium (Biolab diagnostics, Wadenville, South Africa). The medium was supplemented with 100 mg/L ampicillin for the selection of resistant bacteria when
appropriate.S. cerevisiae (S288C, BYD4742 and BYD4742Dssu1) strains were grown in Yeast Peptone Dextrose (YPD) (10 g/L yeast extract, 10 g/L Bacto-peptone, 20 g/L glucose) at 28uC. For the selection of yeast transformants, Synthetic Complete (SC) medium containing 20 g/L glucose, 6.7 g/L yeast nitrogen base with ammonium sulfate and amino acids (Difco Scientific group, Waterfall Park, South Africa) supplemented with 60mg/mL leucine and 30mg/mL lysine to apply a uracil auxotroph.
DNA Preparation and Analysis
Chromosomal DNA from S. cerevisiae BYD4742 strain was isolated from overnight culture grown in YPD at 30uC [26]. The SSU1 gene was amplified by polymerase chain reaction (PCR) using the 59ScSSU1fw (GGATCCATGGTTGCCAATTGGG-TACTT) and 39ScSSU1rev (CTCGAGTTATGCTAAACGCG-TAAAATCTAGAG) primers in an Applied Biosystems 2720 thermal cycler. Phusion DNA polymerase enzyme (Finnzymes, Finland) and Phusion buffer (Finnzymes, Thermo Scientific, Pretoria, South Africa) with MgCl2 were used. The reaction
mixture contained Phusion DNA polymerase enzyme (1 U), Phusion buffer (1X), 250mM of each nucleotide (dNTP), 200 ng genomic DNA, 0.25mM of each primer, and 0.2 mM MgCl2. The
PCR program is consisted of a 30 s initial denaturation cycle at 98uC (initial denaturation), followed by 35 cycles of 98uC for 10 s (denaturation), 58uC for 45 s (annealing), 72uC for 50 s (elonga-tion). The program ended with a final 10 min extension at 72uC (final elongation).
The amplicons obtained were cloned into a pJET1.2 using the CloneJet PCR Cloning Kit (Thermo Scientific) according to the manufacturer’s instructions. Plasmid DNA was isolated from positive transformants of E. coli DH5a using the Qiaprep Spin Miniprep Kit (Qiagen, Whitehead Scientific, Cape Town, South Africa). Both strands were sequenced in an ABI 3130XL Genetic Analyzer at the Central Analytical Facility (Stellenbosch Univer-sity) using the pJET1.2 Forward and Reverse sequencing primers.
Constructing Overexpression Vectors
The SSU1 gene was then subcloned into the pCEL13 yeast expression vector [27] (Table 1) as follows:SSU1was excised from pJET1.2 restriction with BamHI and XhoI (Roche Diagnostics, Randburg, South Africa) and ligated into theBglII andXhoI sites of the pCEL13 expression vector respectively to yield a plasmid named pCEL13-SSU1. Restriction endonuclease-digested DNA was eluted from agarose gels by using the ZymocleanTM gel recovery kit (Zymo research, USA) according to the manufactur-er’s instructions. Standard methods were used for the restriction
Table 1.Yeast strains used in this study.
Strains and plasmid Genotype/Description Reference
S. cerevisiaeS288C MATaSUC2 gal2 mal mel flo1 flo8-1Dhap1
S. cerevisiaeBYD4742 S288C derivative,MATahis3D1 leu2D0 lys2D0 ura3D0 [46]
S. cerevisiaeBYD4742Dssu1 BYD4742 derivative,MATahis3D1 leu2D0 lys2D0 ura3D0 ssu1::KanMX4
EUROSCARF deletion library*
Escherichia coliDH5a [F2w80lacZDM15D(lacZYAargF) U169 deoR recA1 endA1 hsdR17(rk2, mk+) phoA supE44 thi-1gyrA96 relA1l]
GIBCO-Invitrogen Life technologies, Mowbray, South Africa
pCEL13 2mm ApRURA3 PGK1
P–PGK1T [27]
pCEL13-SSU1 2mm ApRURA3 PGK1
P-SSU1-PGK1T This study
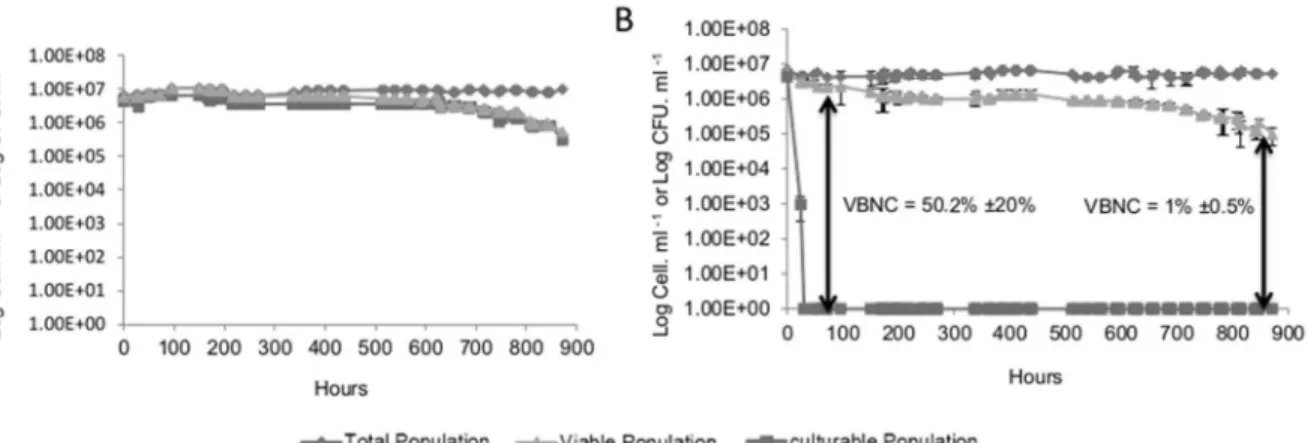
Figure 1. Changes in the total cell population (¤) culturable population (&), and viable population (m) of a culture ofS. cerevisiae
S288C on incubation at 28uC.Panel A shows the growth control condition in synthetic wine. Panel B shows the induction of VBNC state inS.
cerevisiaeS288C in synthetic wine with the addition of 4.5 mg/L molecular SO2at time 0. Value 1 corresponds to an undetectable number (less to 10 CFU/mL).The values presented are the average of three replicates of three separate experiments.
doi:10.1371/journal.pone.0077600.g001
Figure 2. Resuscitation ofS. cerevisiaeS288C from the VBNC state.Total cell counts (¤), culturable counts (&), and viable counts (m) are
shown. Resuscitation was induced by removal of the molecular SO2at different time intervals after entry into VBNC state (i.e. A: 3 days, B: 7 days, C: 14 days; D: 21 days; E: 30 days). Value 1 corresponds to an undetectable number (less to 10 CFU/mL). The values presented are the average of three replicates of three separate experiments.
Figure 3. FCM histograms ofS. cerevisiaeS288C cells stained with FDA.The cells were incubated with 25 mg/L natamycin in Synthetic wine at 28uC. After 30 (B); 60(C); 120(D) and 150(E) min, the cells were collected, and the cell Green fluorescence intensity was analyzed by FCM, Panel A represents control cells in the absence of SO2(0 min). The Green fluorescence intensity (GRN-HLog) is represented on the x-axis, and cell counts are represented on the y-axis. Panels show the fluorescence ofS. cerevisiaeS288C before (red arrow; self-fluorescence) and after (blue arrow) staining with FDA. One representative experiment of the three performed is shown.
doi:10.1371/journal.pone.0077600.g003
Figure 4. FCM analysis ofS. cerevisiae S288C cells stained with FUN-1.Green fluorescence intensity is shown on the x-axes and red
fluorescence intensity is shown on the y-axes. Dot plot (A) shows the fluorescence of dead cells after staining with FUN-1. Dot plot (B) shows the fluorescence of viable and culturable cells after staining with FUN-1. Dot plot (C) shows the fluorescence of VBNC cells after staining with FUN-1. Red-negative cells are contained in quadrants 3 and 4; Red-positive cells are contained in quadrants 1 and 2. Green- positive cells are contained in quadrants 2 and 3; Green-negative cells are contained in quadrants 1 and 4. Red fluorescence was measured at 630 nm (emission) and Green at 525 nm (emission). One representative experiment of the three performed is shown.
and ligation of DNA, plasmid transformation into E. coli, and agarose-gel electrophoresis [28].
Yeast Transformation
S. cerevisiae, strain BYD4742Dssu1 was transformed with pCEL13-SSU1. Yeast transformation was conducted using an electroporation method as previously described [29]. The plasmids were maintained as autonomously replicating plasmids in the yeast cells by growing yeast cells cultured in uracil deficient media. Transformation was verified by colony PCR analysis using the
59
KPNPGK-631(GGGGTACCCTTTATTTTGGCTT-CACCC) and 39PGKKPN-1378
(CGCGGGGGTACCGA-TAAATAATAGTCTATATATACG) primers. The reaction was performed in 50ml using 16Taq buffer (Promega Corp., USA),
250mM of each nucleotide dNTPs, 1.5 mM MgCl2, and 1 unit of TaqDNA polymerase (Promega Corp., USA) with the following cycling conditions: 10 min initial denaturation cycle at 98uC (initial denaturation), followed by 30 cycles of 98uC for 10 s (denaturation), 58uC for 30 s (annealing), 72uC for 50 s
(elonga-tion). The program ended with a final 10 min extension at 72uC (final elongation). PCR products were resolved on 1% agarose gel prepared with 16TBE buffer and 1mM of ethidium bromide and visualized under UV-light; the relative molecular length of the PCR product was estimate to be about 2 Kpb in order to validate the yeast transformation (results not shown).
Adaptation of Different Strains to the Synthetic Wine Medium
S. cerevisiae S228C, BYD4742 and BYD4742Dssu1strains were grown on YPD, S. cerevisiae BYD4742Dssu1pCEL13-SSU1 was grown on SC at 28uC, for 5 days as starter inocula.
For S. cerevisiae S228C,VBNC studies were performed in synthetic wine (SW) (8% ethanol, 3 g/L D-L malic acid, 0.01% acetic acid, 0.1 g/L potassium sulfate, 0.025 g/L magnesium sulfate, 1 g/L yeast extract, 1.5 g/L glucose, 1.5 g/L fructose). VBNC studies for S. cerevisiae BYD4742, BYD4742Dssu1 and BYD4742Dssu1 pCEL13-SSU1 was performed in modified synthetic wine (MSW) (8% ethanol, 3 g/L D-L malic acid,
Figure 5. FCM analysis and cell cycle distribution ofS. cerevisiaeS288C.Analysis ofS. cerevisiaeS288C cell cycle during exponential phase in
synthetic wine (Panel A), before (Panel B) and after exiting (Panel C) the VBNC state analyzed by FCM. The profiles Showed dual-variable plots of cell number versus PI uptake. G1 (green), S (brown), and G2/M (blue) cell populations were quantified. The experiment was repeated at least three times and representative data from single experiment is presented.
doi:10.1371/journal.pone.0077600.g005
Figure 6. Growth of S. cerevisiae S288C in synthetic wine at 28uC. Error bars indicate the standard deviations of three independent
0.01% acetic acid, 0.1 g/L potassium sulfate, 0.025 g/L magne-sium sulfate, 1.5 g/L glucose, 1.5 g/L fructose, 6.7 g/L yeast nitrogen base with ammonium sulfate and amino acids supple-mented with 60mg/mL leucine and 30mg/mL lysine) supple-mented with 50mg/mL uracil for the culture of S. cerevisiae BYD4742, BYD4742Dssu1strains.
The pH was adjusted to 3.5, using 2 M NaOH and the medium was filter-sterilized using 0.2mm filters (Millipore, Molsheim, France). One single colony was inoculated into 10 mL of SW-YPD (50:50) (S. cerevisiae S228C) or in 10 mL of MSW-SC (50:50) (S. cerevisiaeBYD4742, BYD4742Dssu1, and BYD4742Dssu1pCEL13 SSU1) and incubated at 28uC for 3 days. 5.105cell/mL from this preculture were inoculated into 1 L SW or MSW, depending on the strain, and incubated at 28uC for 3 days in order to obtain approximately 107cell/mL.
Culturability and Viability Assays
Samples ofS. cerevisiaesuspensions were taken at various time points during incubation at 28uC in SW or MSW, for the determination of total, viable and culturable populations. Cell culturability was assessed by a spread plating procedure on YPD agar or SC agar depending on the strain. The percentage of cells that were viable was expressed as total cell counts determined by flow cytometry (FCM). Two fluorescent dyes, namely fluorescein diacetate (FDA) and FUN-1, were used to evaluate the viability of S. cerevisiaeusing FCM. FDA is a lipophilic, uncharged and non-fluorescent substrate for cellular esterase that cleaves FDA inside living cells to release green fluorescent fluorescein (emission at 520 nm). FDA is therefore used to monitor cellular esterase
activity and to determine the viability of cell populations. For the staining procedure, 0.5 mL of cultured cells was added to 0.5 mL of FDA buffer ((0.5 M Na2HPO4(Sigma 255793, France; pH 7.4)
and 0.5 M NaH2PO4(Sigma S2554, France); pH 7)) to which
1.5mL of FDA at 10mM in acetone (Sigma F737, USA) was added in order to reach a final concentration of 15mM, and the cells were then incubated for 15 min at room temperature in the dark before being analyzed by FCM.
Furthermore, another viability probe (FUN-1) (Invitrogen F-7030) was used in order to validate the presence of the metabolic activity in the non culturable cells. FUN-1 [2 chloro 4 (2,3 dihydro 3 methyl (benzo 1,3 thiazol-2-yl) methylidene) 1 phenylquinoli-nium iodide] is a fluorescent probe that belongs to a class of halogenated asymmetric cyanine dyes and is essentially non-fluorescent in aqueous solution. FUN-1 stains nucleic acids, producing a green to green-yellow fluorescence in membrane compromised dead yeast cells [30]. In metabolically active yeast, cylindrical intravacuolar structures (CIVS) are produced after less than 1 h exposure to FUN-1 [30]. This stain gives rise to the formation of CIVS structures in the vacuoles of metabolically active yeast cells grown and stained under either oxidative or fermentative conditions [30]. These structures often appear to move within a vacuolar space and are red when excited at 470– 590 nm. To stain cells with FUN-1 different suspensions of live, dead, and non culturable yeast cells were analyzed.Saccharomyces cerevisiaeS288C cells were washed in sterile PBS (130 mM NaCl (Sigma-Aldrich #S9888, St Quentin Fallavier, France) 5 mM NaH2PO4(Sigma-Aldrich#S2554) and 5 mM Na2HPO4
(Sigma-Aldrich #255793) pH 7.2) and a portion was killed using Natamycin (yeast cells treated with Natamycin (Delvocid)
Figure 7. Exit rate ofS. cerevisiaeS288C from the VBNC.Total cell counts (¤), culturable counts (&), and viable counts (m) are shown.
Resuscitation was induced by removal of the molecular SO2at 21 days after entry into VBNC state. Value 1 corresponds to an undetectable number (less to 10 CFU/mL). The values presented are the average of three replicates of three separate experiments.
(Humeau, France), for 60 min at 28uC). The absence of viability was confirmed by absence of growth on YPD agar media and by FCM analysis using FUN-1. Live, dead and non culturable yeasts were stained separately using FUN-1, 1 mL of each S. cerevisiae suspension was washed twice with PG solution (PBS pH 7.2 containing 2% glucose). A centrifugation at 10000 g for 5 min was performed and the pellet was resuspended in PG solution (this solution ensures that yeasts remain metabolically active during the experiment). The cells were then incubated with FUN-1 at a final concentration of 15mM for 30 min at 28uC. Cells were analyzed
by FCM. A dot plot of Red fluorescence (y-axis) over Green fluorescence (x-axis) was prepared.
Flow Cytometry Analysis
FCM samples were analyzed using a Guava EasyCyte Plus SSC4C flow cytometer (Guava Technologies, Hayward). This instrument is equipped with a 488-nm, 25-mW laser line, forward scatter (FSC, for cell size) and side scatter (SSC, for granularity) detectors; green fluorescence was collected on the FL 1 channel using a 525-nm (630 nm) band-pass filter red fluorescence was collected on the FL 3 channel using a 680-nm (630 nm) band-pass filter. This instrument allows determining accurate cell numbers and population percentages, without the need for reference beads, as described by the manufacturer using only the Guava Cytosoft data acquisition and analysis software. For all analyses, a minimum of 5,000 events was acquired, and all samples were collected as logarithmic signal. Experiments were performed in duplicate and included an unlabeled sample as a control in 96-well plates. Data were analyzed using the Guava Cytosoft data acquisition and analysis software version 5.0 and FlowJo software version 7.6.
Induction of Entry into and Exit from the VBNC State Based on studies that have been carried out previously [17,20], SO2was used to induce the VBNC state. In wine, different species
of SO2are in a pH-dependent equilibrium: HSO32, SO322and
molecular SO2.The latter is the main antimicrobial species of SO2
[31]. When pH decreases, the concentration of molecular SO2
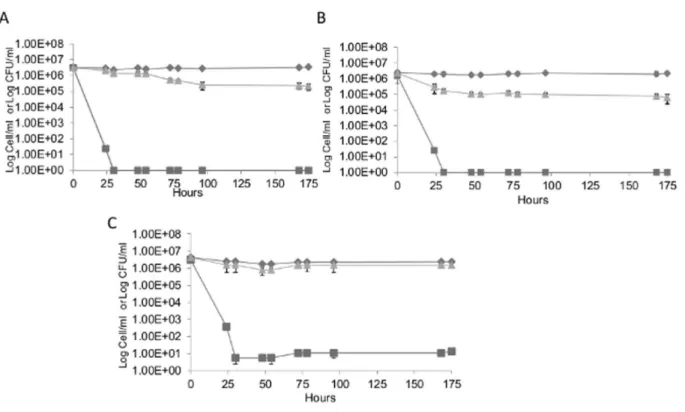
Figure 8. The induction of the VBNC state inS. cerevisiaeBDY4742 (Panel A), BDY4742Dssu1(Panel B) and BDY4742Dssu1pCEL13
SSU1(Panel C) strain in synthetic wine with the addition of 4.5 mg.L21molecular SO
2.Total cell counts (¤), culturable counts (&), and viable counts (m).Value 1 corresponds to an undetectable number (less to 10 CFU/mL). The values presented are the average of three replicates of three separate experiments.
doi:10.1371/journal.pone.0077600.g008
Figure 9. Viability percentage of S. cerevisiae BYD4742 (¤),
BYD4742Dssu1(&) and BYD4742Dssu1pCEL13SSU1(m) strain
during the induction of the VBNC state.Viability percentage is
determined by FCM using FDA. Error bars indicate the standard deviation of three independent experiments.
increases as does the antimicrobial strength for a given total SO2
concentration [31].
Entry into the VBNC state was induced by adding different concentrations of molecular SO2(ranging between 0.1 mg/L and
4.5 mg/L). Desired molecular SO2 concentration was obtained
using potassium metabisulfite solution. The level of potassium metabisulfite to be added was determined as reported previously [32] taking into account, the pH of the medium and the pKa of SO2. Exit from the VBNC state was induced at different time
intervals after addition of SO2(i.e. 3, 7, 14, 21, and 30 days) by
adjusting the pH to 4.0 via the addition of 2 M NaOH. A pH of 4.0 was indeed found sufficient to bring the concentration of molecular SO2close to 0. All of our studies of entry into and exit
from the VBNC state were performed in triplicate. The percentage of viable cells was calculated as follows: % viabili-ty = (viable cell count/total cell count)6100.
FDA Reliability Assay
A synthetic wine was inoculated withS. cerevisiaeS288C strain to a final concentration of 5.105CFU/mL and incubated for 3 days at 28uC to obtain approximately 107CFU/mL. Thereafter, different lethal stresses such as Natamycin (25 mg/L) and SO2
(10 g/L) were applied. Every 5 min 1 mL of cells was centrifuged (13,000 g for 5 min at 25uC), the pellet was rinsed twice in PBS and cell culturability was assessed by a spread plating procedure on YPD media. Green fluorescent intensity was determined by flow cytometry using FDA.
VBNC Cell Cycle Analysis
A comparison of the cell cycle profiles of cells in VBNC state and cells exiting the VBNC state was carried out in order to show the absence of cell proliferation during the exit from the VBNC state using FCM and propidium iodide (PI), a red fluorescent probe (635 nm emission) that binds to the nucleic acid [33,34]. 1 mL of cell suspension ofS. cerevisiaeS288C from exponentially growing culture in SW (control), VBNC and culturable cells exiting from the VBNC state were centrifuged for 5 min at 10,000 g, the pellet was suspended in 1 mL cold 70% ethanol and the tubes were stored for 3 hours at 4uC. Cells were suspended in 1 mL 50 mM citrate buffer pH 7 (Sigma-Aldrich#S4641) after 5 min centrifugation at 10,000 g. A second centrifugation for 5 minutes at 10,000 g was performed and the cells were suspended in 1 mL 50 mM citrate buffer pH 7 containing 0.25 mg/mL RNase A (Sigma-Aldrich #R4875), to ensure DNA-specific binding as PI can stain both double-stranded RNA and DNA [35]. Incubation for 1 h at 50uC was then carried out. In order to stain cells with PI, the tubes were centrifuged again for 5 min at 10,000 g and the pellet was resuspended in citrate buffer pH 7 containing 8mg/mL PI (Sigma-Aldrich #81845) and stored at 4uC for 3 days. All analyses were carried out in triplicate at a concentration of 106 cell/mL. PI is detected in the 575/26 nm channels on the BD LSRII which is equipped with a 488-nm, 22-mW laser line, forward scatter (FSC) and side scatter (SSC) detectors. Initial cell population gating is placed on FSC vs SSC (cell size vs granularity). This cell population gate was then placed on PE 575/26 nm-W(width) vs PE 575/26 nm-A(Area) plot. Doublets appear to the right of single cell analysis (gate P2). Single cell gate P2 was then displayed as a histogram using PE 575/ 26 nm-A parameter. For all analyses, a minimum of 10,000 events was acquired, and all samples were collected as linear signal. Cell Cycle analysis of research samples was adequately done using the FlowJo software.
VBNC Exit Rate Assay
A comparison of the cell generation time and exit rate of the VBNC cells was carried out in order to further verify the absence of cell proliferation during the exit from the VBNC state. A filtered SW pH 4.0 obtained from a culture ofS. cerevisiaeS288C (14 days, in synthetic wine containing 8% ethanol) was inoculated with the same strain to a final concentration of 104CFU/mL. This culture
was used to determine the generation time (doubling time of the biomass in the exponential phase) ofS. cerevisiaeS288C, under the same experimental conditions, during the exit from the VBNC state. To determine the generation time (G), the optical density at 600 nm as well as plate counting on YPD agar were determined every 2 h and compared to the exit rate of the VBNC state which was determined after the removal of the SO2stress as described
above. The generation time and the exit rate were calculated according to the following formula: G = ln(2)/m(max) wih ln(N2)-ln(N1) =m(max) (t2-t1), (N2 is cell number at t2 and N1 is the cell number at t1).
Results and Discussion
Evidence for a VBNC State inS. cerevisiae(Induction and Exit)
SO2 was used as a stress factor in an attempt to induce the
VBNC state inS. cerevisiae. FCM counts of total or viable cells using FDA and culturable cell counts were compared in order to monitor the entry ofS. cerevisiaeS288C cells into the VBNC state. In the absence of SO2, more than 95% of total cells remained
viable and cultivable during the first three days (Fig. 1A). Entry into the VBNC state was assayed by incubation of the cells with different concentrations of molecular SO2, ranging from 0.1 to
4.5 mg/L. When 4.5 mg/L of molecular SO2were added 3 days
after synthetic wine was inoculated (Time 0), the viability and the culturability of cells decreased rapidly and all viable cells became non culturable after 48 h (Fig. 1B). When applying lower concentrations of SO2, some viable cells always remained
culturable (data not shown). In the first 3 days following the addition of SO2, a decrease of viability from 4.26106 to
2.26106cells/mL was observed and could be explained by the
fact that some cells are more sensitive to SO2than others. In the
third day (72 h) following the sulfite stress, no more colonies were detected on YPD medium. The difference between the percentage of culturable cells and viable cells suggests that a significant proportion of cells were in a VBNC state (Fig. 1B). For strain S288C, 52%620% (2.26106cells/mL)in average of the total population was in VBNC state after 3 days and 1%60,5% (4.26104cells/mL) remained in a VBNC state 36 days after stress
exposure while the rest of the population died.
The ability of cells to exit from the VBNC state was investigated at different days (3, 7, 14, 21 and 29 days or 72 h, 168 h, 336 h, 504 h, 696 h respectively) (Fig. 2) by increasing the pH from 3.5 to 4.0 in order to decrease the molecular SO2concentration [17]. In
order to rule out the effect of pH on VBNC state, the effect of rising the pH on yeast growth dynamic has been checked (Fig. S1). It appears that pH increase did not lead to VBNC cells. One day after the pH-induced drop of the molecular SO2concentration,
in VBNC cells is a good reflection of metabolic activity and not a residual esterase activity, the green fluorescence intensity was measured in dead cells obtained using 2 lethal chemicals such as the exposure to natamycin (25 mg/L) or SO2 (10 g/L). Our
results show that after 150 min of treatment with natamycin (25 mg/L) (Fig. 3) or 45 min of treatment with SO2(10 g/L) (Fig.
S2) no cells presented a green fluorescence. This indicates that the green fluorescence reflects a true metabolic activity and not a residual esterase activity. This validates that cells that are considered in VBNC state after being exposed to SO2stress and
still detectable by FCM (for a longer period of time more than 24 h after the loss of their culturability) are metabolically active in a VBNC state (Fig. 2).
The analysis by FCM using FUN-1 of viable, dead and non cultrable (Viable and culturable cells treated with 4.5 mg/mL of SO2) cells ofS. cerevisiaeS288C was performed. The Green and the
Red-labeled populations were spatially resolved in dot plots of FL1 and FL3. Analysis by FCM of the dead cells (treated with natamycin) stained by FUN-1 shows that more than 97.87% of cells diffused a green to green-yellow fluorescence indicating that the membrane was compromised as provided in a dead yeast cells (Fig. 4A). Analysis of viable (obtained 3 days after sulphite stress in synthetic wine) and culturable cells by FCM after staining by FUN-1 reveals the presence of a red fluoresence in 95.2% of the total population which indicates the formation of CIVS structures in the vacuoles of the metabolically active yeast cells (Fig. 4B).
33.2%66% of the non culturable cells analyzed by FCM using FUN-1 displayed a red fluorescence (Fig. 4C). The presence of a red fluorecence in non culturable cells (33.2%66%) showed that these cells present a CIVS structure that allows us to validate that a significant population within the non culturable cells present a metabolic activity.
VBNC State Validation
Proving the existence of the VBNC phenomenon as a physiological survival mechanism ultimately requires demonstrat-ing the possible recovery of the culturable state from a non culturable population [11,21]. Indeed, VBNC state can only be a significant means of survival if the cells surviving in this state are able to again recover their ability to multiply. In order to show that the recovery of culturability observed after the removal of the molecular SO2 stress (Fig. 2), is a true resuscitation and not a
growth of a few residual viable and culturable cells with normal metabolism, a comparison of the profile of cell cycle in VBNC state just before and immediately after pH adjustment was performed using FCM. In addition, in order to determine the relative cellular DNA content, FCM was used to identify the cell distribution among the various phases of the cell cycle. The analysis of an exponentially growing population of S. cerevisiae S288C in synthetic wine medium using FCM with the DNA
both physiological states and exhibited similar profiles with an absence of a cell proliferation during resuscitation (Fig. 5A and B). Since the cell cycle profile is the same before and after exit from VBNC, this means that no cell multiplication occurred in the synthetic wine. This result together with the fact that after pH rising cells are culturable again (Fig. 2) demonstrated that these cells are able to again recover their ability to multiply.
The generation time of S. cerevisiaeS288C was determined by inoculating the S288C strain under the same experimental conditions during the exit from the VBNC state and was found to be approximately 10 h (Fig. 6). As, the culturability assay used in our study (100mL on YPD agar) had a detection limit equivalent to 10 CFU/mL, consequently, during the resuscitation process, at least 56.9 h would have been required to reach a concentration of 5.196102CFU/mL after the increasing of the
pH, if the observed increase in culturability had been due to the presence of culturable cells. Yet our results show that 5.196102CFU/mL of culturable cells were observed only 7 h
after the pH increase (Fig. 7). According to the generation time calculated above, no viable and culturable cells would be able to grow up to 5.196102CFU/mL in such a short period of time (7 h)
(Fig. 7).
These results therefore validate the hypothesis of the VBNC state which is based on the fact that cells are able to regain their ability to multiply. This resuscitation has been strongly debated [21,38,39], as some authors suggest that the recovery of culturability is due to the presence and sudden growth of a few residual cells with a normal metabolism in a population predominantly non culturable. However, the recovery of cell division in a population of VBNC cells was described unambig-uously for several bacteria [40,41]. Cell resuscitation has been clearly demonstrated in vitro, in vivo and in situ [11]. In this study, the removal of environmental stress was sufficient to induce the exit from the VBNC state and the recovery in culturability observed was evidenced as a true resuscitation and not a simple growth of a few residual cells with a normal metabolism.
Role of the Ssu1p Pump in the VBNC State
SO2resistance mechanisms have been extensively studied inS. cerevisiae. SO2 detoxification, involving the plasma membrane
protein Ssu1p, is one of the most efficient resistance mechanisms in this species [42]. Yeasts also tolerate SO2 by means of other
systems, such as acetaldehyde production and the up-regulation of sulfite reduction systems [43]. The sulfite pump required for efficient sulfite efflux is encoded by the SSU1 gene. Generally, mutations in SSU1 cause sensitivity, whereas overexpression confers enhanced resistance to sulfite toxicity [44,45].
were compared. The study was carried out in a modified synthetic wine medium containing 4.5 mg/L of molecular SO2. Total and
viable cell counts determined by flow cytometry and CFU counts (on SC agar) were compared in order to monitor the difference in the VBNC profile of the three strains. In the absence of SO2, more
than 95% of total cells remain viable and cultivable during the first three days (data not shown). Entry into the VBNC state was induced by the addition of SO2(4.5 mg/L molecular SO2) 3 days
after synthetic wine inoculation (Time 0). The total population remained stable over time for all strains and culturability decreases quickly 30 h after SO2 addition to undetectable levels only for
BYD4742 and BYD4742Dssu1 (Fig. 8 A and B). However, for BYD4742Dssu1 pCEL13-SSU1, some cells were still found culturable (5.5 cell/mL) even after 30 h of treatment (Fig. 8 C).
Moreover, the cell viability of BYD4742Dssu1decreased rapidly after the addition of SO2, to less than 10% 30 h after the
treatment, whereas the viability of BYD4742 and BYD4742Dssu1 pCEL13-SSU1strains decreased more slowly in the first few hours following the treatment (i.e. 60% of viability 30 h after treatment). This difference in the response to SO2exposure between the
wild-type, BYD4742Dssu1pCEL13-SSU1and BYD4742Dssu1allows to validate the role of SSU1 in sulfite resistance mechanisms, as previously reported [42] and can be explained by the fact that the SSU1null mutant accumulated significantly more sulfite than the other strains (wild-type and BYD4742Dssu1pCEL13-SSU1), which makeSSU1null mutant strain more sensitive to SO2.
However, after 78 h, viability was no more significantly different and identical viability percentages (8%) were observed between the wild-type and BYD4742Dssu1(Fig. 8 A and B, Fig. 9) whereas 61% of BYD4742Dssu1 pCEL13-SSU1 cells remained viable. This could be explained by the fact that upon sudden exposure to a very high concentration of SO2such as that required
for entry into the VBNC state, the wild-type strain, unlike BYD4742Dssu1 pCEL13-SSU1, does not have enough sulfite pumps in its membrane to efflux enough SO2 and detoxify the
intracellular matrix. The overexpression ofSSU1in aSSU1null mutant using the pCEL13 vector conferred enhanced resistance to sulfite toxicity as previously described [44,45] ruling out the need for entry into a VBNC state (i.e. more than 99% of viable cells are non culturable). This result allows us to conclude that theSSU1 gene is involved in sulfite resistance but not in the VBNC phenotype ofSaccharomyces cerevisiae.
Conclusion
S. cerevisiae S288C strain was used to generate conclusive evidence for the existence of a VBNC state in yeast, using a sulfite stress (4.5 mg/L molecular SO2). For this purpose, cell count
results obtained by FCM were compared to those obtained by plating on culture medium.
The addition of SO2to a culture ofS. cerevisiaeinduced entry
into a VBNC state with a significant decrease of the metabolic activity. According to literature, the removal of the stressor factor can induce the exit from the VBNC state. In this study, the removal of molecular SO2was performed by increasing the pH of
the medium. Under these conditions, the ability of the cells to recover culturability after the stress removal was observed.
The green fluorescence detected by FCM using FDA reflected a true metabolic activity which indicates that cells that are considered in VBNC state after being exposed to SO2stress and
still detectable by FCM are metabolically active in a VBNC state (Fig. 2). This was further validated by the observation of CIVS structures, detected by FUN-1 probe. As the formation of these structures is strongly dependent on ATP, this further demonstrated the presence of metabolic activity.
We report that yeast cells can survive in a VBNC state in synthetic wine for up to one month. It is likely thatSaccharomyces yeast cells could even stay longer in this state. The specific molecular mechanism involved in the entry into and exit from the VBNC state remains to be unraveled. A transcriptomic approach of VBNC cells would be useful to assess the existence of such a mechanism. From a practical point of view, this result demon-strates that the use of sulfite for stabilizing different beverages should be assessed using other methods than plating methods.
Supporting Information
Figure S1 Effect of the increasing pH on the growth dynamic of a culture ofS. cerevisiaeS288C. Total cell counts (¤), culturable counts (&), and viable counts (m) are shown. pH increased at 3 days (72 h). The values presented are the average of three replicates of three separate experiments.
(TIFF)
Figure S2 FCM histograms ofS. cerevisiae S288C cells stained with FDA. The cells were incubated with 10 g/L SO2in Synthetic
wine at 28uC. After 15 (B); 30(C); 45(D) and 60(E) min, the cells were collected, and the cell Green fluorescence intensity was analyzed by FCM, Panel A represents control cells in the absence of SO2(0 min). The Green fluorescence intensity (GRN-HLog) is
represented on the x-axis, and cell counts are represented on the y-axis. Panels show the fluorescence ofS. cerevisiaeS288C before (red arrow; self-fluorescence) and after (blue arrow) staining with FDA. One representative experiment of the three performed is shown. (TIFF)
Author Contributions
Conceived and designed the experiments: MS HA SR BD. Performed the experiments: MS. Analyzed the data: MS SR HA ASL BD. Contributed reagents/materials/analysis tools: MS SR HA ASL BD. Wrote the paper: MS SR HA ASL BD.
References
1. Helmann JD (2002) The extracytoplasmic function (ECF) sigma factors. Adv Microb Physiol 46: 47–110.
2. Yeast Stress Responses (n.d.). Available: http://www.springer.com/ life+sciences/microbiology/book/978-3-540-43926-4. Accessed 16 May 2013. 3. Giraffa G (2004) Studying the dynamics of microbial populations during food
fermentation. FEMS Microbiol Rev 28: 251–260.
4. Kell DB, Kaprelyants AS, Weichart DH, Harwood CR, Barer MR (1998) Viability and activity in readily culturable bacteria: a review and discussion of the practical issues. Antonie Van Leeuwenhoek 73: 169–187.
5. Yamamoto H (2000) Viable but nonculturable state as a general phenomenon of non-spore-forming bacteria, and its modeling. J Infect Chemother 6: 112–114. 6. Xu H-S, Roberts N, Singleton FL, Attwell RW, Grimes DJ, et al. (1982) Survival and viability of nonculturableEscherichia coliandVibrio choleraein the estuarine and marine environment. Microb Ecol 8: 313–323. doi:10.1007/BF02010671.
7. Oliver JD, Hite F, McDougald D, Andon NL, Simpson LM (1995) Entry into, and resuscitation from, the viable but nonculturable state byVibrio vulnificusin an estuarine environment. Appl Environ Microbiol 61: 2624–2630.
8. Roth WG, Leckie MP, Dietzler DN (1988) Restoration of colony-forming activity in osmotically stressedEscherichia coliby betaine. Appl Environ Microbiol 54: 3142–3146.
9. Gauthier MJ (2000) Environmental Parameters Associated with the Viable but Nonculturable State. In: Colwell RR, Grimes DJ, editors. Nonculturable Microorganisms in the Environment. Springer US. 87–112. Accessed 16 May 2013.
10. Rollins DM, Colwell RR (1986) Viable but nonculturable stage ofCampylobacter jejuniand its role in survival in the natural aquatic environment. Appl Environ Microbiol 52: 531–538.
18. Du Toit WJ, Pretorius IS, Lonvaud-Funel A (2005) The effect of sulphur dioxide and oxygen on the viability and culturability of a strain ofAcetobacter pasteurianus
and a strain ofBrettanomyces bruxellensisisolated from wine. J Appl Microbiol 98: 862–871.
19. Agnolucci M, Rea F, Sbrana C, Cristani C, Fracassetti D, et al. (2010) Sulphur dioxide affects culturability and volatile phenol production byBrettanomyces/
Dekkera bruxellensis. Int J Food Microbiol 143: 76–80.
20. Divol B, Lonvaud-Funel A (2005) Evidence for viable but nonculturable yeasts in
botrytis-affected wine. J Appl Microbiol 99: 85–93.
21. Bogosian G, Bourneuf EV (2001) A matter of bacterial life and death. EMBO Rep 2: 770–774.
22. Roszak DB, Grimes DJ, Colwell RR (1984) Viable but nonrecoverable stage of
Salmonella enteritidisin aquatic systems. Can J Microbiol 30: 334–338. 23. Nilsson L, Oliver JD, Kjelleberg S (1991) Resuscitation ofVibrio vulnificusfrom
the viable but nonculturable state. J Bacteriol 173: 5054–5059.
24. Ravel J, Knight IT, Monahan CE, Hill RT, Colwell RR (1995) Temperature-induced recovery ofVibrio choleraefrom the viable but nonculturable state: growth or resuscitation? Microbiol Read Engl 141 (Pt 2): 377–383.
25. McDougald D, Rice SA, Weichart D, Kjelleberg S (1998) Nonculturability: adaptation or debilitation? FEMS Microbiol Ecol 25: 1–9.
26. Ausubel FM (1999) Short protocols in molecular biology: a compendium of methods from Current protocols in molecular biology. 4th ed. New York: Wiley. 1 p.
27. Gundllapalli SB, Otero RRC, Pretorius IS (2006) Development of a screening method for the indentification of a novelSaccharomyces cerevisiaemutant over-expressingTrichoderma reeseicellobiohydrolase II. Ann Microbiol 56: 143–150. 28. Sambrook J, Fritsch EF, Maniatis T (1989) Molecular Cloning: A Laboratory
Manual. Cold Spring Harbor Laboratory. book p.
stationary phase inSaccharomyces cerevisiae. Aging Cell 8: 36–44.
37. Schimz K-L (1980) The effect of sulfite on the yeastSaccharomyces cerevisiae. Arch Microbiol 125: 89–95.
38. Bogosian G, Morris PJL, O’Neil JP (1998) A Mixed Culture Recovery Method Indicates thatEnteric BacteriaDo Not Enter the Viable but Nonculturable State. Appl Environ Microbiol 64: 1736–1742.
39. Nystro¨m T (2003) Nonculturable bacteria: programmed survival forms or cells at death’s door? BioEssays News Rev Mol Cell Dev Biol 25: 204–211. 40. Dhiaf A, Bakhrouf A, Witzel K-P (2008) Resuscitation of eleven-year VBNC
Citrobacter. J Water Health 6: 565–568. doi:10.2166/wh.2008.131.
41. Zhong L, Chen J, Zhang X, Jiang Y (2009) Entry ofVibrio cincinnatiensisinto viable but nonculturable state and its resuscitation. Lett Appl Microbiol 48: 247– 252.
42. Park H, Hwang Y-S (2008) Genome-wide transcriptional responses to sulfite in
Saccharomyces cerevisiae. J Microbiol Seoul Korea 46: 542–548. doi:10.1007/ s12275-008-0053-y.
43. Casalone E, Colella CM, Daly S, Gallori E, Moriani L, et al. (1992) Mechanism of resistance to sulphite inSaccharomyces cerevisiae. Curr Genet 22: 435–440. 44. Avram D, Bakalinsky AT (1997) SSU1 encodes a plasma membrane protein
with a central role in a network of proteins conferring sulfite tolerance in
Saccharomyces cerevisiae. J Bacteriol 179: 5971–5974.
45. Park H, Bakalinsky AT (2000) SSU1 mediates sulphite efflux inSaccharomyces cerevisiae. Yeast Chichester Engl 16: 881–888.