Maria Camila de Avelino Geraldo Dias
Bachelor of Science in Biomedical EngineeringPrediction of uncertainty events using
human-computer interaction
Dissertation submitted in partial fulfillment of the requirements for the degree of
Master of Science in Biomedical Engineering
Adviser: Prof. Doctor Hugo Gamboa, Auxiliar Professor, NOVA University of Lisbon
Co-adviser: Prof. Doctor Marcus Cheetham, Senior Research
Associate, Department of Internal Medicine, University Hospital of Zurich
Examination Committee
Chairperson: Prof.a Dr.aCarla Maria Quintão Pereira Raporteur: Prof.a Dr.aCláudia Regina Pereira Quaresma
Prediction of uncertainty events using human-computer interaction
Copyright © Maria Camila de Avelino Geraldo Dias, Faculty of Sciences and Technology, NOVA University Lisbon.
The Faculty of Sciences and Technology and the NOVA University Lisbon have the right, perpetual and without geographical boundaries, to file and publish this dissertation through printed copies reproduced on paper or on digital form, or by any other means known or that may be invented, and to disseminate through scientific repositories and admit its copying and distribution for non-commercial, educational or research purposes, as long as credit is given to the author and editor.
This document was created using the (pdf)LATEX processor, based in the “novathesis” template[1], developed at the Dep. Informática of FCT-NOVA [2].
A c k n o w l e d g e m e n t s
I want to thank all the people that stood beside me during these memorable years of study, fun, love and personal and professional growing. I feel very lucky and proud of the choice I made five years ago. Particularly, I want to thank who supported me in the development of this dissertation.
Firstly, I want to thank Professor Hugo Gamboa for giving me the opportunity of developing this really fascinating project, which aroused new interests in me.
I am thankful to Professor Marcus Cheetham as well, who gave several interesting and important ideas and whose psychological knowledge was crucial for the understanding of some concepts. I would also like to thank the Department of Internal Medicine, University Hospital of Zurich, for providing the data.
I am extremely grateful to Cátia Cepeda, who was always available to help me, and to discuss new ideas and results. Without her, I would not have learned as much as I did during this thesis development. Thanks to everyone from Biomedical Engineering Laboratory of LIBPhys (Laboratory for Instrumentation, Biomedical Engineering and Radiation Physics) for welcoming me there.
To all of my great friends, a big thank you. With you, these five years of work were much easier and full of companionship and amusement! To Miguel, for always being there for me.
A b s t r a c t
The practice of medicine is characterized by complex situations that evoke uncertainty. Uncertainty has implications for the quality and costs of health care, thus emphasizing the importance of identifying its the main causes.
Uncertainty can be manifested through human behaviour. Accordingly, in this dis-sertation, a machine learning model that detects events of uncertainty based on mouse cursor movements was created. To do so, 79 participants answered an online survey while the mouse data was being tracked. This data was used to extract meaningful features that allowed model testing and training after a feature selection stage. With the implementa-tion of a Logistic Regression, and applying a k-fold cross-validaimplementa-tion method, the model achieved an estimated performance of 81%.
It was found that, during moments of uncertainty, the number of horizontal direction inversions increases and the mouse cursor travels higher distances. Moreover, items that evoke uncertainty are associated to longer interaction times and a higher number of visits.
Subsequently, the model was applied to a medical decision making task performed by 8 physicians, in order to understand whether it might be applied in different contexts
or not. The results were consistent with the task design.
To better understand the nature of uncertainty, its relationship with personality was explored. Regarding the clinical task, it was found a slight tendency of uncertainty to increase with Neuroticism.
In the future, the created model may be used to help physicians understand their main difficulties.
R e s u m o
A área de medicina envolve situações complexas que despertam incerteza. As complica-ções nos cuidados de saúde associados à incerteza e que se refletem na qualidade e custos dos mesmos despertam a necessidade de identificar as suas principais causas.
A incerteza pode manifestar-se através do comportamento humano. Consequente-mente, no decorrer desta tese, foi criado um modelo de aprendizagem automática que deteta eventos de incerteza com base em informação extraída a partir de movimentos do cursor do rato. Para tal, 79 participantes responderam a um questionárioonline, durante o qual foram adquiridos os dados do cursor. Estes foram utilizados com o objetivo de ex-trair características significativas que, após passarem por um processo de seleção, foram utilizadas para testar e treinar o modelo. Seguidamente, com a implementação de uma regressão logística e aplicando um método de validação cruzada, o modelo alcançou um valor estimado de desempenho de 81%.
Foi possível concluir que, durante momentos de incerteza, o número de inversões de sentido no eixo horizontal aumenta e o cursor do rato percorre distâncias superiores à média. Ademais, existe uma tendência para visitar repetidamente, bem como permanecer maiores intervalos de tempo, em elementos do texto que incitam incerteza.
Posteriormente, o modelo foi aplicado a uma tarefa de tomada de decisão médica executada por 8 médicos, com o objetivo de analisar se o modelo é adequado a diferentes contextos. Os resultados obtidos foram satisfatórios.
De forma a compreender a incerteza no seu todo, foi explorada a sua relação com a personalidade. Relativamente à tarefa de tomada de decisão médica, foi verificado um ligeiro aumento da incerteza com o aumento do Neuroticismo.
No futuro, o modelo criado poderá vir a ser utilizado por médicos interessados em depreender as suas maiores dificuldades.
C o n t e n t s
List of Figures xv
List of Tables xvii
Acronyms xix
1 Introduction 1
1.1 Motivation . . . 1
1.2 Objectives . . . 2
1.3 Thesis Overview . . . 3
2 Theoretical Concepts 5 2.1 Human-Computer Interaction . . . 5
2.1.1 Eye Tracking . . . 6
2.1.2 Mouse Tracking . . . 7
2.2 Machine Learning . . . 8
2.3 Decision Making . . . 9
2.3.1 Indecisiveness . . . 9
2.4 Personality . . . 10
2.4.1 Five Factor Model . . . 10
3 State of the Art 13 3.1 Eye and Mouse Movements . . . 13
3.1.1 Eye Tracking Data Correction . . . 13
3.1.2 Eye and Mouse Movements Comparison . . . 13
3.2 Decision Making . . . 14
3.2.1 Indecisiveness . . . 14
3.2.2 Survey Response Difficulty . . . . 14
3.2.3 Medical Decision Making . . . 16
4 Experimental Procedure 17 4.1 Eye and Mouse Movements Comparison . . . 17
4.1.1 Experiment Description . . . 17
C O N T E N T S
4.1.3 Participants . . . 18
4.2 Uncertainty Model . . . 19
4.2.1 Experiment Description . . . 19
4.2.2 Data Acquisition . . . 19
4.2.3 Participants . . . 20
4.3 Application of the Model to a Clinical Context . . . 20
4.3.1 Experiment Description . . . 20
4.3.2 Participants . . . 20
5 Methods 23 5.1 Eye and Mouse Movements Comparison . . . 23
5.1.1 Technological Materials . . . 23
5.1.2 Eye Tracking Data Correction . . . 23
5.1.3 Comparative Measures . . . 25
5.1.4 Exploring and Non-exploring Conditions . . . 28
5.2 Uncertainty Model . . . 28
5.2.1 Technological Materials . . . 28
5.2.2 Data Pre-processing . . . 28
5.2.3 Features Extraction . . . 29
5.2.4 Features Selection . . . 33
5.2.5 Training and Testing . . . 33
5.2.6 Classification . . . 33
5.2.7 Model Performance Evaluation . . . 34
5.2.8 Relation between Uncertainty and Personality . . . 35
5.2.9 Application of the Model to a Clinical Context . . . 36
6 Results and Discussion 37 6.1 Eye and Mouse Movements Comparison . . . 37
6.1.1 Population Description . . . 37
6.1.2 Eye Tracking Lost Data . . . 37
6.1.3 Data Visualization . . . 38
6.1.4 Comparative Measures . . . 39
6.1.5 Exploring and Non-exploring Conditions . . . 40
6.2 Uncertainty Model . . . 41
6.2.1 Population Description . . . 41
6.2.2 Lost Data . . . 42
6.2.3 Features Extraction . . . 42
6.2.4 Training and Testing Sets . . . 45
6.2.5 Features Selection and Relevance . . . 46
6.2.6 Model Performance Evaluation . . . 48
6.2.7 Uncertainty Statistical Analysis . . . 48
C O N T E N T S
6.2.8 Relation between Uncertainty and Personality . . . 48
6.3 Application to a Clinical Context . . . 50
6.3.1 Population Description . . . 50
6.3.2 Lost Data . . . 51
6.3.3 Uncertainty Statistical Analysis . . . 51
6.3.4 Comparison between Cases Complexity and Model Outcomes . . 52
6.3.5 Relation between Uncertainty and Personality . . . 53
7 Conclusions 55 7.1 General Results . . . 55
7.2 Future Work . . . 56
Bibliography 57
L i s t o f F i g u r e s
2.1 Schematic of a vertebrate eye. . . 6
2.2 Corneal reflection position changes according to the gaze point. . . 7
2.3 Optical mouse operation. . . 8
4.1 Decks’ disposition on adapted IGT. . . 18
4.2 Data acquisition architecture. . . 19
5.1 Eye gaze and mouse positions before and after the calibration process. . . 24
5.2 Representation of the central square where the decks are on IGT. . . 25
5.3 Eye tracking data correction . . . 26
5.4 Features extracted. . . 32
5.5 Uncertainty model construction. . . 34
6.1 Mean percentage of eye tracking lost data. . . 38
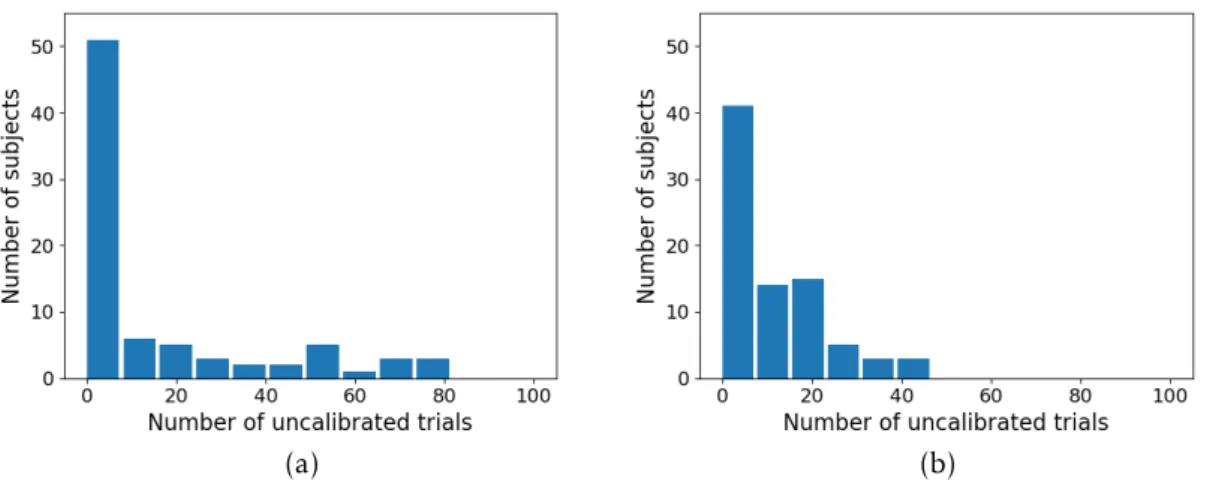
6.2 Discarded trials due to non-calibration of eye tracking data. . . 38
6.3 Eye gaze and mouse cursor movements. . . 39
6.4 Eye and mouse alterations per trial of a certain participant. . . 40
6.5 Violin plot with the the NEO-FFI results. . . 42
6.6 Temporal evolution of the first ten questions’ response from the survey of a certain participant. . . 43
6.7 Instance of low and highvelocity. . . 43
6.8 Instance of high and low straightness, short and longdistance travelled and distance from answer. . . 44
6.9 An example of a revisit. . . 44
6.10 Two corrections, a correction between and a correction within item. . . 44
6.11 An example of a <-turn. . . 45
6.12 Question associated to uncertainty. . . 46
6.13 Question associated to certainty. . . 46
6.14 Percentage of questions associated to uncertainty. . . 49
6.15 Mouse movements of a questionnaire from the person with the minimum and the person with the maximum percentage of uncertainty items. . . 49
L i s t o f Ta b l e s
2.1 Dimensions of personality according to FFM, their meanings, traits, and
qual-ities related to people that score high and low in them. . . 11
4.1 Multimorbidity interaction matrix example with some possible DDI. . . 21
5.1 Confusion matrix. . . 34
6.1 Variables that quantify the relation between eye and mouse movements. . . . 39
6.2 Variables that quantify the relation between eye and mouse movements in non-exploring condition. . . 41
6.3 Variables that quantify the relation between eye and mouse movements in exploring condition. . . 41
6.4 Extracted features. . . 45
6.5 Regression coefficients of the selected features. . . . 47
6.6 Model performance evaluation measures. . . 48
6.7 Correlation between uncertainty percentage and each FFM scale. . . 50
6.8 Mean percentage of lost samples of each medical case. . . 51
6.9 Percentage of items that evoked uncertainty of each medical case. . . 52
A c r o n y m s
AJAX Asynchronous JavaScript and XML.
DDI Disease-disease, Drug-disease and Drug-drug Interactions.
FFM Five Factor Model.
FN False Negatives.
FP False Positives.
HCI Human-Computer Interaction.
IGT Iowa Gambling Task.
IP Internet Protocol.
LED Light Emitting Diode.
MISI Multimorbidity Interaction Severity Index.
NEO-FFI NEO Five-Factor Inventory.
PHP PHP: Hypertext Preprocessor.
TN True Negatives.
C
h
a
p
t
e
r
1
I n t r o d u c t i o n
1.1 Motivation
Occasionally, everyone faces hard decisions, like choosing a career option or a place to live. However, some people experience more problems making choices than others. Com-monly, indecisive people are more anxious, have lower self-esteem, procrastinate [1] and regret more about decisions made [2]. They tend to be less efficient while making
deci-sions in the workplace as well [1]. Moreover, indecisiveness is a symptom of Obsessive Compulsive Disorder [1, 3]. For all these reasons, it is important to measure indecisive-ness and provide counseling if necessary.
Ongoing mental processes, like uncertainty, can be perceived in simple and common tasks, such as during the interaction with a computer. This can be tracked using eye gaze or a mouse cursor. In this dissertation, it was created a machine learning model that identifies moments of uncertainty based on mouse cursor movements. Assessing the per-centage of uncertainty instances, indecisiveness can be estimated, providing additional information to the standard questionnaires.
Moreover, the relationship between uncertainty and personality was analysed, in order to examine which factors and personal characteristics influence the former.
When a certain question is associated to uncertainty across several different people, it
may not be related to personal attributes but rather to the question’s structure or content. Therefore, the developed model may also be used to identify confusing items in a survey, or help teachers understand their students’ difficulties while answering to a work sheet,
for example. Probably, in the future, it could be provided real-time help in difficult
questions.
C H A P T E R 1 . I N T R O D U C T I O N
uncertainty was assessed. The physician’s knowledge about the cases may be imperfect or incomplete - which in real life can lead to errors -, and this analysis could be helpful for the understanding of their main difficulties.
This dissertation was developed in Faculdade de Ciências e Tecnologia - Universidade Nova de Lisboa in collaboration with the Department of Internal Medicine, University Hospital of Zurich, where the data was acquired.
1.2 Objectives
The main objective of this dissertation was to create a model that identifies moments of uncertainty during the fullfiment of a questionnaire. Eye gaze is the indicator of human visual attention [4] and, accordingly, it would be expected to track eye movements in order to access those events. Nevertheless, mouse tracking has numerous advantages over eye tracking and there is evidence suggesting that eye and mouse trajectories are similar [4, 5]. On that account, eye and mouse movements were compared to understand whether to use mouse cursor data to construct the model or not. To compare them, the Iowa Gambling Task (IGT), which is a card game that simulates real-life decision making, was used. Since the results manifested a fair correlation between mouse and eye movements, the mouse tracking data was used.
The uncertainty model was constructed by extracting features from mouse cursor data of an online survey. Each question of the survey could be classified as an uncertainty instance or not. Afterwards, the relation between the rate of uncertainty occurrences and personality was explored. Personality, on its turn, was measured through the results of a questionnaire that was also used to track the mouse cursor data.
Lastly, the model was applied to a clinical context. Three hypothetical cases of multi-morbidity - which concerns the existence of multiple concurrent acute or chronic diseases within an individual - with different degrees of complexity were analysed by physicians.
Therapeutic decision making for multimorbid patients is demanding due to the combined effects of pottentially harmful Disease-disease, Drug-disease and Drug-drug Interactions
(DDI) - for example, the treatment for one condition may be contraindicated by the presence of other conditions or treatments [6]. The model predicted which DDI evoked uncertainty through mouse movements. Accordingly, it was explored if the amount of difficult DDI in each case was consistent with its complexity (i.e., if the less complex case
had a lower amount of difficult DDI and vice-versa), in order to test its validity across
different contexts. The association between uncertainty and personality was also assessed
with this data.
Summing up, the objectives of this dissertation were:
• To compare eye and mouse cursor movements;
• To construct the mouse movement model for automatic detection of uncertainty events;
1 . 3 . T H E S I S OV E RV I E W
• To test the model validity in a clinical context;
• To find a relation between uncertainty and personality.
1.3 Thesis Overview
C
h
a
p
t
e
r
2
T h e o r e t i c a l C o n c e p t s
In this chapter, the theoretical concepts needed for the understanding of the disserta-tion are explored. It introduces two important tools used to measure Human-Computer Interaction (HCI), eye and mouse tracking, that were compared in this dissertation. Sub-sequently, uncertainty and indecisiveness - concepts inherent to decision making - are described, since the main objective of this study was to construct a model that detects uncertainty moments. Lastly, it is given a definition of personality, and the most distin-guished model of personality psychology - the Five Factor Model (FFM) - is presented, owing to the fact that a relation between uncertainty and FFM was investigated.
2.1 Human-Computer Interaction
In our daily lives, we are always surrounded by computer technology - computers, tablets, mobile phones, televisions, car navigation systems and even household appliances [7]. HCI studies how people interact with this technology [8]. One of its areas of work con-cerns the design, implementation and evaluation of interactive computer systems [8, 9, 10]. To attract users, the applications must be easy and pleasant to use, trustworthy and persuasive. Taking this into account, systems must be able to sense the users’ needs and preferences and respond accordingly [7, 9].
Besides computer system design, the characteristics of the user also influence HCI. For example, many researchers acknowledge the impact of personality in HCI [11]. Taking this into account, HCI has been used in many psychology experiments.
C H A P T E R 2 . T H E O R E T I CA L C O N C E P T S
the following sections.
2.1.1 Eye Tracking 2.1.1.1 The Eye
The mammalian eye absorbs and converts the light into electrochemical impulses that are processed by the brain. Firstly, the light is refracted by the cornea, which is the membrane that covers the front of the eye, protecting it. Then, it contacts the iris (the colored part of the eye) and the pupil (the centre of the iris), which, together, regulate the amount of light that enters the eye. Afterwards, the light encounters the lens, that brings objects at various distances into focus with the help of auxiliary muscles. Subsequently, the light is projected onto the retina where the light is converted into electrical impulses. This impulses travel through the neurons of the retina into the optic nerve and, finally, reach the brain [13]. Figure 2.1 shows the basic structures of the vertebrate eye.
Figure 2.1: Schematic of a vertebrate eye. Adaptad from [14].
2.1.1.2 Eye Tracking
Eye tracking is a sensor technology that records the positions where the user looks at and the eye sequential movements at any time [12, 15].
Nowadays, most eye tracking systems use thepupil centre corneal reflectiontechnique. Infrared light from a light source is directed towards the eye, causing reflections that highlight the pupil and the location of the corneal reflection, which are captured by a camera. Afterwards, the image processing software identifies them and, with trigonomet-ric calculations combined with geomettrigonomet-rical features, the point where the user is looking at (gaze point [16]) is obtained. Infrared light is used to avoid distractions while the eyes are being tracked [15, 17]. Figure 2.2 shows how the corneal reflection changes according to the gaze point.
2 . 1 . H U M A N - C O M P U T E R I N T E R AC T I O N
Figure 2.2: Corneal reflection position changes according to the gaze point. Adapted from [15].
The analysis of eye movements has been an area of interest for many years [18] with applications in many areas, such as medical diagnoses and psychological studies [19]. The eye gaze is the indicator of human visual attention and it gives insights into individuals’ cognitive states [4, 19]. Nevertheless, an eye tracker is expensive, it requires calibration and, frequently, the results are not satisfactory due to equipment losses of calibration. Additionally, it is only used in studies where the individuals are physically present [4, 5].
2.1.2 Mouse Tracking
2.1.2.1 The Mouse
To interact with a computer, a pointing device is needed to move the cursor on the com-puter monitor. The most commonly used is the mouse.
The mechanical mouse comprises a ball, that rolls according to the movements im-posed by the mouse, and two rollers in contact with the ball. The rollers detect movement, one in the horizontal direction, and the other in the vertical direction [20].
Nowadays, the mechanical mouse is being replaced by optical and laser mouses due to problems of deterioration and dirt accumulation over time [20]. The optical mouse, which is illustrated in figure 2.3, is constituted by a Light Emitting Diode (LED) that illuminates the surface and a lens that images the surface of the mouse onto a camera. The mouse works by constantly comparing the images of the surface. The laser mouse is an optical mouse which has a laser diode as the light source which illumination is less diffuse and uniform, exposing surface details that would not be revealed with a LED [21].
C H A P T E R 2 . T H E O R E T I CA L C O N C E P T S
Figure 2.3: Optical mouse operation. From [21].
2.1.2.2 Mouse Tracking
The cursor positions may be collected using a software, a method designated by computer mouse tracking. It is relatively recent and it can provide information about cognitive processes [23], since people tend to move their mouse cursor according to their focus of attention [24].
Several studies suggested that mouse cursor movements are related to eye movements [4, 5, 24] and mouse tracking is associated with numerous advantages over eye tracking. On the one hand, mouse cursor data can be acquired easily, without the presence of users and involving a great number of individuals simultaneously, increasing the amount of data. On the other, this technique does not have the eye tracking calibration problems [4, 5].
There is a wide variety of measures to analyse mouse trajectories, including temporal and spatial measures. The most common temporal features are velocity and acceleration [23, 25, 26]. The spatial variables include distance traveled [27, 28], angles of direction, where great angles correspond to directional shifts [25, 26, 27], curvature [25, 26] and straightness - the ratio between the Euclidean distance from the starting to the ending points and the total path distance -, which can give information about the attraction to an unanswered response, for example [25].
In this dissertation, the mouse tracking data acquired during decision making tasks was used to recognize moments of uncertainty.
2.2 Machine Learning
The world is overwhelmed with data. Nonetheless, there is an extensive gap between the generation and the understanding of potentially useful data. On that account, machine learning has become an extremely important field [29].
2 . 3 . D E C I S I O N M A K I N G
Data miningconsists in the process of discovering patterns in data that can be used to predict new data. Machine learningprovides the techniques to find and describe these pat-terns. Therefore, it supports problem solving through the analysis of information present in databases. For example, if a store owner wants to keep his costumers, a database of customer profiles and choices may be the solution. Patterns of behaviour can be analysed to predict who will remain loyal and who will not. Afterwards, the latter can be selected for special treatment [29].
In this dissertation, instances of uncertainty behaviour were collected and associated to several features from mouse tracking data. These instances were used to construct a mouse movement model for automatic detection of uncertainty.
2.3 Decision Making
Decision making consists in the capacity of choosing between different options based
on their possible rewards and risks [30]. The degree of the outcomes’ uncertainty varies and, therefore, there are different decision making methods. Nonetheless, all of them
include some common stages, such as recognition of the problem, search of information, assessment of alternatives, selection of an alternative, implementation and feedback [31]. Decision-making contexts comprise decisions undercertainty, where the outcome of each action is known,risk, where each action leads to one of a set of possible consequences and their probabilities are known, and, finally,uncertainty, where actions lead to a set of possible outcomes but their probabilities are unknown [32]. It is important to highlight that, in this dissertation, the termuncertainty is not related to the margin of error of a measurement, as it is applied in physics.
The theories about decisions made under risk propose that humans follow the prob-abilistic rules. However, several studies have put into evidence that some decisions are made based on an intuitive approach. The dual process theory suggests that human make both rational (analytical) and non-rational (intuitive and emotional) decisions. When the possible outcomes are uncertain, both systems act in collaboration [33].
Some individuals are less tolerant to decisions made under uncertainty, and they are known as indecisive [3].
2.3.1 Indecisiveness
Periodically, everyone faces difficult decisions. Nonetheless, some people manifest a
tendency to experience problems in making decisions. Indecisiveness is defined as a chronic incapacity to make decisions across a wide variety of domains and situations [1, 2, 34].
C H A P T E R 2 . T H E O R E T I CA L C O N C E P T S
effective decisional strategies [1] and experience more choice dissatisfaction [2].
Indeci-siveness has been related to high anxiety, low problem-solving abilities, low self-esteem, procrastination [1], perfectionism and obsessive-compulsive tendencies [1, 3].
2.4 Personality
Although there is no general definition, personality can be defined as "an individual’s characteristic patterns of thought, emotion, and behavior, together with the psychological mechanisms - hidden or not - behind those patterns"[35]. These patterns are called
personality traits[36, 37], and a cluster of related traits constitute apersonality dimension
[38].
There are plenty of personality theories. During decades, there was a considerable disagreement between the number and the names of personality dimensions. Nowadays, the most influential model of personality psychology is theFFM, due to its robust evidence across cultures [38, 39, 40].
2.4.1 Five Factor Model
The FFM provides an organization of personality traits in five basic dimensions, known as theBig Five: Neuroticism, Extraversion, Conscientiousness, Agreeableness, and Openness to Experience [38, 41]. Most of personality traits can be categorized into one of these factors [40].
Each factor can be represented by a scale. The greater the tendency of an individual to behave according to a specific dimension, the higher the score of its scale. Therefore, a person can be characterized by the scores obtained in the five factors [42]. Table 2.1 shows the dimensions’ meanings and the traits associated to them, as well as some qualities related to people that score high and low in them.
This model organizes sets of variables that are related to each other and unrelated to other sets [41]. For example, people who are gregarious and assertive tend to be, also, enthusiastic and active, which are qualities related to Extraversion. Nevertheless, people who are gregarious and assertive may or may not be intellectually curious and imaginative. Therefore, those qualities relate to another dimension, Openness to Experience [40].
The most validated tools to measure the FFM’s dimensions are questionnaires. The most used is the Revised NEO Personality Inventory, which measures all the traits that define each dimension. The NEO Five-Factor Inventory (NEO-FFI) is a brief version which only assess the five factors. Another questionnaire that is widely used is the Big Five Inventory [40], which is an even shorter version that also measures the five dimensions [43]. In this dissertation, the NEO-FFI was used. An example of a NEO-FFI item is “I am someone who is talkative”, which belongs to the Extraversion scale.
2 . 4 . P E R S O N A L I T Y
Table 2.1: Dimensions of personality according to FFM, their meanings, traits, and quali-ties related to people that score high and low in them. Based on [38, 44, 45].
Dimension Meaning Traits High Scores Low Scores
A tendency Anxiety; Irrational;
to experience Hostility; Low self-esteem; Calm;
dysphoric Depression; Poor control Relaxed;
Neuroticism affect - Self- of impulses; Even-tempered;
sadness, Consciousness; Ineffective Unflappable;
hopelessness, Impulsiveness; coping; Stable
guilt Vulnerability Pessimistic
Warmth; Cheerful; Introverted;
Activity; Dominant; Quiet;
Preference for Gregariousness; Talkative; Reserved;
Extraversion companionship Assertiveness; Sociable; Retiring;
and social Excitement Warm; Shy;
stimulation Seeking; Enthusiastic; Silent;
Positive Energetic; Withdrawn;
Emotions Optimistic Unadventurous
A strong Competence; Thorough;
sense of Order; Neat; Disorganized;
purpose Dutifulness; Well-organized; Lazy;
Conscientiousness and high Achievement Diligent; Irresponsible;
aspiration Striving; Achievement- Careless;
levels Self-discipline; oriented; Sloppy
Deliberation Efficient
Trust; Helpful; Hostile;
Straight- Caring; Indifferent
Involves forwardness; Nurturing; to others;
Agreeableness aspects of Altruism; Emotionally
Self-humanity Modesty; Supportive; centred;
Tender- Cooperative; Jealous;
Mindedness; Trusting; Spiteful;
Compliance Forgiving Selfish
Fantasy; Creative; Conservative;
A need for Aesthetics; Intellectual; Shallow;
Openness to diversity, Feelings; Curious; Simple;
Experience novelty, Actions; Innovative;
Closed-and change Ideas; Flexible; minded
C
h
a
p
t
e
r
3
S t a t e o f t h e A rt
This chapter comprises the related work already developed. Initially, the eye and mouse movements comparison studies are introduced. Afterwards, projects concerning decision making issues - indecisiveness, survey response difficulty and medical decision making
-are presented.
3.1 Eye and Mouse Movements
3.1.1 Eye Tracking Data Correction
A problem that arises in every study involving eye tracking data is due to equipment losses of calibration. However, it is possible to correct this data. Hornof and Halverson [46] exposed an approach that depends on required fixation locations to recalibrate the eye tracker. In their experiment, it was required to click in a specific target and, assuming that the participant looks at the target during the click, if the distance between the eye gaze data on the moment of click and the target was higher than a certain threshold, the eye tracker would be automatically recalibrated after the click. An alternative technique consists in two linear regressions (one for horizontal dimension - X axis - and another for vertical dimension - Y axis) between the known data points and the corresponding raw data [47]. The method applied in this dissertation to correct the eye tracking data is similar to the latter, but with some modifications.
3.1.2 Eye and Mouse Movements Comparison
C H A P T E R 3 . S TAT E O F T H E A R T
visited [4, 5] and the correlation between the times spent in each region of the web page by the gaze and the cursor [4]. Guo and Agichtein [48] predicted, with an accuracy of 77%, the regions where the eye gaze and mouse cursor were within 100 pixels of each other using mouse cursor features.
The relationship between the eye and mouse movements was never explored during decision making tasks. Therefore, in this dissertation, these movements were compared in this context and new measures will be presented.
3.2 Decision Making
3.2.1 Indecisiveness
Germeijs and Verschueren [49] investigated the relation between indecisiveness and per-sonality. It was revealed a strong and positive correlation between indecisiveness and Neuroticism and a negative correlation between indecisiveness, on the one hand, and Conscientiousness and Extraversion, on the other.
Career decisions are common and difficult and, therefore, there are several studies
concerning career indecision [1, 50]. Fabio et al. [1] compared career indecision (mea-sured by the Career Decision-making Difficulties Questionnaire) with indecisiveness and
concluded that the first is most highly related to emotional intelligence, while indecisive-ness is most highly linked to personality traits. The correlation between career indecision and indecisiveness was moderate and, hence, both correlated positively with Neuroticism and negatively with Extraversion (in line with [49]) and emotional intelligence. Lastly, it was also demonstrated that career indecision is inversely related to career decision self-efficacy and, accordingly, it is possible to infer that Extraversion is positively correlated
to career decision self-efficacy and that Neuroticism is negatively related to it, which is
confirmed by Page et al. [50]. The latter also reported a positive correlation between career decision self-efficacy and Conscientiousness.
Watson [51] analysed the validity of measuring indecisiveness with mouse tracking. Several features were computed and it was only found one significant correlation with in-decisiveness - the number of vertical direction changes. Surprisingly, it was not obtained an association between indecisiveness and response times. Consequently, the usage of mouse tracking to measure indecisiveness was not supported.
All the studies above used Indecisiveness Scale questionnaire to measure indecisive-ness.
3.2.2 Survey Response Difficulty
Mouse cursor movements give insights into mental processes [52]. Accordingly, there are mouse movement patterns associated to uncertainty. Cepeda et al. [53] defined sev-eral patterns of mouse movement behaviour extracted from online surveys response. It was distinguished the revisit pattern, which consists in returning to previous answered
3 . 2 . D E C I S I O N M A K I N G
questions, the hover pattern, verified when the users hover various alternatives before se-lecting their final answer, the horizontal direction inversions, straight and curvy patterns, among others.
Schneider et al. [52] investigated the effect of ambivalence on mouse cursor trajectories
by assessing response times and the maximum deviation from the idealized straight line trajectory toward the unchosen answer. It was concluded that, in case of uncertainty, the maximum deviation is higher. In agreement with [51], it was not found a relation between response times and uncertainty.
Zushi et al. [54] developed a software that tracks mouse movements of students during their learning activities in order to help teachers understand their students’ be-haviours. It was verified that mouse trajectories become unstable (e.g. excessive number of horizontal direction inversions) when learners are hesitant. It was also perceived that response times and the number of horizontal direction inversions have a negative and strong correlation with the ratio of correct answers. That probably means that horizontal direction inversions and response times are good predictors of uncertainty (which con-tradict the findings of [51] and [52] related to response times). Accordingly, Conrad et al. [55] used response times and age to detect response difficulty. Conversely, response
times do not specify the cause of the delay. Slow responses can be related to multitasking, as answering a call, or the answer could involve mental arithmetic, among several causes [56].
Due to the disadvantages of using only response times as a predictor of response diffi
-culty, Horwitz et al. [56] used mouse cursor trajectories and age to predict it. Hover the question text for more than 2s, horizontal directional inversions, mark a response option text for more than 2s, horizontal and vertical tracking (which occur when the mouse follows the eye while reading) were the variables computed, but only hover, horizontal directional inversions and mark an option turned out to be significant predictors of un-certainty. On the one hand, hover, horizontal and vertical tracking were binary features indicating whether each movement occured or not in each question. On the other, hor-izontal direction inversions and marker were coded "0"if the movement did not occur, "1"if the movement occured once per question and "2"if it occured more than once per question. To construct the model, the participants classified each question in terms of difficulty. The accuracy of the model was 74.28%, lower than the already existing model
that detects moments of uncertainty based only on response times and age [55] with an accuracy of 77.98%. Complementing the information from both models, the accuracy poorly rose to 79.11%. One of the main objectives of this dissertation is similar to this research, however, the approach was different. Firstly, the extracted features were not the
same. Additionally, the variables were not considered as binary or in a 3-point scale. For example, the hover time and the number of different answers hovered may provide more
C H A P T E R 3 . S TAT E O F T H E A R T
3.2.3 Medical Decision Making
There are not many studies concerning the influence of personality in medical decision making. Nonetheless, Pilárik and Sarmány-Schuller [57] related the decision making pro-cess of paramedics with personality. Male decision makers characterized by low scores in Neuroticism and high in Extraversion, as well as fast responses, had the best perfor-mance in decision making. It was concluded that the combination of low Neuroticism and high Extraversion leads to adaptive and positive coping strategies. Good performance in females was related to low emotional awareness, ability to deal with stress and fast responses.
The assessment of medical decision through mouse movements, on its turn, was not studied yet. On that account, this dissertation consists in an innovative research.
C
h
a
p
t
e
r
4
E x p e r i m e n t a l P r o c e d u r e
This chapter describes the experimental procedure involved in this dissertation, including the population characterization and the data acquisition conditions. Three different
stud-ies were executed - the comparison between eye gaze and mouse cursor trajectorstud-ies, the construction of the model that detects events of uncertainty through mouse movements obtained with survey responses and, lastly, the application of the model in a clinical context, where mouse data was tracked during a medical decision making task.
4.1 Eye and Mouse Movements Comparison
4.1.1 Experiment Description
All the three experiments described in this chapter began with the collection of personal data and a written consent for the use of the participants’ data according to the guidelines of the Declaration of Helsinki for research involving humans.
Eye and mouse tracking data, used to be compared, were collected during the real-ization of the IGT. The IGT is a widely explored game that simulates the daily decisions made under uncertainty. It is a card game with four decks that differ in the amount of
money that can be won or lost. The game starts by giving the player a fictitious amount of money that should be increased as much as possible. It covers 100 trials, which is unknown to the player, and in each one of them the participant needs to choose one card out of four (by clicking on it with the mouse cursor). After each choice, it is revealed the money won or lost. At a certain moment of the IGT, the player should understand that there are two advantageous decks [58].
C H A P T E R 4 . E X P E R I M E N TA L P R O C E D U R E
Figure 4.1: Decks’ disposition on adapted IGT.
The data acquisition was made in a quiet and dim room without vigilance.
4.1.2 Data Acquisition
During the IGT, the mouse tracking data was being sent to a server machine via Asyn-chronous JavaScript and XML (AJAX), where the data was saved as a file in a database. This file contains the person ID, the trial number, the x and y cursor’s position (in pixels) and time.
The eye gaze data file, acquired with the eye tracking system, includes the person ID, the trial number, the x and y position to where the right and left eyes were looking, among other information.
4.1.3 Participants
The requirements to participate in this study were:
• Being healthy;
• Have normal, or corrected-to-normal, vision;
• Not having a medical history of neurological or psychiatric illnesses;
• Not being currently medicated;
• Being native or fluent speakers of standard German.
The participants were psychologists or university students from areas like technology, engineering and economics. These students were from the Swiss Federal Institute of Technology and the University of Zurich. They were paid with 20 Swiss Francs, or the equivalent in Euros, or, in the case of psychologists, with hours.
4 . 2 . U N C E R TA I N T Y M O D E L
Figure 4.2: Data acquisition architecture. From [53].
4.2 Uncertainty Model
4.2.1 Experiment Description
This study was based on responses to an online survey constituted by three different
personality questionnaires - NEO FFI and other two. The mouse movements obtained from all the questionnaires were used to construct the uncertainty model. To measure personality, only NEO-FFI was used. The personality questionnaires answers were 5-point Likert-type scale.
The data acquisition was made in a quiet room without vigilance.
4.2.2 Data Acquisition
While the participants were completing the online survey, the mouse tracking data was being sent to a server machine via AJAX, where the data was saved as a file in a database. The survey results were also saved on this database via the Survey Management System using PHP: Hypertext Preprocessor (PHP). This process is represented in figure 4.2.
The mouse cursor data file contains the frame number, event type (0 during movement, 1 when the mouse button is pressed down in the beginning of a click and 4 when the button is released in the end of a click), question number if hovered, answer number if hovered, x and y cursor’s position (in pixels) and time.
The survey file includes the questionnaire start and end times, Internet Protocol (IP) address, name, e-mail, birthday, phone number and the answers to each question. Each personality scale was calculated by accessing the answers related to that scale.
C H A P T E R 4 . E X P E R I M E N TA L P R O C E D U R E
4.2.3 Participants
The requirements to participate in this study were the same as those presented in sec-tion 4.1.3. The condisec-tions of the research were also the same. Conversely, the participants were not the same.
4.3 Application of the Model to a Clinical Context
4.3.1 Experiment Description
This experiment was conducted through an online survey. This survey included the NEO-FFI, to assess the Big Five personality dimensions, and three complex medical cases. The answers of the NEO-FFI were 5-point Likert-type scale.
Physicians evaluated the severity of multimorbid patients’ potentially harmful DDI. Three hypothetical cases with different degrees of severity were used, one of them with
a high potential for harmful interactions, another with a low potential for harmful inter-actions, and the last in between. The most complex DDI are covered by the high conflict case, however, the number of complex DDI is higher in the moderate conflict case. The low and the high conflict cases were based on the cases used in [6] and adapted by physi-cians. The medical history of each patient covers six conditions and six drugs, resulting in 66 interactions. Multimorbidity Interaction Severity Index (MISI) is a web-based tool that provided the cases and the respective patients’ histories, as well as all possible DDI randomly ordered, which were adapted to this thesis’ needs. Each case included a mul-timorbidity interaction matrix in order to collect the physicians’ judgements about the DDI severity, the probability of occurrence of a problem and the priority to intervene. The physicians also reported how confident they were about the ratings of each DDI. The answers were 4-point Likert-type scale and all the questions were mandatory. The structure of the multimorbidity interaction matrices is illustrated in table 4.1.
Following the DDI evaluation, the participants answered questions related to the experience of using the three rating scales (severity, probability and priority). Lastly, the cases’ overall complexity and severity were estimated.
Each medical case took, in average, 40 minutes to conclude. In order to avoid diver-gent behaviours due to tiredness, the cases were completed in distinct occasions and in a random order (different for each physician).
During this task, the activity of the mouse cursor was tracked. Afterwards, the mouse cursor data was used to detect events of uncertainty.
The data acquisition is described in section 4.2.2.
4.3.2 Participants
The requirements to participate in this study were:
• Being a doctor;
4 . 3 . A P P L I CAT I O N O F T H E M O D E L T O A C L I N I CA L C O N T E X T
Table 4.1: Multimorbidity interaction matrix example with some possible DDI.
Severity Probability Priority Confidence
1 2 3 4 1 2 3 4 1 2 3 4 1 2 3 4
Hypertensive
emergency Metformin
Renal failure Depression
Diabetes
Mellitus II Escitalopram
Lisinopril Prednison
... ...
• Being healthy;
• Have normal, or corrected-to-normal, vision;
• Not having a medical history of neurological or psychiatric illnesses;
• Not being currently medicated;
• Being native or fluent speakers of standard German.
C
h
a
p
t
e
r
5
M e t h o d s
In this chapter, the materials and methods used are described and justified. Firstly, it focus on eye and mouse movements comparison study and, subsequently, on the uncer-tainty model construction. The latter comprises features extraction and selection, the classification process, as well as the relation between uncertainty and personality. Finally, the created model was applied to the medical decision making task.
5.1 Eye and Mouse Movements Comparison
5.1.1 Technological Materials
For the comparison between eye and mouse movements study, the SMI RED, by Senso-Motoric Instruments [59] was used to acquire the eye gaze data.
The IGT was programmed in the Presentation software from Neurobehavioral Systems [60].
Data analysis was executed using Python language [61] by the code editor PyCharm 2017.2.4 [62]. The python packages used were NumPy, the essential library for computing [63], Matplotlib, a plotting package [64], SciPy, that provides mathematical functions [65] and Pandas, which supplies data structures and data analysis tools [66].
5.1.2 Eye Tracking Data Correction
C H A P T E R 5 . M E T H O D S
Furthermore, some of the eye tracking data was unsatisfactory, since the equipment loses calibration regularly. This problem was essentially solved with two linear regression (one for horizontal dimension - X coordinates - and another for vertical dimension - Y coordinates) between the known data and the corresponding raw data in two parts. The players were instructed to focus on the centre of the screen in the beginning of each trial, and, therefore, the eye tracking data was adjusted accordingly, by accessing the median of the initial value of all trials for each participant and considering it the centre. After this step, the major part of the trials was well calibrated. Nonetheless, some data was still not acceptable and, therefore, the second part of the calibration was applied to these trials. To do so, it was assumed that when people click in a target they tend to look at it. The distance between the mouse and eye coordinates during the click was accessed for each trial. In the trials which distance was higher than 80 pixels, the ratio between the mouse and eye coordinates in the moment of the click was computed and multiplied to the eye tracking data. The advantage of this two-phased linear regression comprises the non-modification of the trials already well-calibrated only with the first step. Figure 5.1 shows an example of non-calibrated and calibrated trials.
(a) (b)
Figure 5.1: Eye gaze (red) and mouse (black) positions a) before and b) after the calibration process.
Even with the application of the two-phased linear regression, some trials still had not suitable eye gaze data. To remove this data, the ratio between the amount of data outside the central square where the decks were and the total data –outside ratio- was computed. The central square is represented in figure 5.2 and it is characterized by absolute values of X and Y smaller than 400. This value was chosen following the observation of several trials, as well as the criterion to eliminate non-calibrated trials - the trials with an outside ratio higher than 0,2 were discarded. A difference between this method to correct eye
tracking data and the approaches presented in other studies (e.g., [47]) is this elimination of the trials that, after the correction, are still not calibrated.
Figure 5.3 sumarizes all the steps applied to correct the eye tracking data.
5 . 1 . E Y E A N D M O U S E M OV E M E N T S C O M PA R I S O N
Figure 5.2: Representation of the central square where the decks are on IGT.
5.1.3 Comparative Measures
To compare the eye gaze and mouse cursor movements, some measures were computed. To do so, few regions inside the IGT were considered - each deck constituted a region and the last region was constituted by the space outside the decks. Two of the metrics calculated,common regions ratioandtimes correlation, were adapted from [4, 5]. Another variable was introduced,intersection ratio, to access the amount of time that the eye gaze and the mouse cursor were visiting the same region.
5.1.3.1 Common Regions Ratio
For each trial, it was calculated the ratio between the number of regions that were visited by both eye gaze and mouse cursor and the total number of regions visited. This feature, described in equation 5.6, was calledcommon regions ratio. The considered regions were “Deck 1”, “Deck 2”, “Deck 3” and “Deck 4”. For example, if in a certain trial the eye gaze visited “Deck 1” and “Deck 4” and the mouse visited only the “Deck 4”, the value of this relation would be 1/2. The mean value of all trials for each participant was determined. This method was based on that implemented by [4, 5]. In this study, it was only considered, for the eye gaze, the regions visited for more than 50 ms, the minimum fixation duration according to [67].
Common regions ratio=Number of decks visited by eye and mouse
Total number of decks visited (5.6)
5.1.3.2 Times Correlation
The time spent in each region by the eye gaze and the time spent in each region by the mouse cursor were computed for all trials and correlated [4]. The Pearson correlation coefficient, which measures the linear relationship between two datasets, was assessed.
C H A P T E R 5 . M E T H O D S
Calibration - step 1: Adjustment of the eye tracking data by correcting a known fixation. In this case, the initial value should be in the centre -
po-sition (0,0) - and the following algorithm was applied:
x=x−x0m (5.1)
y=y−y0m (5.2)
Where x0m andy0m are the median of the initial xandy values of all trials, respectively. These two variables vary from participant to participant.
Assessment of the distance between eye and mouse coordinates in the moment of the click in each trial.
Distance < 80 pixels
Calibration - step 2: Calculation of the ratio between eye and mouse coordinates in the moment of the click and subsequent multiplication.
x=x×xratio where xratio=xclick,mouse xclick,et
(5.3)
y=y×yratio where yratio=yclick,mouse yclick,et
(5.4)
xclick,mouse, yclick,mouse, xclick,et andyclick,et are the xandymouse and eye tracker coordinates in the moment of the click, respectively.
Each trial has a differentxratio andyratio.
Elimination of uncalibrated trials: Computation of the ratio be-tween the amount of data outside the decks area and the total data.
Outside ratio=Number of samples in decks’ area
Number of samples (5.5)
outsideratio < 0.2
Elimination of the trial Calibration
concluded no
yes
no yes
Figure 5.3: Eye tracking data correction
5 . 1 . E Y E A N D M O U S E M OV E M E N T S C O M PA R I S O N
defined in equation 5.7, was called times correlation. Beyond the regions considered previously, it was also measured the time spent in the region “Outside the decks”. This region was not considered in section 5.1.3.1 since it is a region visited by both eye gaze and mouse cursor in almost every trial, and, therefore, the common regions ratio would increase significantly due to a region which is nearly compulsory to visit (for example, to go from a deck to another it is required to visit the region “Outside the decks”, as well as in the beginning of each trial, where the participants were instructed to focus on the middle of the screen).
Times correlation=
P
ρei,mi
Number of regions=
ρe1,m1+ρe2,m2+ρe3,m3+ρe4,m4+ρeo,mo
5 (5.7)
In equation 5.7,ρei,micorresponds to the Pearson correlation coefficient between the time spent in regioniby the eye gaze and the mouse cursor, with regions “Deck 1” (ρe1,m1), "Deck 2"(ρe2,m2), "Deck 3"(ρe3,m3), "Deck 4"(ρe4,m4) and "Outside the decks"(ρeo,mo).
5.1.3.3 Intersection Ratio
The ratio between the time where the eye gaze and the mouse cursor were in the same region and the trial time was also quantified and it was calledintersection ratio, as it is mentioned in equation 5.8. It was considered all the five regions mentioned above. The mean value of all trials for each participant was calculated.
Intersection ratio=Time of eye and mouse intersection
Trial time (5.8)
This variable covers the spatial information given bycommon regions ratio and the temporal information given by times correlation, but the last two provide insights that intersection ratio might not provide. For example, if a participant looks from a deck to another and, after doing this eye movement, moves the mouse cursor accordingly, there is no intersection ratio, but the eye and mouse movements have some correlation since the path is the same. In this hypothetical case, the regions would be the same, directly affecting the common regions ratio feature. Taking this into account, these three features
complement each other.
5.1.3.4 Eye and Mouse Alterations
C H A P T E R 5 . M E T H O D S
5.1.4 Exploring and Non-exploring Conditions
When the participants know in advance the deck that will be selected, they make a fast decision, therefore eye and mouse move directly from the centre of the screen to the cho-sen deck. In this condition – condition A -, the both movements should highly correlate. However, when the participants explore the options and waver between different decks –
condition B -, those movements may not be correlated. Condition A is verified when the eye gaze and the mouse cursor only visit one region, and condition B in the other trials. The variablescommon regions ratio,times correlationandintersection ratiowere accessed for these two conditions. Thealterations correlationfeature was not calculated to compare these conditions since, in condition A, there are no alterations.
5.2 Uncertainty Model
5.2.1 Technological Materials
The LimeSurvey web application was used to conduct the personality questionnaires and to implement MISI.
Pycharm 2017.2.4 [62] was used to do the data analysis using python language [61]. Similarly to the first study, the Python packages used were NumPy [63], SciPy [65], Pandas [66] and, additionally, Scikit-learn, used for data mining and data analysis [69], and Seaborn, a statistical data visualization library [70].
Lastly, MISI was the tool that provided medical cases, which were adapted to this thesis’ needs [6].
5.2.2 Data Pre-processing
Some files containing mouse cursor positions had bugs. The errors found and the correc-tions applied were:
1. For each new pointer movement, the files had a new line, but, periodically, two different lines were together and they were splited in two distinct lines;
2. Some lines were out of order and, therefore, they were reordered by frame number;
3. Files without the number of frames were identified;
4. If different files had the same IP address and questionnaire, they were concatenated;
5. Same position lines, (x;y)i = (x;y)i+1, were located and the line with (x;y)i+1was removed;
6. Same time lines,ti=ti+1, were identified and the line withti+1was eliminated;
7. Lines with NotANumber values were removed;
5 . 2 . U N C E R TA I N T Y M O D E L
8. Data acquired with touch screen devices was excluded since the mouse cursor move-ments is lost in these devices.
To identify data acquired with touch screen devices, the ratio between the events where the mouse is moving (events=0) and the click down events (event=1) was computed. If less than 2, it was considered a touch screen device, as expressed by equation 5.9.
Number of events = 0
Number of events = 1 <2 (5.9)
5.2.3 Features Extraction
Several features related to uncertainty behaviour were computed for each question of the survey. With these variables, it was created a model that detects the difficult questions for
an individual. In this section, the temporal, spatial and contextual features are presented.
5.2.3.1 Temporal Features
Firstly, to access the temporal information, it was necessary to remove the time associated to abandon events. Sometimes, due to external factors (e.g. receiving an e-mail or an-swering a call), an individual may abandon the survey. Without correction, the questions where the abandons occur could be associated to uncertainty as a result of the time spent there. Therefore, the abandon events were identified - when the mouse cursor is not moving for more than 10 times the mean question time - and removed.
Short times in questions were also ignored. They can be caused by quick visits to the question above or bellow since the question height is small, or by scroll. These events occur when the time spent in a question is lower than 100 ms [71].
The temporal features areaccumulated time,time before click,pause before click, correc-tion time,hover selected answerandvelocity.
Theaccumulated timeis the total time in an item, i.e., the sum of all time intervals in a question, as expressed in equation 5.10, where∆t
qi represents, hence, a time interval spent in questioni.
Accumulated time=X∆tqi (5.10)
Time before clickis the sum of all time intervals in a question until the first click, as shown in equation 5.11. For example, if a participant enters in a question for the first time at t = 20s, stays in the item for 10s without clicking, abandon the question, comes back at t = 45s and clicks for the first time at t = 50s, the time before click is 15s.
Time before click=
1stclick
X
enter ∆t
C H A P T E R 5 . M E T H O D S
Thepause before click, i.e., the time interval that an individual remains stopped before clicking an answer, was also computed, based on [72]. If the participant clicks more than once in a single question (to correct a previous answer), this value is averaged.
Correction timeis the sum of all time intervals in a question from the first click to the last click (last correction), as it is indicated in equation 5.12. If there is not any correction, the result is zero. The computation of this feature is similar to that oftime before click, but instead of being the sum of the time intervals until clicking for the first time, it is from the first choice to the last one.
Correction time= lastclick
X
1stclick ∆t
qi (5.12)
Hover selected answeris the ratio between the sum of the time intervals spent hovering the selected answer of a certain question and the total hover time in that question. It was based on a feature extracted by [53, 56]. In this study, when an individual is in the response area, i.e., close to one of the possible answers, it is considered that the participant is hovering that answer. This feature is described in equation 5.13, where ∆thover selected answer, qi represents a time interval spent hovering the selected answer of questioniand∆t
hover,qiis a time interval spent hovering the answers of questioni.
Hover selected answer=
P∆
thover selected answer, qi
P∆
thover,qi
(5.13)
Thevelocitywas also calculated and it is expressed in equation 5.14, wherenis the number of samples. ∆x
i,∆yiand∆ti are defined in equation 5.15. To create the model, it was used themean velocity. Correspondingly, it was necessary to compute, on the one hand, the mean value across all samples (equation 5.14 symbolizes the velocity between two samples) and, on the other, the mean value across all visits to a certain question. To compute this variable, in order to have equal temporal intervals proportional to the mean time variance, it was applied a cubic spline interpolation. Using this method, a series of unique cubic polynomials are adjusted between the data points, resulting in a smooth continuous curve [73].
Velocity=
p
∆x
i2+∆yi2 ∆t
i
, i= 1, ..., n−1 (5.14)
Where
∆x
i=xi+1−xi ∆yi=yi+1−yi ∆ti=ti+1−ti (5.15)
5.2.3.2 Spatial Features
Firstly, it was applied a cubic spline interpolation to smooth the spatial signal, producing intervals equal to the mean distance variance. Subsequently, the spatial featuresdistance,
distance from answerandstraightnesswere computed.
5 . 2 . U N C E R TA I N T Y M O D E L
Thedistancetravelled in a question was measured and it is defined in equation 5.16, wheresqi, displayed in equation 5.17, represents the travelled distance in a visit to ques-tioni. ∆x
iand∆yi, on their turn, are illustrated in equation 5.15.
Distance=Xsqi (5.16)
Where
sqi= n−1
X
i=1 q
∆x
i2+∆yi2 (5.17)
Thedistance from answer, i.e., distance from the path inside a question to the selected answer, was also computed. This variable is illustrated in equation 5.18, where xanswer andyanswer are thexandycoordinates of the question’s last click. For the construction of the model, it was calculated the meandistance from answer, which covers the mean value across all samples and, then, the mean value across all visits to a specific question.
Distance from answer=
q
(xi−xanswer)2+ (yi−yanswer)2, i= 1, ..., n−1 (5.18)
Straightnessis the ratio between the Euclidean distance from the moment of entering in a question until leaving it and the total distance travelled in that question [25]. It is defined in equation 5.19 andsqiis described in equation 5.17. The meanstraightnessover all the visits to a specific question was used.
Straightness=
p
(x1−xn)2+ (y1−yn)2 sqi
(5.19)
5.2.3.3 Contextual Features
The contextual features comprise the number ofinteractionswith each question (i.e., the number of times in each question) as well as the number ofrevisits, which is the event of going back to a previous question without changing its answer.
The number of corrections was also calculated. There are two types of corrections
-corrections within itemandcorrections between item. The first occurs when an individual selects an answer, remains in the same question and changes the option, while the latter happens when a person selects an answer, moves forward to next questions and, after answering at least one more question, goes back and changes the previous answer.
The number of<-turns, i.e., horizontal direction changes [53, 54, 56], was extracted by computing horizontal trajectory derivative changes from positive to negative or vice-versa.
C H A P T E R 5 . M E T H O D S
Features
Temporal Spatial Contextual
Accumulated time
Time before click
Pause before click
Correction time
Hover selected answer
Velocity
Distance
Distance from answer
Straightness
Interactions
Revisits
Corrections within item
Corrections between item
<-Turns
Hovered answers
Figure 5.4: Features extracted.
Hovered answers=Number of hovered answers
Total number of answers (5.20)
Figure 5.4 summarizes all the extracted features.
5.2.3.4 Features Normalization
Distinct people express uncertainty differently. For example, maybe the time spent in
a difficult question by a fast person is equal to the time spent in an easy question by a
slower individual. Accordingly, the features were normalized for each person separately using the formula presented in equation 5.21, where zi represents the sample xi after normalization,xandσ are the mean and standard deviation of the samples, respectively. This normalization is known as z-score [74]. Applying this transformation, the samples are reshaped so that its mean and standard deviation become 0 and 1, respectively [75].
zi=xi−x
σ (5.21)
Nonetheless, with all the features normalized, it is only possible to identify the most difficult questions for each individual. In the hypothetical case of uncertainty in all
questions (or a great part of them), this would be a problem. Therefore, the original values of each feature were also used to construct the model. Taking this into account, 30 features were used - 15 normalized and 15 not normalized.
Subsequently, all the features from all the participants were concatenated and nor-malized in order to standardize the range of the variables.
![Figure 2.1: Schematic of a vertebrate eye. Adaptad from [14].](https://thumb-eu.123doks.com/thumbv2/123dok_br/16547644.737008/26.892.231.659.524.789/figure-schematic-vertebrate-eye-adaptad.webp)
![Figure 2.2: Corneal reflection position changes according to the gaze point. Adapted from [15].](https://thumb-eu.123doks.com/thumbv2/123dok_br/16547644.737008/27.892.152.753.167.332/figure-corneal-reflection-position-changes-according-point-adapted.webp)

![Figure 4.2: Data acquisition architecture. From [53].](https://thumb-eu.123doks.com/thumbv2/123dok_br/16547644.737008/39.892.144.748.163.384/figure-data-acquisition-architecture-from.webp)