Emma Antunes Rodrigues
Bachelor of Science in Biomedical EngineeringBehavioural Interventions in Support of Healthy
Brain Aging
Dissertation submitted in partial fulfillment of the requirements for the degree of
Master of Science in
Biomedical Engineering
Adviser: Sylvain Moreno, Professor, Simon Fraser University
Behavioural Interventions in Support of Healthy Brain Aging
Copyright © Emma Antunes Rodrigues, Faculty of Sciences and Technology, NOVA Uni-versity Lisbon.
The Faculty of Sciences and Technology and the NOVA University Lisbon have the right, perpetual and without geographical boundaries, to file and publish this dissertation through printed copies reproduced on paper or on digital form, or by any other means known or that may be invented, and to disseminate through scientific repositories and admit its copying and distribution for non-commercial, educational or research purposes, as long as credit is given to the author and editor.
A c k n o w l e d g e m e n t s
Time is a funny thing. It is a duality between the eternal and the ephemeral.
Embarking on this dissertation appeared to be a never-ending journey, one I felt I was unprepared to undertake since it was only recently I started my undergraduate degree. Or was that already five years ago?!
I started my first year pursuing an engineering degree in micro and nanotechnology but by the end of second semester I was curious about technological developments com-bined with “real” applications in the field of health care. I transferred to biomedical engineering. I thought the move would also spare me from a few scary courses, but no, they all caught up to me. The cramming, sleepless nights and agonizing anticipation of grade results felt interminable.
Such a strange sense now that all this has passed!
I am truly fortunate. I have come across some amazing people – friends, colleagues, professors. People who have guided and helped me to understand and grow, both intel-lectually and as a human being.
I owe much to my advisor Professor Sylvain Moreno who cared and inspired me into the subject, affording me the opportunity to learn from a leading researcher and connect with other professionals in the field.
I would also like to thank advisor Professor Carla Quintão for her expertise and insight, facilitating collaboration and sparking my enthusiasm to forge ahead.
My sincere gratitude to Dr. Greg Christie whose insightful advice and constructive feedback were invaluable.
I am tremendously appreciative of the individuals who donated their time to partici-pate in the study in order to provide me with precious data.
I am grateful to the entire Digital Health Hub at Simon Fraser University for their uncommon generosity; Killian, Yasaman and Ben for helping me with such promptness whenever I needed and making me smile at the end of each day.
I thank the Faculty of Science and Technology of Nova University of Lisbon who work hard towards educating us and transforming us to have a positive impact in the world.
I would also like to thank all of my friends for always being by my side, for making me laugh, for listening to me, for giving me advice and for all the great times.
Winds in the east, Mist coming in, Like something is brewing, And about to begin!
A b s t r a c t
• Motivation: Neuroplasticity is the brain’s ability to change across it’s lifespan. These changes may occur due to genetics or the environment that each person is brought up into. Understanding how behavioural changes can enhance cognition may help delay the manifestations of disorders associated with neurodegenerative or neu-ropsychiatric conditions.
• Hypothesis: For this study we hypothesized that individuals who spend their lives training to excel in a specific activity will present an enhanced cognition in old age compared to a sedentary lifestyle.
• Experimental Procedure: In order to better understand how specific lifestyle activi-ties have an impact on cognition, a comparison between four groups of people over the age of 60 was made. Expert musicians, meditators and athletes were compared to a group of people that led a sedentary lifestyle. Questionnaires were presented to withdraw demographic information, IQ and scores regarding their health and well-being. Brain wave activity and behavioural components were assessed using an electroencephalogram and tasks such as the Go/No-Go, the Short-Term Memory test, the Colour Search task and Resting State was recorded and analyzed.
• Results: The overall results show that the meditation group excelled at attention tasks, whereas musicians and athletes tended towards higher inhibitory component. Entropy measurements were carried out and showed that higher values across all times scales were linked to expert groups, possibly translating in a higher amount of available brain resources, when compared to people who follow sedentary patterns.
R e s u m o
• Motivação: Plasticidade cerebral é a capacidade de o cérebro se alterar ao longo da vida. Estas alterações podem ocorrer devido a caraterísticas genéticas ou de-vido ao envolvente em que a pessoa se encontra (e com que cresceu). Compreender de que modo alterações comportamentais estimulam a cognição pode retardar as manifestações de patologias associadas a condições neurodegenerativas ou neurop-siquiátricas.
• Hipótese: Propomos como hipótese que as pessoas que dedicam grande parte das suas vidas focadas numa atividade específica, apresentarão uma cognição fortale-cida em idades mais avançadas, quando comparados com aqueles que levam uma vida sedentária.
• Processo Experimental: Foi realizada uma comparação entre quatro grupos, com participantes de idades superiores a 60 anos. Indivíduos especializados em música, meditação e desporto foram comparadas com pessoas que possuem um estilo de vida sedentário. Para além das informações demográficas, QI e resultados referentes à saúde e bem-estar, atividade cerebral e componentes comportamentais foram avaliadas usando um eletroencefalograma, e tarefas como o Go/No-Go, testes de memória a curto prazo e de identificação de cor e o estado de repouso do cérebro. • Resultados: Os resultados mostram que o grupo de meditação se destacou nos testes
de atenção, enquanto que o grupo de músicos e de atletas apresentaram um maior componente de inibição. Valores de entropia também foram avaliados revelando que os mais elevados ao longo de todas as escalas temporais estão associados com os grupos especializados, o que possivelmente se traduz numa maior quantidade de recursos disponíveis comparativamente a pessoas que seguem padrões sedentários.
C o n t e n t s
List of Figures xvii
List of Tables xxi
Acronyms xxiii
1 Introduction 1
1.1 Context and Motivation . . . 1
1.2 State of the Art. . . 2
1.3 Objectives and Hypothesis . . . 11
2 Brain Health and Lifestyle 13 2.1 Brain Aging Process . . . 13
2.2 Behavioural Interventions . . . 15
2.2.1 Sedentary Lifestyle . . . 15
2.2.2 Physical Activity . . . 16
2.2.3 Musicianship . . . 17
2.2.4 Meditation . . . 18
3 Tasks and Analyzed Components 21 3.1 Psychological Assessment . . . 21
3.1.1 Ravens Standard Progressive Matrix . . . 21
3.1.2 Health and Well-Being Assessment . . . 22
3.2 Resting State: Entropy . . . 23
3.3 Go/No-Go: N2 and P3 . . . 26
3.4 Colour Search: Behavioural Assessment . . . 30
3.5 Short-Term Memory Test: Behavioural Assessment . . . 31
4 Experimental Procedure 33 4.1 Materials and Methods . . . 33
4.1.1 The EEG System . . . 33
4.1.2 EEGLAB/ERPLAB . . . 35
4.1.3 Presentation . . . 35
5 Results 39
5.1 Data Analysis . . . 39
5.1.1 Psychological Assessment . . . 39
5.1.2 Multi-Scale Entropy. . . 40
5.1.3 ERP Components . . . 41
5.1.4 Colour Search . . . 49
5.1.5 Short-Term Memory. . . 50
6 Discussion and Conclusions 53 6.1 Challenges . . . 59
6.2 Future Directions . . . 60
Bibliography 61
Appendix I - The Electroencephalogram 65
Appendix II - Study Script 69
Appendix III - Binfile Codes 89
L i s t o f F i g u r e s
1.1 Dendric branching deteoration in human entorhinal cortex and hippocampus
(Burke & Barnes, 2006) . . . 3
1.2 Mean longitudinal change for each brain region (Resnik, Pham, Kraut, Zon-derman & Davatzikos, 2003) . . . 4
1.3 (a)-Comparison between the EC of a healthy subject (top) and a subject with AD (bottom); (b)-Two patients with different BRs have the same brain le-sion but different clinical manifestations ((a) - Van Hoesen, Hyman, & Dama-sio,1991; (b) - Stern, 2002) . . . 4
1.4 Diagram explaining the relation between cognitive and neural reserve . . . . 6
1.5 Average of ERP waveforms at Fz, Cz, Pz and Oz, obtained by a Stroop test for young and senior participants (Zurrón et al., 2014) . . . 7
1.6 Mean increase in full-scale IQ for each group (Schellenberg, 2004) . . . 9
1.7 Difference in effect size between sedentary and active in regards to different cognitive processes (Colcombe, Kramer, 2003) . . . 10
2.1 Number of people with AD in 2050 according to census (Hebert, Weuve, Scherr, & Evans, 2013) . . . 13
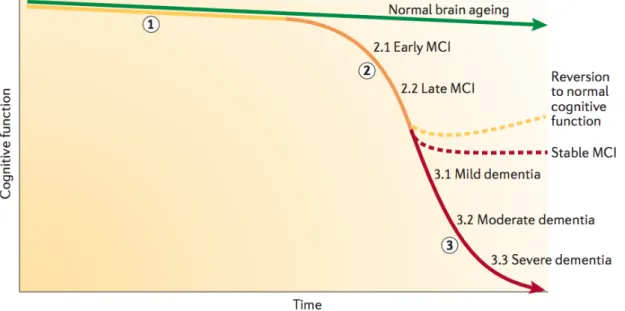
2.2 Normal, with MCI and with dementia decline rate in cognitive function (Ham-pel, H. & Lista, S., 2016) . . . 14
2.3 Difference in effect size between sedentary and active in regards to different cognitive processes (Pontifex, Saliba, Raine, Picchietti, & Hillman, 2013) . . 16
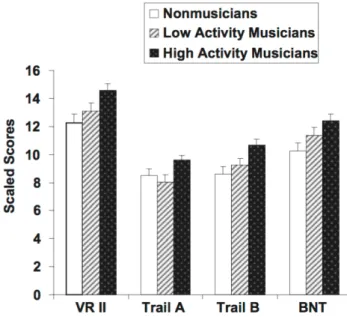
2.4 Relation between non-musicians, low activity musicians and high activity mu-sicians and performance for different cognitive processes. VRII - Visual Repro-duction Delayed Recall; Trails A and B test cognitive flexibility by asking the subject to switch rapidly between numbers and letters; BNT - Boston Naming Test (Hanna-Pladdy, MacKay, 2011) . . . 17
2.5 (a) - Accuracy scores for meditators, age-matched controls, and young controls for T1 target ; (b) - Accuracy scores for meditators, age-matched controls, and young controls for T2 target (Leeuwen, Muller, Melloni, 2009) . . . 18
3.1 Example of an exercise from RSPM . . . 21
3.2 Example of the questions asked in the SF-36 . . . 22
3.4 Comparison of entropy values across different scale factors for random, com-plex and regular systems . . . 23 3.5 Coarse-graining process (Costa et al., 2005) . . . 24 3.6 Sample entropy process (Costa, Goldberger, Peng, Israel, & Medical, 2005) . 25 3.7 Go/No-Go task. (a) - Go trial for 50% of participants; (b) - Go trial for 50% of
participants . . . 26 3.8 Schematic of how an ERP is detected in the scalp (Luck, 2014) . . . 27 3.9 (a)- Plots of two possible signals, where the x axis shows the signal’s strength
and the y axis shows the probability of occurrence of the signal; (b)- receiving-operator characteristics curve in regards to d’ (http://www.cns.nyu.edu/ david/hand-outs/sdt/sdt.html (March 5th, 2018)) . . . 29 3.10 Colour search task presentation . . . 30 3.11 Short-term memory task presentation. (a) - First stimuli presentation;
(b)-Second stimuli presentation . . . 32
4.1 Schematic description of the overall montage, including the EEG setup, the participant and the laptops (for stimuli and raw data visualization) . . . 34 4.2 (a) - Sketch of participant with cap and chin strap on; (b) - Sketch of the
insertion of conductive gel into the cap’s holes. . . 36 4.3 (a) - Sketch of participant with external electrodes and pin-type electrodes
inserted; (b) - Sketch of raw signal being sent from the electrodes to the laptop for quality assessment. . . 37
5.1 MSE results for all groups across different time-scales . . . . 40 5.2 ERP components from Control group at the (a) -Cz electrode, (b) - Fz electrode
and (c) - FCz electrode . . . 41 5.3 Scalp map power distribution for the Control group, for bin 1 (correct go trials)
and bin 3 (correct no-go trials) . . . 42 5.4 ERP components from the Musicians group at the (a) -Cz electrode, (b) - Fz
electrode and (c) - FCz electrode . . . 43 5.5 Scalp map power distribution for the Musicians group, for bin 1 (correct go
trials) and bin 3 (correct no-go trials) . . . 44 5.6 ERP components from Meditators group at the (a) -Cz electrode, (b) - Fz
elec-trode and (c) - FCz elecelec-trode . . . 45 5.7 Scalp map power distribution for the Meditators group, for bin 1 (correct go
trials) and bin 3 (correct no-go trials) . . . 45 5.8 ERP components from Athletes group at the (a) -Cz electrode, (b) - Fz electrode
and (c) - FCz electrode . . . 46 5.9 Scalp map power distribution for the Athletes group, for bin 1 (correct go
L i s t o f F i g u r e s
5.10 Plot of response times, in ms, per number of items presented. The dotted line for the Athletes group represents a single subject . . . 50 6.1 Proportion of population aged 60 years or older, by country, in 2015 (The 2015
Ageing Report, 2015) . . . 54 6.2 Proportion of population aged 60 years or older, by country, 2050 projections
(The 2015 Ageing Report, 2015) . . . 54 6.3 MSE scores for resting state, auditory task and auditory task with counting,
L i s t o f Ta b l e s
1.1 The effect of executive functions (EFs) in different aspects of life (Diamond,
2012) . . . 2
2.1 Studies focused on how sedentarism affects cognition (Falck, Davis, & Liu-ambrose, 2017). . . 15
3.1 Possible outcomes of signal detection theory . . . 29
4.1 Demographic data of subjects that participated in this study . . . 37
5.1 Psychological assessment scores . . . 39
5.2 Accuracy scores over all groups in regards to the Go/No-Go task . . . 47
5.3 Possible outcomes of signal detection theory . . . 48
5.4 d’ table and score for the control group . . . 48
5.5 d’ table and score for the musicians group . . . 48
5.6 d’ table and score for the meditators group . . . 49
5.7 d’ table and score for the athletes group . . . 49
5.8 Median response time, in ms, per number of items presented, and time diff er-ence per added item to the visual field . . . 49
5.9 Short-term Memory test scores for each group, including only the 4 and 6 item display, or the 4, 6 and 8 item display . . . 51
A
BBREVIATIONS
AD Alzheimer’s Disease.
ADHD Attention Deficit Hyperactivity Disorder. Ag/AgCl Silver/Silver Chloride.
BNT Boston Naming Test. BR Brain Reserve.
CNS Central Nervous System.
Cz Midline Central Electrode Location. DC Direct Current.
EC Entorhinal Cortex. EEG Electroencephalogram. EFs Executive Functions. EMG Electroyogram.
ERP Event-Related Potential.
FCz Midline Fronto-Central Electrode Location. Fz Midline Frontal Electrode Location.
GUI Graphic User Interface.
ICA Independent Component Analysis. IQ Intelligence Quotient.
MCI Mild Cognitive Impairment. MSE Multi-Scale Entropy.
P3 Positive Deflection Peaking at About 300 msec After Presentation of Stimulus. PCA Principal Component Analysis.
RSPM Raven’s Standard Progressive Matrix. SF-36 36-Item Short Form Health Survey. SNS Sympathetic Nervous System.
Chapter
1
I n t r o d u c t i o n
1.1 Context and Motivation
Given that the population is getting older and the associated neuropsychiatric disorders increase with age, it is important to better understand how to maintain brain and cog-nitive health in order to prevent cogcog-nitive deterioration. For this reason, it is relevant to “identify and remediate brain and cognitive dysfunction before clinical symptoms manifest and disability develops” (Freitas, Farzan, & Pascual-Leone, 2013).
impact on a person’s life (Moreno & Farzan, 2015).
Aside from observing the brain’s structure and function change over time, we see the brain’s plasticity affected (Stern, 2012). Brain plasticity can be defined “as the ability of the brain to modify itself or be altered by the external environment” (Moreno & Bidelman, 2014). Freitas et al., (2013) indicate that a “functionally normal” brain is a changing brain, a brain whose capacity and mechanisms of change are shifting appropriately from one time-point in life to another”, however, understanding how and why those changes occur may be crucial to develop reliable and adaptable methods to individually assess the mechanisms of brain plasticity.
Table 1.1: The effect of executive functions (EFs) in different aspects of life (Diamond, 2012)
1.2 State of the Art
1 . 2 . S TAT E O F T H E A R T
Contrary to what Brody believed, the loss in most brain areas does not have a mean-ingful role in age-related cognitive decline. Instead, small, specific regional changes in the dendritic branching and spine density are more characteristic of the consequences that age will have on the neural morphology (Burke & Barnes, 2006). In Figure 1.1 it is possible to visualize the physical repercussions of aging, as it compares the dendric branching in the entorhinal cortex and hippocampus of a young subject with an elder subject.
Figure 1.1: Dendric branching deteoration in human entorhinal cortex and hippocampus (Burke & Barnes, 2006)
Figure 1.2: Mean longitudinal change for each brain region (Resnik, Pham, Kraut, Zon-derman & Davatzikos, 2003)
The temporal lobes also suffer some shrinkage, however, different sub-regions of the temporal lobes shrink at different rates. The sub-regions that form the temporal lobes include the entorhinal cortex, the hippocampus and the parahippocampal gyrus. A study from 2005 showed that in healthy adults, the hippocampus showed a substantial atrophy with age (per year after the age of 70), whilst the entorhinal cortex (EC) did not (Raz et al., 2005).These finding are useful to better understand some neurodegenerative diseases, since the entorhinal cortex is one of the regions first affected by Alzheimer’s disease (AD) as seen in Figure 1.3 (a) (Van Hoesen, Hyman, & Damasio, 1991).
(a) (b)
1 . 2 . S TAT E O F T H E A R T
In 1988 Robert Katzman and his team performed a post-mortem examination on 137 seniors whose mental status, memory, and functional status had been previously assessed. They found that even though some people had the same extent of AD pathology as others i.e., visually the atrophy was the same, their manifestation of the disease was completely different.
“These non-demented subjects with Alzheimer changes were functionally and cognitively as intact as those in the control group (. . . ) suggesting that there has been less atrophy than is normally found in the very elderly or that this group of patients started with more neurons and a larger brain and thus had a greater reserve” (Katzman, Terry, Deteresa, & Brown, 1988) This was the first time in literature that the word reserve was used in this context. In other words, the brain’s capacity to function effectively even though having suffered some amount of damage (Stern, 2002). Figure 1.3 (b) represents the concept of brain reserve (BR). Two different patients have different amounts of brain reserve capacity, i.e., even though they have the same brain injury (represented in gray), it will manifest itself differently on both patients, since one will be over the BR threshold and the other one will not.
Researchers later noticed that the brain’s size or number of neurons were not the only contributing factors to an individual’s reserve. In 1999, Stern confirmed what Katzman had previously perceived and introduced a new term: cognitive reserve (Stern, Albert, Tang, & Tsai, 1999). While brain reserve is the brain’s resistance to physical damage (i.e. even though there is damage to the brain, there is still enough brain so that the neuropathological damage will not have an impact on the subject) cognitive reserve is the mind’s resilience to brain damage, meaning that a certain task will be processed using less brain resources, which also means that there is less room for error (Bennett, Arnold, Valenzuela, Brayne, & Schneider, 2014). Stern defines cognitive reserve as “the ability to optimize or maximize performance through differential recruitment of brain networks, which perhaps reflect the use of alternate cognitive strategies” (Stern, 2002). It is postulated that seniors will have a lower risk of dementia if they have a higher cognitive ability or other factors related to cognitive ability which are all connected to cognitive reserve (Whalley, Deary, Appleton, & Starr, 2004).
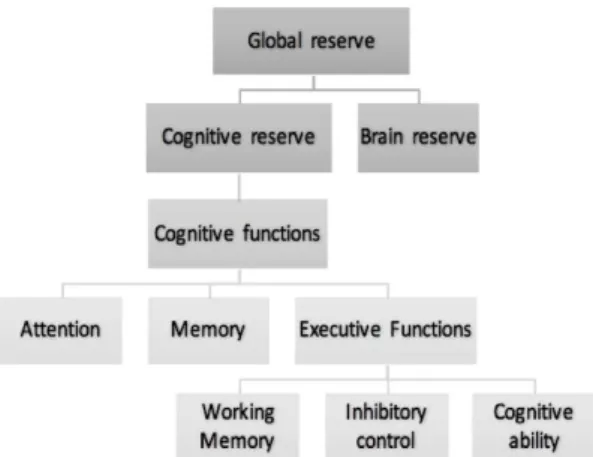
a person’s cognitive functions, and as such, besides a physically larger brain and a larger amount of neurons, these protect from the negative effects of aging and disease on brain function (Satz et al., 1993). In order to better understand how executive functions relate to cognitive reserve, see Figure 1.4 below.
Figure 1.4: Diagram explaining the relation between cognitive and neural reserve
Working memory involves saving information in the mind, and although it is now perceptually there, one can still mentally use it (Diamond, 2012). Evidence from a study presented by Ando, Ono, & Wright (2001) showed that the genetic influences of 236 twins exceeded the environmental influences and that the effects were considerable for both working memory and cognitive ability. Swan & Carmelli (2002) quantified the genetic influence stating that 79% of the EFs can be explained by genetics. Reinvang et al., (2010) showed that there is a substantial heritable component for cognitive functions, and that even though the heritability varies from one cognitive domain to another, it is one of the main contributors to certain cognitive phenotypes. (Reinvang et al., 2010).
1 . 2 . S TAT E O F T H E A R T
In 2009, vocabulary knowledge and years of education were found to be related to levels of cognitive functioning. This suggests that cognitive reserve reflects the insistence of earlier distinctions in cognitive functioning rather than different rates of age-related cognitive reduction. These benefits seem to be persevered throughout the lifespan and therefore serve as a shield against functional impairment, having, for that reason, signif-icant implications for everyday functioning in later life (Tucker-Drob, Johnson, & Jones, 2009). Other studies report strong evidence that higher-level education result in a signifi-cant reduction in the occurrence of dementia (e.g. Meng & D’Arcy, 2012).
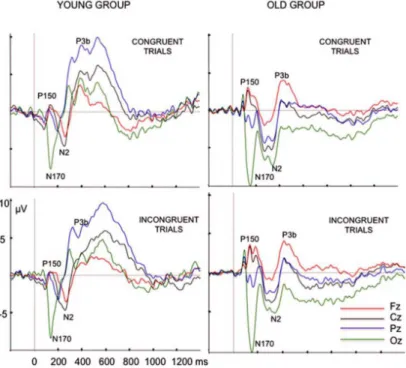
Despite the clear difference between brain reserve and cognitive reserve previously described, and the various ways through which the brain is influenced by them, both make independent and synergistic contributions to an individual’s resistance to brain pathology (Stern, 2012). It is important, however, to bear in mind that neither cognitive reserve, nor brain reserve prevent AD or dementia from appearing, it is, however, protective of the clinical manifestations of the disease. Other interesting findings observe that particular brain waves Event-Related Potentials (ERPs) such as N2 and P3 also change across the lifespan. For instance, Zurrón, Lindín, Galdo-Alvarez, & Díaz (2014) compared the brain waves of a group of young people and compared them to the brain waves of seniors while performing a Stroop test as shown in Figure 1.5
Figure 1.5: Average of ERP waveforms at Fz, Cz, Pz and Oz, obtained by a Stroop test for young and senior participants (Zurrón et al., 2014)
are considered to be most present when presented with a stimulus in working memory (Folstein & Van Petten, 2008). Since they hypothesized that the cognitive process of the evaluation and categorization of the colour and word were slower in older participants, these results came to support their theory (Zurrón et al., 2014). Additionally, information obtained from Figure 1.5 show that the P3 amplitude at Pz was larger in the younger group. The reduction in the P3 wave amplitude in the elderly in oddball tasks is a consequence of the aging process. Walhovd, Rosquist, & Fjell (2008) believe that this results from a reduction in the neural resources allocated to the process of categorization of the target stimuli with age. As for the N2 amplitude, this was smaller in older subjects for incongruent stimuli (Zurrón et al., 2014). The N2 deflection appears when a repetitive, non-target stimulus occurs, whilst a P3 wave will appear in the presence of an unexpected or surprising stimulus (Luck, 2014). See Appendix I for details on electrode location and information as to how the electroencephalogram (EEG) works.
More recently, researchers are focused on understanding how some executive func-tions and other cognitive skills can be improved (Moreno & Farzan, 2015). Compre-hending what one can learn or do in order to delay the appearance of a neurological disorder, would have a significant impact. Despite the lack of more in-depth research, activities such as music, meditation and exercise are thought to bring certain advantages in neuroplasticity and inhibitory control, where neuroplasticity is defined as the brain’s aptitude to adapt to environmental factors that cannot be anticipated by genetic program-ming (Münte, Altenmüller, & Jäncke, 2002). Diamond, (2012) defines inhibitory control as “the ability to control one’s attention, behaviour, thoughts or emotions to override a strong internal predisposition or external lure, and instead do what’s more appropriate or needed”. These three types of activities have shown to have an important impact on cognitive development.
1 . 2 . S TAT E O F T H E A R T
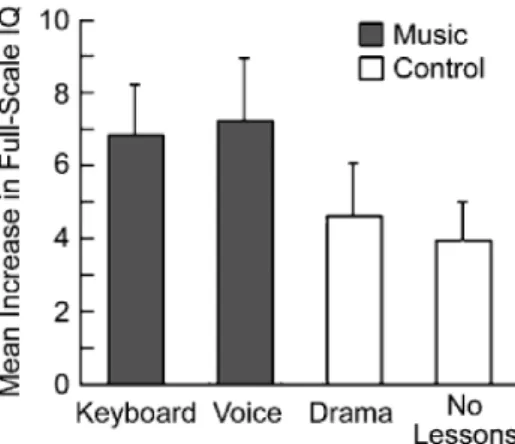
Figure 1.6: Mean increase in full-scale IQ for each group (Schellenberg, 2004)
Later in 2011, Schellenberg looked to better comprehend the link between music lessons and intelligence, and understand if this was mediated by executive functions. This study compared children ages 9-12, with at least two years of music training with children of the same age group who had no musical experience. The results of the study showed that the IQ scores and performance on EF tasks were correlated and that musician children had higher IQ scores than the non-musician group. However, the connection between musical training and EFs was small, and there was no evidence that the link between music training and intelligence was mediated by EFs (Schellenberg, 2011).
hypercortisolemia on hippocampal atrophy. Furthermore, the authors consider that med-itation may enhance the brain-derived neurotrophic factor which when in reduced levels has been linked to depression and dementia.
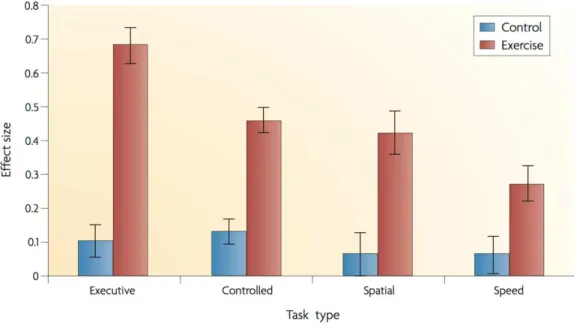
Convergent evidence shows that physical activity improves neuroplasticity, certain brain structures and as a consequence, cognitive functions (Hötting & Röder, 2013). Kramer et al., (1999) compared aerobic exercise with stretching training and observed that the first requires a higher degree of executive control. Colcombe & Kramer, (2003) later confirmed that aerobic exercise had a bigger impact on executive functions and tasks that required cognitive control as shown in Figure 1.7. They add that “the present results, along with the extant animal literature, suggest that fitness training can also enhance cognitive vitality of older adults”. After analysing the neuroimages of people over the age of 53, Colcombe et al., (2004) were able to establish that functional brain activation indeed changed in the frontal brain regions after a few months of aerobic exer-cise. They concluded that increased cardiovascular fitness can decrease the decline rate of brain plasticity with age and may serve to decrease biological and cognitive senescence in humans.
Figure 1.7: Difference in effect size between sedentary and active in regards to different cognitive processes (Colcombe, Kramer, 2003)
1 . 3 . O B J E C T I V E S A N D H Y P O T H E S I S
memory functions, accommodated by local grey matter volume and neurotrophic factors. Physical activity has been shown to have a positive effect on patients with dementia by preventing or delaying memory decline (Intlekofer & Cotman, 2013), and those with AD. Although physical activity “can significantly improve hippocampal function to a degree even with advancing age and disease”, this is a topic in need of further research. Since the beneficial effects of physical exercise have shown to have a positive outcome on executive functions and frontal brain regions, it is important that research on this field continues to develop (Hötting & Röder, 2013).
The aim of this work is to better understand the influences that the research previously described have on age-related cognitive decline, specifically if and how they lead to a greater inhibitory control, working memory, attention and entropy in older adults. In the following sections, we will carry out a case study involving four groups of senior citizens (> 60 y.o.), musicians, athletes, meditators and controls, with the purpose of better understanding the influence that each type of activity has on the brain’s plasticity and cognition. In the long-term, this and similar studies will help understand how to decrease the number of cognitive impairments and neurodegenerative diseases which include dementia and AD.
1.3 Objectives and Hypothesis
As mentioned, the aim of this project is to investigate if specific lifetime-acquired exper-tise can protect against age-related cognitive decline. Specifically, we will carry out a pilot study to assess if skills in music, physical activity and meditation leads to superior inhibitory control, working memory, attention and entropy in the elderly. This will be assessed using a standard Go/No-Go task, a short-term memory test, a colour search task and by assessing resting state data (brain activity at a state of relaxation), respectively. Brain electrical responses will be measured using and EEG, and changes will be measured at the entropy level for different time-scales and in event-related components, including the N2 and P3 components.
Participants will be over the age of 60 and all groups will be have similar degrees of education and IQ. Expertise levels amongst musicians, athletes and meditators will be equivalent, but to do so, the eligibility criteria will have to differ slightly. In addition to the cognitive assessments previously mentioned, an IQ test and a health and well-being questionnaire will also be included. We will start by comparing all groups with the control group, and subsequently analyze the results in between the experts.
Hypothesis:Lifestyle activities lead to enhanced cognition in old age compared to a sedentary lifestyle.
• Sub-hypothesis: Expert groups will score better on all tests and tasks, including the health and well-being questionnaire;
• Sub-hypothesis: Meditators will perform better in attention tasks;
• Sub-hypothesis: Expert groups will have similar N2 but higher P3 when compared to controls;
Chapter
2
B r a i n H e a lt h a n d L i f e s t y l e
2.1 Brain Aging Process
Figure 2.1: Number of people with AD in 2050 according to census (Hebert, Weuve, Scherr, & Evans, 2013)
Most of the existing studies have focused on the pathologies associated to aging, such as mild cognitive impairments, de-mentia, Alzheimer’s or Parkinson’s dis-ease, etc. There are few studies that fo-cus on the healthy brain aging, i.e., brain changes that occur in the absence of neu-rodegenerative or neuropsychological dis-eases, nevertheless, existent research sug-gests that the aging process is paired with several structural, chemical and func-tional changes in the brain, including cog-nitive alterations. Fig 2.1 was created based on the results from the United States 2010 census, and it shows that it is pre-dicted that by the year of 2050, the num-ber of people with AD will triple. A rea-sons for this might be that due to the baby boom that occurred between the 40s and the 60s there are now more people over the the age of 65 than under the age of 15 in Canada (Christie et al., 2017).
the myelinated axons connecting the neurons of the cerebral cortex to each other and the periphery. (Kramer & Madden, 2008)
As mentioned in the first chapter and focusing on gray matter alterations, studies have shown that there are changes in whole brain volume as a function of aging (Raz et al., 2005). These changes are not linear, however, they become steeper in older ages. Age-related atrophy differs between brain regions, with the frontal lobe being the region that shows the steepest rate of atrophy, with an average decline between 0.9% and 1.5% per year (Dennis & Cabeza, 2008). The decline rate for parietal lobes have the second steepest rate with an annual rate between 0.3% and 0.9% (Pfefferbaum, Sullivan, Rosenbloom, Mathalon, & Lim, 1998).
Figure 2.2: Normal, with MCI and with dementia decline rate in cognitive function (Hampel, H. & Lista, S., 2016)
The decline rate by which different brain regions shrink differs slightly between young adults and older adults, however, these changes are not outrageously big. When you add to this normal brain aging, mild-cognitive impairments (MCI), the decline rate by which the brain is altered increases drastically, when neurodegenerative and neuropsychiatric disorders come into place, the decline rate increases even more as can be seen in Fig. 2.2. This figure aims to represent the changes of cognitive function over time, starting at the point in time where cognition is at it’s peak (which happens between the ages of 25 to 29).
2 . 2 . B E H AV I O U R A L I N T E RV E N T I O N S
Every person is different, and as explained in the previous chapter, two people with similar lifestyles can respond differently to the same neurodegenerative/neuropsychiatric disorder. Reasons for this are the person’s genetic, or the environment he/she has been exposed to (in which the behavioural activities are included).
2.2 Behavioural Interventions
2.2.1 Sedentary Lifestyle
Research has shown that sedentary behaviour is linked to lower cognitive function. The table below (Table 2.1) is from a review article regarding the impact of sedentarism in cognition, and the presented studies are just some of the mentioned in Falck, Davis, & Liu-ambrose, (2017). The overall results across all studies is that sedentary behaviour is associated with a decrease in executive function, and with an increase of risk in de-veloping dementia. An interesting conclusion is that the findings suggest that reducing sedentary time to less than two hours per day and engaging in just 150 minutes per week of physical activity is enough to help promote healthy cognitive aging.
Table 2.1: Studies focused on how sedentarism affects cognition (Falck, Davis, & Liu-ambrose, 2017)
group of sedentary mice. The active group was kept in a cage with ropes and spinning wheels which the mice used frequently, whereas the sedentary group had nothing in the cage that would promote them to be active. After 3 months, the mice’s neurons were injected with a dye. What was concluded from this study is that even though the actives group’s neurons remained practically the same, the sedentary group had overly branched neurons which were affecting the sympathetic nervous system (SNS) (the part of the nervous system that controls the fight or flight response) making them more sensitive to stimuli. An overly responsive SNS can result in confusing messages to the brain that can lead to serious health problems such as heart attacks or aneurisms, Mischel, Llewellyn-Smith, Mueller (2014)
2.2.2 Physical Activity
While exercising, besides all the health benefits which include decreased risk of stroke, high blood pressure and diabetes, our brain releases endorphins. These hormones control pain and pleasure responses in the Central Nervous System (CNS) and are linked to improving focus and memory. Increased aerobic exercise can also enhance the creation of new hippocampal neurons and make them last longer.
In fact, studies have shown that there is a significant effect of cardiorespiratory fitness in the brain size (Firth et al., 2018). Specifically, people who exercise have shown to increase the hippocampal volume both in young adults but also in older adults. Animal studies have supported the theory that aerobic exercise doesn’t help grow the hippocam-pus, but it prevents the usual decrease in neurogenesis (the process by which new neurons are formed in the brain) associated with aging and therefore resulting in greater retention of neural matter.
Figure 2.3: Difference in effect size between sedentary and active in regards to different cognitive processes (Pontifex, Saliba, Raine, Picchietti, & Hillman, 2013)
2 . 2 . B E H AV I O U R A L I N T E RV E N T I O N S
performed worse than controls, after doing aerobic exercise the amount by which their accuracy improved was higher than for the matching controls. (Pontifex, Saliba, Raine, Picchietti, & Hillman, 2013)
Alongside the vast benefits for metabolic risk and physical and mental health, aerobic exercise has shown to be suitable for promoting healthy aging, in order to maintain both physical and neurological functioning (Silveira, Roy, & Almeida, 2018).
2.2.3 Musicianship
While reading or solving math problems each activate their own specific brain area, listen-ing to music activates multiple brain areas. It includes processlisten-ing sound, melody, rhythm at very fast rates. When playing an instrument practically every area of your brain is activated. A lot more information is being processed, coming from the visual, auditory and motor cortices (Christie et al., 2017).
Motor skills, which are used when playing an instrument, are controlled by both hemispheres, which allows signals to get across the brain faster and through more diverse paths and it also reinforces the sharing of information of both hemispheres, plus playing music has also been linked to an increase in activity and volume in the brain’s corpus callosum (the bridge between both hemispheres).
Figure 2.4: Relation between non-musicians, low activity musicians and high activity musicians and performance for different cognitive processes. VRII - Visual Reproduction Delayed Recall; Trails A and B test cognitive flexibility by asking the subject to switch rapidly between numbers and letters; BNT - Boston Naming Test (Hanna-Pladdy, MacKay, 2011)
reveal that there are significant differences between high activity musicians and non-musicians on measures of naming, nonverbal memory recall, motor speed, visuo-motor sequencing, and cognitive flexibility. It also shows that there is somewhat of a lin-ear relation between ylin-ears of musical experience and cognitive function (Hanna-Pladdy, MacKay, 2011).
As shown, musicians tend to have higher levels of executive function, excelling at plan-ning, strategizing and attention to detail. They also exhibit enhanced memory function, creativity, soring and retrieving memories faster and more efficiently than non-musicians, both in young adults and older adults.
2.2.4 Meditation
Studies show that brain regions associated with attention, interoception and sensory processing had a greater volume in meditation participants than matched controls, sug-gesting that this activity can counteract age-related cortical thinning (Lazar, et al, 2005). Research has also shown that meditation can increase the density and volume of the hippocampus, an important brain area fundamental for memory. Moreover, while the brain area responsible for sustaining attention tends to shrink throughout the lifespan, meditation seems to contradict this decay.
(a) (b)
Figure 2.5: (a) - Accuracy scores for meditators, age-matched controls, and young controls for T1 target ; (b) - Accuracy scores for meditators, age-matched controls, and young controls for T2 target (Leeuwen, Muller, Melloni, 2009)
2 . 2 . B E H AV I O U R A L I N T E RV E N T I O N S
were sequentially presented amongst the letters (T1 and T2), and the participants task was to identify both T1 and T2.
Chapter
3
Ta s k s a n d A n a ly z e d C o m p o n e n t s
When building the pipeline for the study, it was important for us to use well-known and robust tasks such as the Go/No-Go and resting state and add less common tasks that would give us novel information that would help answer our hypothesis such as the Colour Search and the Short-Term Memory task.
3.1 Psychological Assessment
3.1.1 Ravens Standard Progressive Matrix
Figure 3.1: Example of an exercise from RSPM
The Ravens Standard Progressive Matrix (RSPM) is an IQ test where the subject is asked to choose from the options, the one that completes the pat-terns presented, both vertically and horizontally (Fig. 3.1). The subject is asked to do this as fast but as accurately as he/she can within 1 min.
3.1.2 Health and Well-Being Assessment
The Health and Well-Being Assessment, also known as the 36-Item Short Form Health Survey (SF-36) is an 11 question survey that asks for the participant’s views on his/her health (Fig. 3.2). This information was asked to help understand how the subject feels and how well he/she is able to do usual activities.
Figure 3.2: Example of the questions asked in the SF-36
3 . 2 . R E S T I N G S TAT E : E N T R O P Y
3.2 Resting State: Entropy
Resting state data is collected by asking the participant to sit as still as possible for 5 minutes, while staring at a fixation cross (Fig. 3.3). It was asked that the participant would not move or blink too often. This data allows us to do an entropy assessment.
+
Figure 3.3: Presentation of fixation-cross for resting state data collection
Entropy values give important information regarding the degree of underlying ran-domness of a random variable. These random variables with small entropy levels have a high level of predictability. On the other hand, large entropy values correspond to low levels of predictability and therefore high levels of randomness. Due to the interactions of the many neural networks that operate over a wide range of spatial and temporal scales, the brain is considered a complex system.
Figure 3.4: Comparison of entropy val-ues across different scale factors for random, complex and regular systems
Studies have shown that variations and variability observed in biological signals have a crucial role in shaping the brain’s capacity for information processing. (Costa, Goldberg. & Peng, 2005; Sporns, Tononi, & Edelman, 2000). The less recurring temporal patterns are, the more complex and unpredictable the signal is. In the brain, the complexity of signals at fine and coarse timescales (smaller and larger time increments respectively) refer to increases and decreases in correlated activity among local and distributed brain regions, promoting the integration and segregation of information at different spatio-temporal scales (Sporns et al., 2000; McIntosh et al., 2014; Farzan et al., 2017).
Specifically, the brain-based measurement technique used in this study is the Multi-Scale Entropy (MSE) to quantify the change in complexity across multiple time-scales (Farzan et al.,2017). This novel technique is gaining emphasis amongst the research community because, when compared to the commonly used Power Spectral Analysis, it has the advantage of examining long-range temporal dynamics and being more localized to specific brain regions.
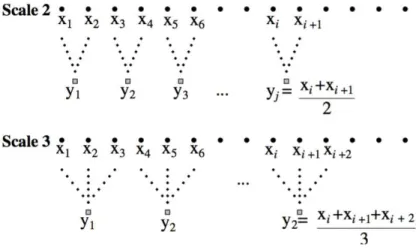
Coarse-Graining
Given a specific time series{x1, x2, . . . , xN}, several coarse-grained time series are
cre-ated by averaging each data point with non-overlapping windows of increasing length
τ. As can be seen in Fig. 3.5. the coarse-graining process, includes an average of 2, 3,
4, ..., N, data points, depending on which scale factor is being used. A scale factor of 1 represents the original time-series.
Figure 3.5: Coarse-graining process (Costa et al., 2005)
Each element of the coarse-grained time seriesyj(τ), was calculated according to the equation:
yj(τ)=1
τ jτ X
i=(j 1)τ+1
3 . 2 . R E S T I N G S TAT E : E N T R O P Y
whereτ represents the scale factor and 1j N /τ. The length of each coarse-grained
time series is N /τ. For the scale factor of τ = 1, the coarse-grained time series is the
original time series.
Sample Entropy
Sample entropy is calculated for each of the multiple coarse-grained time series, and then plotted as a function of the scale factor. This stage is referred to as a “regularity statis-tic” because it looks for patterns in a time series{y1(τ), y2(τ), . . . , yN(τ)}and aims to quantify its degree of predictability (Fig. 3.6).
As can be seen in Fig. 3.6. the first step in calculating the sample entropy is to compare a single data point at a time. Looking at u[1], which is the first data point, we can observe the range factor (r), which is represented by the dotted line immediately above and below u[1] (this is a similarity range in which we will look for other data points). Note that each colour represents the points that fall into the same similarity criterion. Therefore assessing the plot, we can find four data points that are similar to u[1] (all five data points represented in green). Looking at u[2], we can also find four similar data points that are included in the range limit (in red). The next step is to compare two data points at each time. So instead of looking solely at u[1] or u[2], we look at u[1] & u[2] together. Looking at the plot, we find two sets of data points similar to u[1] & u[2], which are u[13] & u[14] and u[43] & u[44] (all the green-red sequences). Similarly we repeat the process for data points u[2] & u[3] and we find 1 set of similar data points which are u[44] & u[45], and so on (all the red-blue). The same process is repeated for 3, 4, 5, ..., N, sequential data points.
Figure 3.6: Sample entropy process (Costa, Goldberger, Peng, Israel, & Medical, 2005)
Sample entropy is calculated according to the equation:
SamEn(r, m, M) = ln C(m+ 1)
C(m)
!
whereC(m) is the total number of pairs ofmconsecutive similar data points andC(m+ 1) is the total number of pairs of m+ 1 consecutive similar data points in the multiple coarse-grained time series. The time series predictability is calculated by quantifying its amplitude variability patterns.
Based on previous studies using this MSE technique, two consecutive data points were used for data matching (i.e.m= 2) and data points were considered to match if their absolute amplitude difference was<15% (i.e. r= 0.15) of the standard deviation of the time series. MSE was calculated for 30 second continuous epochs (Farzan et al., 2017).
3.3 Go/No-Go: N2 and P3
The Go/No-Go task is a well-known task due to it’s simplicity and good neurofeedback. The purpose of this task is to assess the individuals efficiency of response inhibition. It specifically measures the participant’s capacity for sustained attention and response control. Despite the several possible adaptations, it consists mainly of the presentation of two different stimuli where the participants are required to either respond (i.e., pressing a designated key) or withhold a response (not pressing designated key) depending on whether a go stimulus or a no-go stimulus is presented (Fig.3.7.).
Per trial, the go stimuli is presented 80% of the time, making it harder to predict the no-go stimuli. This task was colour balanced, meaning that for some participants the go-stimuli was the no-go stimuli for other participants. This ensures that the colour of the stimuli is not the driving cause for the impulse suppression. For half of the participants the go trials would be the stimuli presented in Fig. 3.7 (a), and the no-go trials would be the stimuli presented in Fig. 3.7 (b), and the opposite for the other half of the participants.
(a) (b)
Figure 3.7: Go/No-Go task. (a) - Go trial for 50% of participants; (b) - Go trial for 50% of participants
3 . 3 . G O / N O - G O : N 2 A N D P 3
as the go trial stimulus in the Go/No-Go task performed by our subjects, that appeared 80% of the time. This ERP is strongly related to response inhibition, which is one effect that this study aims to better understand. The P3 ERP waveform is elicited by unexpected stimuli, and therefore is greater in the no-go trials that occur 20% of the time.
ERPs, or Event-Related Potentials are brain responses that result from the specific sensory, cognitive or motor events. Voltages, that increase when neurotransmitters bind to the receptors on the membrane of the postsynaptic cell, cause ion channels to open. This leads to a change in gradient in voltage across the membrane and are referred to as
Postsynaptic Potential. When these neurotransmitters are released and emit voltage spikes, they are calledAction Potentials(Luck, 2014).
If an excitatory neurotransmitter is released at the apical dendrite of a cortical pyra-midal cell, an electric current (in form of positively charged ions) will flow from the extracellular space into the cell, creating a net negativity on the outside of the cell in the region of the apical dendrites. Current will also flow out of the cell body and basal dendrites, creating a net positivity in this area. This continuous flow of current creates a small dipole. The dipole from a single neuron is too small to be detected by scalp elec-trodes, however, the dipoles from many neurons will sum together, making it possible to measure the resulting voltage at the scalp (also known as ERPs).
Figure 3.8: Schematic of how an ERP is detected in the scalp (Luck, 2014)
be able to pick up a certain percentage of voltage from any source generator present in the brain (represented by C1, C2 and C3). The percentage of the signal that will be detected by the scalp electrode will depend on the location and orientation of the source generator, and will also depend on how conductive the tissues the signal will have to cross until it reaches the electrode, are. Based on how that signal is directed, the voltage received by the electrode will either be positive or negative, altering the overall captured signal the same way. The table present in the same Figure, shows hypothetical weights (w[x,y]) from each component to each electrode. The bottom part of the Figure shows the source waveform at each generator location for each component, so at each electrode E[N], we will have a sum of all components with their specific weights, having therefore E1 = w[1,1]C1+ w[2,1]C2+ w[3,1]C3 ; E2 = w[1,2]C1+ w[2,2]C2+ w[3,2]C3 and E3 = w[1,3]C1+ w[2,3]C2+ w[3,3]C3 (Luck, 2014).
In theory, knowing all these variables, it should be possible to extract each component from each specific site. However, knowing the weight for each component and how many components are influencing the electrode’s signal is not possible, and so by analyzing the signal at the electrodes, we are in fact analyzing a mixture of components and resulting in assumptions that depend on the technique being used to separate these components.
Examples of procedures used to separate signal components are dipole localization methods, PCA (principal component analysis), ICA (independent component analysis), Fourier analysis and time-frequency analysis. Each come with different assumptions that have to be made. For instance, the Fourier assumes that the basis functions are sine waves, in contrast, dipole localization methods assume that the scalp distribution reflects the conductivity of the brain, skull, and scalp.
For this study, ICA was used. The goal of ICA is to find an unmixing matrix that will allow a visualization of the waveform from the scalp electrodes and calculate the time courses of the underlying components. To do so, ICA uses the statistical properties of the observed EEG data to create this unmixing matrix. ICA uses a learning algorithm that leads to the components that are maximally independent and therefore can be rejected.
• d’ Prime Evaluation
3 . 3 . G O / N O - G O : N 2 A N D P 3
(a) (b)
Figure 3.9: (a)- Plots of two possible signals, where the x axis shows the signal’s strength and the y axis shows the probability of occurrence of the signal; (b)- receiving-operator characteristics curve in regards to d’ (http://www.cns.nyu.edu/ david/handout-s/sdt/sdt.html (March 5th, 2018))
It was initially created for radar operators, to help them understand whether the signal that appeared on screen was either a plane or a flock of birds. Looking at Fig. 3.9 (a) and interpreting the right positive deflection as the probability of it being an airplane and the left positive deflection as the probability of it being a bird, it is easy to understand that the overlapping area might make it hard for the radar operator to know what is indeed entering the proximities.
Depending on the type of signal and the type of response, there are four possible outcomes shown on Table 3.1.
Signal/Response Yes No
Yes Hits Misses
No False Alarms Correct Rejections
Table 3.1: Possible outcomes of signal detection theory
liberal criteria and mark more planes as birds (increasing the number of misses). This assessment was made for the Go/No-Go task in order to asses each groups d’, which refers to the distance between the means of distributions, scaled by standard deviation. Looking at Fig. 3.9 (b) it is easy to understand that the groups that score higher d’ values are more likely to have higher hit rates than false-alarm rates, meaning that the groups with higher d’ have are better at finding an adequate criteria response.
The d’ is calculated by subtracting the z-transforms of the false alarm rates to the z-transforms of the hit rates as indicated in Equation 3.3. Equation 3.4 is the formula used in excel to calculate the d’ values.
d0 = z(0.8⇤H) z(0.2⇤FA) (3.3)
d0 = N ORMSI N V(0.8⇤H) N ORMSI N V(0.2⇤FA) (3.4)
3.4 Colour Search: Behavioural Assessment
The Colour Search task is a behavioural experiment. In this experiment, the participants were shown either 4, 6, 8 or 10 circles, all different colors (Fig. 3.10). The goal of this task was to find either the green circle or the red circle, without moving their eyes from the fixation cross. Once they’d do so, they would have to assess weather the bar inside the circle was either vertically oriented or horizontally oriented. They press a "yes"button or a "no"button depending on what they thought. The purpose of the task was to under-stand how easily participants were able to ignore all the unnecessary information (the remaining coloured circles), and focus on the green and red circles.
+
Figure 3.10: Colour search task presentation
3 . 5 . S H O R T-T E R M M E M O RY T E S T: B E H AV I O U R A L A S S E S S M E N T
looking towards a sudden noise) promotes survival and well-being (Anderson, Laurent, & Yantis, 2011a).
The ways through which value and salience might be combined to assess attentional priority can vary. One is that learned value directly alters what is visually important, in-creasing the significance of reward-associated stimulus, thereby inin-creasing the attentional priority. However, the time required to disengage attention after the stimuli has been captured is longer after that stimuli has been attributed with value (Anderson, Laurent, & Yantis, 2011b)
Studies show that a physically salient, task-irrelevant distractor previously linked to a greater reward slows the visual search more than an equally salient distractor previously associated with a smaller reward (Anderson, Laurent, & Yantis, 2011b). Previous studies also showed that the individual differences in visual working memory capacity may reflect a variation in a general ability to resist distraction. Furthermore, studies that included some sort of reward after a correct answer have shown that value-driven attentional capture is thought to play an important part in several clinical syndromes in which attention and reward are severely implicated. These syndromes include drug addiction, obesity, ADHD, and obsessive compulsive disorder (Anderson, Laurent, & Yantis, 2011a).
3.5 Short-Term Memory Test: Behavioural Assessment
+
(a)
+
(b)
Figure 3.11: Short-term memory task presentation. (a) - First stimuli presentation; (b)-Second stimuli presentation
The capacity of visual short-term memory is very limited, maintaining only three to four objects simultaneously for young adults. This limitation needs efficient mechanisms to select only the most relevant objects from the environment to be stored in memory and to stop irrelevant items from consuming capacity (E. K. Vogel, Mccollough, & Machizawa, 2005).
Studies show that there are individual -specific characteristics in the ability to control what is stored in memory at any given moment. These individual differences in memory capacity might not only reflect the variability in free storage capacity, but might also indicate the efficiency with which the available space is allocated. A person’s specific memory capacity does not always reflect on the number of objects that can be stores in memory, but also the efficiency by which the individual is excluding irrelevant informa-tion. Animal research has shown that the prefrontal cortex has an extremely important role in understanding which information is relevant to be kept in memory (E. K. Vogel, Mccollough, & Machizawa, 2005).
Chapter
4
E x p e r i m e n t a l P r o c e d u r e
4.1 Materials and Methods
4.1.1 The EEG System
The EEG system used was the BioSemi Active Two with a sampling rate of 512Hz. The BioSemi is an EEG system acquisition device that allows a visualization of the brain’s electrical signal while recording it. This features allows for a rapid understanding of whether there is or not a bad connection and to fix it if necessary. A 64 electrode cap was used, and in addition to the CMS and DRL electrode (Common Mode Sense and Driven Right Leg, respectively) and 4 external electrodes (one electrode on each temple to track muscle/eye movement and one electrode on each mastoid to be used as reference). This portable EEG system allowed that the collection process occurred at a location of the participant’s preference. In order for each experience to be the most similar between participants and to minimize the chance of errors, a script was produced (See in Appendix II), with a comprehensive explanation as what to do and what to say.
1 2
3
4.1
4.2
Figure 4.1: Schematic description of the overall montage, including the EEG setup, the participant and the laptops (for stimuli and raw data visualization)
1. The battery-box is the power supply of the AD-box and active electrodes. The battery-box contains a sealed lead-acid battery and a shutdown circuit to prevent the battery from deep discharge.
2. TheAD-boxchannel consists of a low noise direct current (DC) coupled amplifier, with a first order anti-aliasing filter. The digital outputs of all the AD converters are digitally multiplexed and sent to the PC via a single optical fiber without any compression or other form of data reduction.
3. TheUSB receiver converts the optical data coming from the AD-box to an USB2 output. In addition, the USB2 receiver has a trigger port with 16 independent trigger inputs and 16 independent trigger outputs. This setup keeps the complete stimulation setup galvanically isolated from the subject.
4. Theactive electrodesreduce the problems associated with high electrode impedance’s and cable shielding. This is possible due to an integration of the first amplifier stage with a silver/silver chloride (Ag/AgCl) electrode.
4 . 1 . M AT E R I A L S A N D M E T H O D S
4.2 The pin-type active electrodeshave a sintered Ag/AgCl tip, providing very low noise, low offset voltages and very stable DC performance.1
4.1.2 EEGLAB/ERPLAB
EEGLAB is an interactive Matlab toolbox for processing continuous and event-related electrophysiological data. EEGLAB provides an interactive graphic user interface (GUI) allowing users to interactively process EEG data. This toolbox was used to clean the raw EEG data outputted by the BioSemi. Integrated in the EEGLAB toolbox is the ERPLAB toolbox. Besides facilitating the event-related potential analysis, it also includes filters and other tools that are valuable in any EEG data analysis.
Because the BioSemi saves the recorded data as a .bdf file, to upload onto EEGLAB, no changes had to be made. Through EEGLAB, the first step towards a good data analysis is re-referencing and filtering. Initially, the mastoids were used as a reference, however, comparing the mastoids with an average across all electrodes, the latter option showed better results. Both EEGLAB and ERPLAB have filtering tools embedded, yet, the filtering provided by ERPLAB proved to be much faster (and just as efficient) than the filtering from EEGLAB. These two steps were mandatory throughout all of the recordings, and as for the Resting State data this is how far the data preprocessing went.
For the Go/No-Go task however, a few more steps were incorporated. Besides re-referencing, applying a band-pass filter of 1Hz - 30 Hz and removing ICA components twice to ensure ocular artifacts were minimized, an event-related potential analysis was done. Under ERPLAB, binfiles were created (Please see Appendix III for bin file code), epochs were extracted and artifact rejection was implemented on this epoched data. Next, an overall average of the ERPs was computed and plotted for the time frame of the ERPs of interest, specifically the N2 and the P3 (from -200ms to 700ms after the stimuli was presented).
4.1.3 Presentation
Presentation® is a stimulus delivery and experiment control program for neuroscience. Through this program it was possible to code all of the above mentioned tasks, and save the event codes so that the data analysis could be easier, and understood when a stimuli was presented and when a response was given.
The coding language is specific forPresentation, each task was divided into 3 files, the .sce file, the .pcl file and the .exp file. The first file is associated to the design of each figure or background. The second file is related to how the figures act throughout the tasks - the amount of time each figure stays on screen, the randomization, etc. The .exp
file is a file created byPresentationthat allows the user to call the task, that has the .sce and the .pcl files embeded.
4.2 The Collection Process
Once at the location, the experimental procedure would be explained to the participant, as it is presented in the scrip (Appendix II). First, the participant would have to sign a consent form explaining all tasks in detail, that they were free to withdraw at any moment, that it was an anonymous study and that no personal information was going to be shared or made possible to trace back. After that, a few questions were asked for the health and well-being assessment following an IQ test. Once the EEG system was setup, the subject would be equipped.
(a) (b)
Figure 4.2: (a) - Sketch of participant with cap and chin strap on; (b) - Sketch of the insertion of conductive gel into the cap’s holes
Measurements of the head’s circumference were taken (from the nasion to the inion) in order to know which cap size the participant would require. Next, the skin would be abrased so that the external electrodes would have better contact with the skin.
Four external electrodes were placed (one on each temple and one on each mastoid) and then the cap was placed on the head, secured with a chin strap (Fig.4.2(a)). Con-ductive gel was inserted into each cavity (Fig.4.2(b)) followed by the insertion of the pin-type electrodes (Fig.4.3(a)). Once everything was complete, the EEG system was used for a real-time visualization of the brain’s electrical signal to help correct possible bad connection flaws before beginning with data recording. (Fig.4.3 (b)). 2
4 . 2 . T H E CO L L E C T I O N P R O C E S S
(a) (b)
Figure 4.3: (a) - Sketch of participant with external electrodes and pin-type electrodes inserted; (b) - Sketch of raw signal being sent from the electrodes to the laptop for quality assessment
Participants
Overall, 18 people were tested (four of whom were males). Four individuals were initially used to validate the entire pipeline and later added to the control group. Because some of the tasks changed between the test subjects and the actual participants, the number of subjects per task varies; for this reason, this number will be presented before explaining the results for each task. The table below shows the demographic data.
— Subjects Age Range Post-Sec Education Controls 10 (8F) [63 ; 84] 6
Musicians 4 (2F) [68 ; 76] 2 Meditators 2 (2F) [69 ; 79] 2
Athletes 2 (2F) [68 ; 79] 1
Table 4.1: Demographic data of subjects that participated in this study
Besides the information from Table 4.1., we only considered subjects that were mono-lingual. Chirality and level of expertise with each of the activities that this study ad-dressed was additionally collected.
Chapter
5
R e s u lt s
5.1 Data Analysis
5.1.1 Psychological Assessment
Before equipping the participants with the EEG system, we asked them to complete two questionnaires. Table 5.1 presents the mean scores of each group in regards to those questionnaires, the RPM and the SF-36. The RPM scores refer to the number of correct answers over the number of answered questions. The control group scored an average of 6.17 correct answers, and answered an average of 7.33 questions in 1 minute. Similarly, the musicians group scored an average of 6 correct questions over a total of 7 answered questions in 1 minute. The meditators group scored an average of 7.5 correct answers, and answered an average of 9.5 questions in 1 minute and finally the athletes group ansered correctly to 6 of the presented questions, over an average of 9 answered questions in 1 minute.
Controls Musicians Meditators Athletes
RPM 6.17/7.33 6/7 7.5/9.5 6/9
SF-36
Total 120.6 143.5 140.0 139.0
Total (%) 74.91 89.13 86.96 86.34
Mental Health (%) 71.11 88.33 84.44 87.22
Table 5.1: Psychological assessment scores
controls and experts perceive their physical and mental health. Both meditators and athletes have very close overall percentages, however the musicians have the highest score. The same happens when looking solely at the mental health aspect with the musicians feeling the best in regards to their mental health, however, the athletes and the meditators showed a slight difference in these scores. Nevertheless, the control group shows to be the less satisfied group in regards to their mental health, presenting a difference of 17% when compared to the highest scoring group.
5.1.2 Multi-Scale Entropy
For the MSE (Multi-Scale Entropy) analysis, the Resting State data from the Cz electrode was used. From the raw data, the only preprocessing carried out included re-referencing to an average across all electrodes and applying a band-pass filter of 0.1Hz - 30Hz. Next, the data was divided and epoched into 30 seconds of continuous data. A Matlab code was prepared for the MSE analysis according to Costa et al., (2005) C code available online. Each time-scale that is added works as a filter, since the coarse-graining process averages the number of data points according to the time-scale that is in place.
In the data analysis, the following was considered:
1. Amplitude difference of15%of the standard deviation of time series;
2. Two consecutive data points were used for data matching in the coarse-graining section;
3. MSE was calculated for a maximum of70 time-scales.