An Information Model for Lean, Agile, Resilient and
Green Supply Chain Management
Izunildo Fernandes Cabral
Dissertação para a obtenção de Grau de Mestre em Engenharia e Gestão Industrial
Orientador: Professor Doutor António Bárbara Grilo
Composição do Júri:
Presidente: Professor Doutor Virgílio Cruz Machado
Vogais: Professor Doutor Henrique da Rocha O‘Neill; Professor Doutor António Bárbara Grilo
Management
iv
To Professor Doctor Antonio Grilo, my supervisor, for the availability, encouragement, discussion, for all the support, idea, suggestion and text review that contributed to the success of this dissertation.To Professor Doctor, Virgílio António Cruz Machado, responsible for the Project LARG SCM, for all discussion and idea that contributed to the success of this research.
To the Fundação para a Ciência e Tecnologia, for funding this research work
To Ana Balugas, Filipe Grilo and Pedro Campos, professionals of Autoeuropa VW, for their availability to respond the questionnaires and many contributions that supported the validation of the case study.
To master Helena Carvalho and Susana Duarte, Professor Rogério Puga Leal, Professora Virginia Machado and Professora Susana Azevedo for all their contribution in validating the study developed in this research.
To all my laboratory colleagues for their help and encouragement always manifested.
vi
Em ambientes empresariais modernos, uma eficaz Gestão da Cadeia de Abastecimento (SCM) é crucial para a continuidade dos negócios. Neste contexto, Lean, Agile, Resilient e Green (LARG) são identificados como paradigmas fundamentais para a competitividade da Cadeia de Abastecimento como um todo. De facto, a competição entre cadeias de abastecimento tem substituído a tradicional competição entre empresas. Para fazer uma Cadeia de Abastecimento mais competitiva, capaz de responder aos pedidos dos clientes com agilidade, capaz de responder de forma eficaz aos distúrbios inesperados, em conjugação com responsabilidades ambientais, e a necessidade de eliminar processos que não acrescentam valor, as empresas devem implementar um conjunto de práticas de Gestão da Cadeia de Abastecimento LARG e Indicadores-chave de desempenho para medir as suas influências sobre o desempenho da Cadeia de Abastecimento. No entanto, a selecção das melhores práticas LARG e indicadores-chave de desempenho é um problema de tomada de decisões complexo, envolvendo dependências e feedbacks. Por outro lado, qualquer tomada de decisão precisa ser apoiado por dados reais e transparentes. Por isso, esta dissertação pretende apresentar dois modelos integrados para auxiliar a gestão da informação e a tomada de decisão. O primeiro é um modelo de informação para apoiar uma Gestão de Cadeia de abastecimento LARG, permitindo a troca e armazenamento de dados/informação através de uma única plataforma de informação. Neste modelo três tipos de diagramas são desenvolvidos, Diagrama de Processos de Negócio, Diagramas de Casos de Uso e Diagramas de Classe para apoiar a modelação da plataforma de informação. O segundo é um modelo de tomada de decisão, designado ―LARG Analytical Network Process (ANP)‖ para seleccionar as melhores práticas/indicadores-chaves desempenho de gestão de cadeia de abastecimento LARG a serem implementados nas cadeias de abastecimento. Ambos os modelos são desenvolvidos e validados numa cadeia de abastecimento automóvel, nomeadamente a Volkswagen Autoeuropa.viii
In modern business environments, an effective Supply Chain Management (SCM) is
crucial to business continuity. In this context, Lean, Agile, Resilient and Green (LARG),
are advocated as the fundamental paradigm for a competitive Supply Chain (SC) as a
whole. In fact, competition between supply chains (SC) has replaced the traditional
competition between companies. To make a supply chain more competitive, capable
of responding to the demands of customers with agility, and capable of responding
effectively
to
unexpected
disturbance,
in
conjugation
with
environmental
responsibilities, and the necessity to eliminate processes that add no value, companies
must implement a set of LARG SCM practices and Key Performance Indicators (KPI) to
measure their influence on the SC performance. However, the selection of the best
LARG SCM practices and KPIs is a complex decision-making problem, involving
dependencies and feedbacks. Still, any decision-making must be supported by real and
transparent data. This dissertation intends to provide two integrated models to assist
the information management and decision-making. The first is an information model to
support a LARG SCM, allowing the exchange and storage of data/information through
a single information platform. In this model three types of diagrams are developed,
Business Process Diagram (BPD), Use Cases Diagram and Class Diagram to assist
the information platform design. The second is a decision-making model, designated
LARG Analytical Network Process (ANP) to select the best LARG SCM practices/KPI
to be implemented in SCs. Both models are developed and validated within the
automotive SC, namely in Volkswagen Autoeuropa.
x
ACKNOWLEDGMENTS
... IV
RESUMO
... VI
ABSTRACT
... VIII
INDEX
... X
LIST OF FIGURES
... XII
LIST OF TABLES
... XIV
LIST OF ABREVIATIONS
... XVI
LIST OF SYMBOLS
... XX
CHAPTER 1
INTRODUCTION
... 1
1.1
C
ONTEXT... 1
1.2
O
BJECTIVES... 2
1.3
R
ESEARCHM
ETHODOLOGY... 2
1.4
R
ESEARCH CONTRIBUTION OF THIS DISSERTATION... 5
1.5
S
TRUCTURE OF THE DISSERTATION... 5
CHAPTER 2
SUPPLY CHAIN MANAGEMENT (SCM)
... 7
2.1
SCM
CHARACTERIZATION ONL
EAN,
A
GILE,
R
ESILIENT ANDG
REEN... 8
2.1.1
The Lean Paradigm ... 8
2.1.2
The Agile Paradigm ... 9
2.1.3
The Resilient Paradigm ... 10
2.1.4
The Green Paradigm ... 11
2.1.5
Lean, agile, resilient and green paradigms comparison ... 12
2.2
L
EAN,
A
GILE,
R
ESILIENT ANDG
REENSCM
P
RACTICES... 14
2.2.1
Lean practices ... 14
2.2.2
Agile practices ... 15
2.2.3
Resilient practices ... 16
2.2.4
Green practices ... 16
2.3
L
EAN,
A
GILE,
R
ESILIENT ANDG
REENSCM
P
ERFORMANCEM
EASUREMENT... 17
2.4
LARG
S
UPPLYC
HAINM
ANAGEMENTP
RACTICES VS.
P
ERFORMANCE... 18
2.5
S
UPPLYC
HAINC
HARACTERISTICS... 19
CHAPTER 3
MODELS FOR DECISION MAKING
... 23
3.1
A
NALYTICALH
IERARCHYP
ROCESS(AHP) ... 24
3.1.1
AHP methodology ... 25
3.1.2
The Fundamental Scale ... 26
3.2
A
NALYTICALN
ETWORKP
ROCESS(ANP) ... 28
3.2.1
Outline of Steps of the ANP ... 30
3.3
A
DDITIONAL CONSIDERATIONS OFAHP
ANDANP ... 32
3.4
F
UZZY SET THEORY... 33
3.5
F
UZZYAHP ... 35
3.6
F
UZZYANP ... 35
CHAPTER 4
INFORMATION SYSTEM MODELING TECHNIQUES
... 37
4.1
I
NFORMATION SHARING... 37
4.2
B
USINESSP
ROCESSM
ODELINGL
ANGUAGES... 38
4.2.1
What is a Business Process ... 38
4.2.2
Why Business Processes ... 38
xi
4.3.1
Software systems modeling ... 46
4.3.2
Use cases and Use cases Diagram ... 47
4.3.3
Class Diagram... 50
CHAPTER 5
LARG INFORMATION SYSTEM MODELS
... 57
5.1
M
ETHODOLOGY... 57
5.2
T
HEB
USINESSP
ROCESSD
IAGRAM(BPD) ... 59
5.2.1
The proposed automotive SC BPD framework ... 59
5.3
LARG
U
SEC
ASESD
IAGRAMS... 64
5.3.1
Identification of the actors of the system ... 64
5.3.2
Use cases diagrams proposed ... 65
5.4
T
HEL
EAN,
A
GILE,
R
ESILIENT,
ANDG
REENC
LASSD
IAGRAM... 77
5.4.1
Core Lean, Agile, Resilient, and Green classes and attributes ... 80
5.5
C
ONTRIBUTION OFI
NFORMATIONM
ODELING TOI
MPROVELARG
SCM
P
ERFORMANCE... 82
CHAPTER 6
LARG ANP: A PROPOSED CONCEPTUAL MODEL
... 85
6.1
W
HYANP? ... 85
6.2
LARG
ANP
M
ETHODOLOGY... 86
6.2.1
Application of LARG ANP methodology ... 87
CHAPTER 7
CASE STUDY: AUTOEUROPA VW
... 91
7.1
V
OLKSWAGENG
ROUP... 91
7.2
V
OLKSWAGENA
UTOEUROPA... 91
7.2.1
Data gathering for the model ... 91
7.2.2
Pairwise comparison matrices between the elements and related weights ... 92
7.2.3
Supermatrix formulation and analysis ... 103
7.2.4
LARG ANP model final priorities ... 104
7.2.5
Discussion of the results of the LARG ANP model... 105
7.2.6
Advantages and limitations of LARG ANP model ... 106
CHAPTER 8
CONCLUSIONS AND RECOMMENDED FUTURE WORK
... 109
REFERENCES
... 111
ANNEX
... 121
A
NNEX1
L
IST OF PREVIOUSLARG
PRACTICES IDENTIFIED... 121
Annex 1.1 List of Lean practices ... 121
Annex 1.2 List of Agile practices ... 123
Annex 1.3 List of Resilient practices ... 124
Annex 1.4 List of Green practices ... 125
A
NNEX2
E
XAMPLES OF QUESTIONNAIRES USED IN GATHERING DATA... 127
Annex 2.1 Questionnaire of pairwise comparison of Criteria elements (enablers) according
to SC competitiveness ... 127
Annex 2.2 Questionnaire of pairwise comparison of LARG practices according to
paradigms ... 131
Annex 2.3 Questionnaire of pairwise comparison of LARG practices according to Focal
firm ... 137
xii
Figure 1.1 Research methodology. ... 4
Figure 2.1 Green supply chain. ... 12
Figure 2.2
–
Performance indicators and management characteristics relationships... 20
Figure 3.1
–
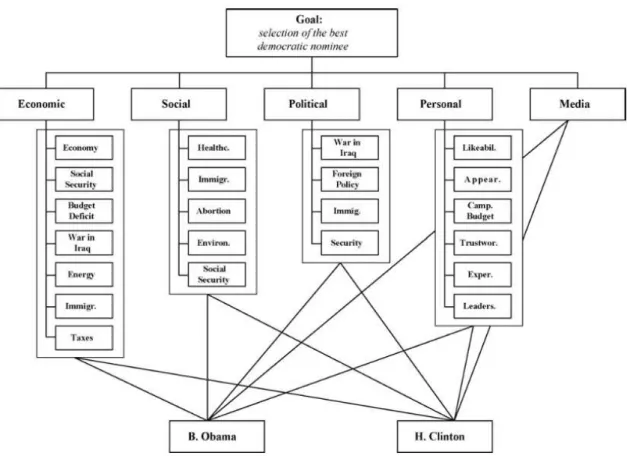
The AHP model for the selection of the Democratic Nominee. ... 28
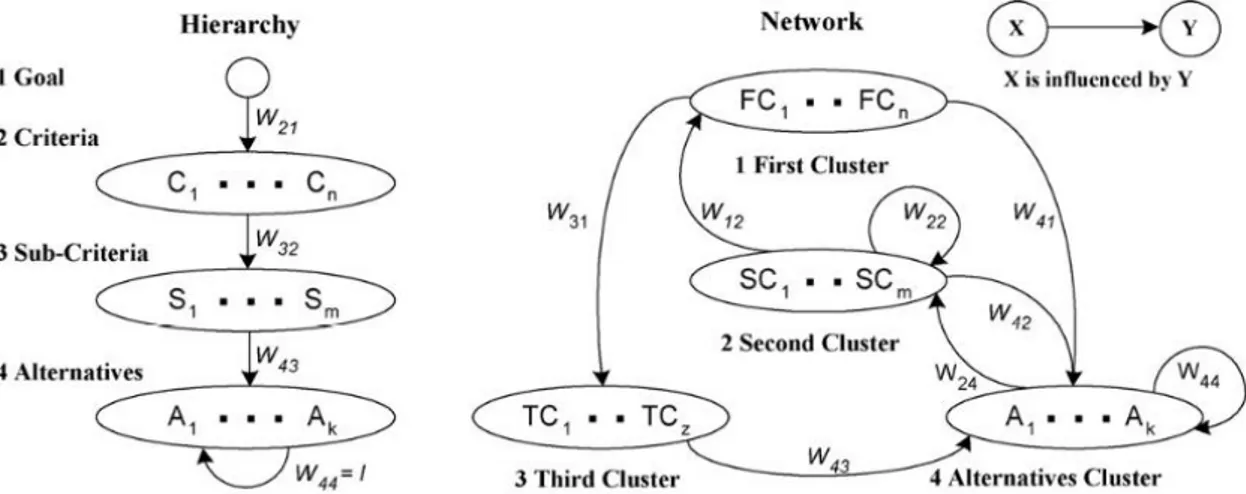
Figure 3.2 Comparison of a hierarchy with a network. ... 29
Figure 3.3 - An example of ANP model ... 30
Figure 4.1
–
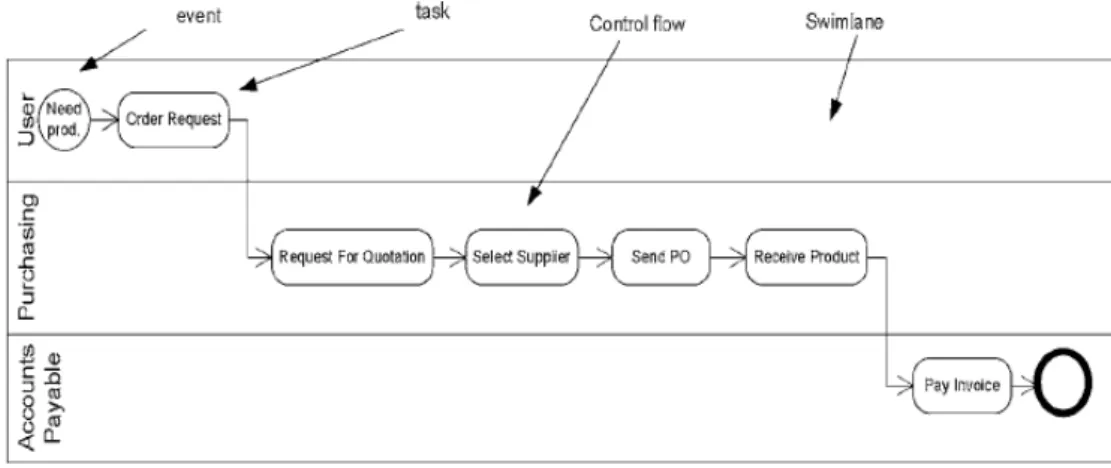
A private business process using BPMN notations. ... 41
Figure 4.2
–
The abstract public purchasing process. ... 41
Figure 4.3
–
The collaboration process. ... 41
Figure 4.4
–
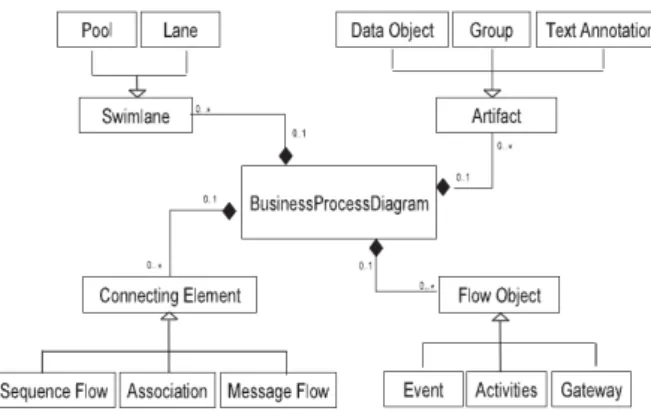
Business process diagrams core elements. ... 43
Figure 4.5
–
core set BPMN elements ... 45
Figure 4.6
–
Three complementary views or sets of UML diagrams. ... 45
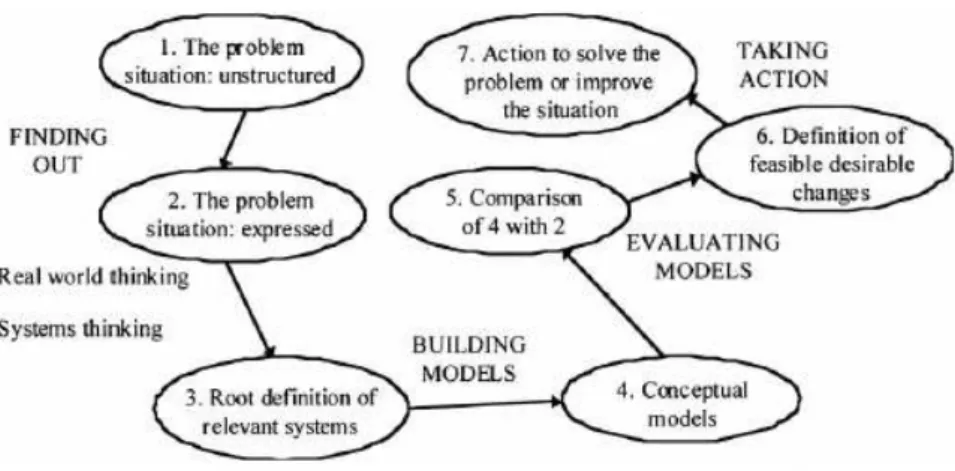
Figure 4.7 Checkland‘s seven
-stage soft systems methodology. ... 46
Figure 4.8 Elements of a use case diagram. ... 48
Figure 4.9 Example of use case diagram and their relationships. ... 50
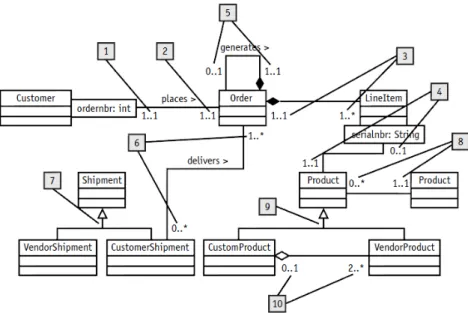
Figure 4.10 Elements of class diagrams. ... 52
Figure 4.11 How to represent an association relationship in UML. ... 52
Figure 4.12 How to represent an aggregation relationship in UML. ... 52
Figure 4.13 How to represent a composition relationship in UML. ... 53
Figure 4.14 How to represent a generalization relationship in UML. ... 53
Figure 4.15 Class diagram example. ... 54
Figure 5.1 Methodology for LARG information system design. ... 58
Figure 5.2 SC‘s entities of study. ... 60
Figure 5.3 Global automotive SC Business Process Diagram developed. ... 61
Figure 5.4 Stretch of the conceptual BPD developed. ... 63
Figure 5.5 Use cases diagram to registry, login and logout. ... 65
Figure 5.6 Use cases diagram to calculate the degree of resilience in the chain. ... 66
Figure 5.7 Use cases diagram to calculate the number of stop line in a given period. . 67
Figure 5.8 Use cases diagram to calculate the quantity of recycled in the SC. ... 67
Figure 5.9 Use cases diagram to calculate the number of order fulfilled in time. ... 68
Figure 5.10 Use cases diagram to calculate the LARG performance of a supplier or
focal firm. ... 69
Figure 5.11 Use cases to evaluate the SC performance. ... 70
5.12 Use case diagr
am to check supplier‘s inventory level.
... 71
Figure 5.13 Use case diagram to check order status. ... 71
Figure 5.14 Use case diagram to manage entity/order info. ... 72
xiii
entity/SC. ... 73
Figure 5.17 Use case diagram to calculate the LARG SC performance. ... 74
Figure 5.18 Use case diagram to evaluate a supplier. ... 75
Figure 5.19 The Conceptual Class Diagram ... 79
Figure 6.1 Various steps in LARG ANP model ... 86
Figure 6.2 ANP model to select LARG best SCM practices. ... 87
Figure 7.1 Priorities for criteria comparison with respect to ―Goal‖, obtained on Super
Decision. ... 97
Figure 7.2 Cluster matrix. ... 103
Figure 7.3 Unweighted supermatrix. ... 104
Figure 7.4 Weighted supermatrix. ... 104
Figure 7.5 Limit matrix. ... 104
xiv
Table 2.1 Lean, agile, Resilient, and Green paradigms comparison . ... 13
Table 2.2 Lean SCM practices. ... 15
Table 2.3 Agile SCM practices. ... 15
Table 2.4 Resilient SCM practices. ... 16
Table 2.5 Green SCM practices. ... 16
Table 2.6 Supply chain performance measures. ... 17
Table 2.7 LARG SCM practices influence on manufacturing supply chain performance.
... 19
Table 2.8 Paradigms synergies and divergences overview . ... 21
Table 3.1 The Fundamental Scale of Absolute Numbers. ... 26
3.2 Some applications of AHP/ANP ... 33
3.3 Some applications of Fuzzy AHP. ... 35
3.4 Some applications of Fuzzy ANP. ... 36
Table 4.1 Elements of a BPD. ... 43
Table 4.2 – General components of a root definition. ... 47
Table 5.1 Use cases diagram resume. ... 76
Table 7.1 Overall information of elements pairwise comparison. ... 93
Table 7.2 Overall information of clusters pairwise comparison. ... 94
Table 7.3 Criteria pairwise comparison with respect to Goal. ... 94
Table 7.4 Random consistency index. ... 95
Table 7.5 Normalized criteria pairwise comparison matrix with respect to the goal. .... 95
Table 7.6 Weighted criteria matrix and consistency vector. ... 96
Table 7.7 LARG KPIs pairwise comparison matrix with respect to cost. ... 97
Table 7.8 LARG KPIs ranking with respect to each criteria. ... 97
Table 7.9 LARG KPIs pairwise comparison matrix with respect to focal firm. ... 98
Table 7.10 LARG KPIs ranking according to each paradigm. ... 98
Table 7.11 LARG KPIs ranking with respect to each practice. ... 99
Table 7.12 LARG practices pairwise comparison with respect to focal firm. ... 99
Table 7.13 LARG practices ranking with respect to each KPI. ... 100
Table 7.14 LARG practices ranking with respect to each criteria... 100
Table 7.15 LARG practices ranking with respect to each paradigm. ... 101
Table 7.16 LARG paradigms pairwise comparison with respect to focal firm. ... 101
xvi
SCM Supply Chain ManagementLARG Lean, Agile, Resilient, and Green
ANP Analytical Network Process
SC Supply Chain
LARG SCM Lean, Agile, Resilient, and Green Supply Chain Management
LARG SC Lean, Agile, Resilient, and Green Supply Chain
KPI Key Performance Indicators
BPD Business Process Diagram
LARG ANP Lean, Agile, Resilient, and Green Analytical Network Process
MIT Massachusetts Institute of Technology
Pt Portugal
EDAM Engineering Design and Advanced Manufacturing
IT Information Technology
BPMN Business Process Modeling Notation
UML Unified Modeling Language
LARG KPI Lean, Agile, Resilient, and Green Key Performance Indicators
VW Volkswagen
LM Lean Manufacturing
NVA Non-Value Added
VA Value Added
TPS Toyota Production System
JIT Just in Time
FMS Flexible Manufacturing Systems GSCM Green Supply Chain Management TQM Total Quality Management
JIS Just in Sequence
ISO International Organization for Standardization R&D Research and Development
xvii
ELECTRE ELimination Et Choix Traduisant la REalitéTOPSIS Technique for Order Preference by Similarity to Ideal Solution FAHP Fuzzy Analytical Hierarchy Process
RFID Radio Frequency Identification FANP Fuzzy Analytical Network Process OMG Object Management Group BPM Business Process Model
PO Purchasing Order
RFQ Request For Quotation
OOSE Object-Oriented Software Engineering E-R Entity-Relationship
CD Compact Disc
TV Television
SC BPD Supply Chain Business Process Diagram EOQ Economic Order Quantity
FG Finished Goods
TPM Total Productive Maintenance
UCD Use Cases Diagram
ID Identifier
SE Super Entity
FF Focal Firm
LARG UCD Lea, Agile, Resilient and Green Use Cases Diagram LARG SC Lea, Agile, Resilient and Green Supply Chains IS Information System
G Goal
C Cost
SL Service Level
T Time
QofP Quality of Product
L Lean
A Agile
R Resilient
G Green
1tS 1rst tier Suppliers 1tD 1rst tier Distributors
P Practice
RIW Relative Importance Weight PWC Pairwise Comparison
xviii
RI Random Consistency Index
IC Inventory Cost
OFR Order fulfillment Rate
RUD Responsiveness to Urgent Deliveries
NC No Comparison
SS Strategic Stock
xx
ω Eigenvalue vector
λmax Maximum eigenvalue
1
Chapter 1 Introduction
1.1 Context
In recent years, the area of supply chain management (SCM) has become very popular. This is evidenced by market increases in practitioner and academic publications, conferences, professional development programs and university courses in the area (Burgess, Singh, & Koroglu, 2006). Within today‘s manufacturing circle, there is a rapid revolution due to many reasons, ranging from customer oriented products, shortening product life cycles, stakeholder requirements, local and international regulatory compliances, to competitions amongst players within industry (Olugu, Wong, & Shaharoun, 2010). The global market has imposed that competitiveness improvement requires collaborative work and partnerships across supply chains, motivating companies to make better decision to improve the Supply Chain (SC) performance. Collaboration between organizations, supported by flawless communication between their systems and applications, has been identified as key factors for enterprise success on a continuously changing global environment, enabling the companies to enforce their partnership and strengthen their business in the market (Jardim-Goncalves, Grilo, & Steiger-Garcao, 2006).
Organizations are looking for new methods of work and business relationships, and the exchange of information and documents with partners is often incapable of being executed automatically and in electronic format. This is mainly due to problems of incompatibility in the information representation and in the software application methods adopted (Jardim-Goncalves et al., 2006). From a Supply Chain Management point of view, any company should not work in isolation, but must collaborate with others entities in the chain to compete with other chains. So, if there is a platform that supports that exchange, it will be easier for enterprises to share data/information, allowing increasing the competitiveness of the supply chain and making timely decisions (Cabral, Grilo, Puga-Leal, & Cruz-Machado, 2011). But, having an information platform and a collaborative supply chain is not itself sufficient to meet the markets requirements.
2
1.2 Objectives
The aim of this dissertation is to develop two models to support a Lean, Agile, Resilient, and Green SCM (LARG SCM). The first objective is a LARG information model that will support the creation of a LARG platform, which will support data/information exchange between all the companies in the considered supply chain. The second objective is to develop a decision making model that will assist managers in selecting the best practices, KPIs, and paradigms in different situations, in LARG context.
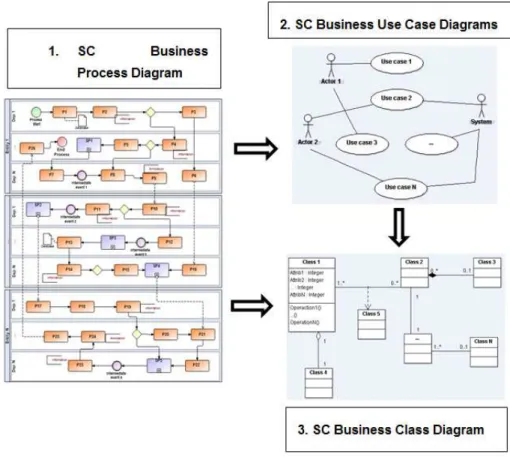
Those objectives are developed through literature review and case study development in automotive Supply Chain, using interviews and questionnaires with experts in automotive industry. The first objective (LARG information model) is achieved through the creation of three diagrams: Business Process Diagram (BPD); Use Cases Diagram; and Class Diagram. The BPD is developed to model core business processes, material, information, and financial flows of each entity in the supply chain. Use Cases diagrams are to represent the interaction between users and platform system. With the Class Diagram, is intended to show the static view of the system and the information to be stored.
The second objective (LARG ANP Model) is reached by developing an Analytical Network Process (ANP) that allows selecting the best factor (practices, KPIs, paradigms, enablers), by prioritizing all of them. To this purpose a set of clusters/elements are identified to compose the model and pairwise compared with respect to a given factor.
1.3 Research Methodology
This scientific research is part of the MIT Project, designated Lean, Agile, Resilient, and Green Supply Chain Management funded by Fundação para a Ciência e a Tecnologia da Faculdade de Ciências e Tecnologia (MIT-Pt/EDAM-IASC/0033/2008). The project has eleven tasks and each task can utilize the work of others. Namely in this task (six) designated ―LARG SCM Information System‖, there are many contributions of previous tasks (task four – Metrics for Lean, Agile, Resilient, and Green SCM; task three - Assessment of Lean, Agile, Resileint, and Green SCM implementation practices; task two – Lean, Agile; Resilient, and Green paradigms attributes; task one – SCM characterization on Lean, Agile, Resilient, and Green).
3
Performance Indicators (KPIs) to measures the influences of LARG practices implementation; which are LARG SCM attributes; which are the models for decision making in SCM context.As shown in Fig. 1.1, firstly a literature review on lean, agile, resilient, and green SCM (LARG SCM) is done. In this stage, the aim is to understand the concept of each paradigm and finding the potential tradeoffs and divergences between them and identify a set of LARG SCM practices and possible KPIs to evaluate the influence of practices implementation on SC performance. The practices and KPIs are connected directly to each SC level (distributors, focal firm, suppliers). Then, is identified the most appropriate diagrams to assist the information model development. This model development is supported by two standard language used in IT modeling fields, Business Process Notation Modeling (BPMN) and Unified Modeling Language (UML). Literature review is made in this stage to understand the potentiality of each language/diagram. In LARG information model development a Business Process Diagram is modeled to give a global vision of the material, information and financial flows of the automotive SC considered. Firstly, were created a BPD general, with contributions of a team of experts of the referred project, and in second stage was adapted to an automobile chain, with contributions of experts in automobile industry, namely professionals in logistics that work in focal firm. The same procedures are followed in use cases diagram and class diagram development.
Based on BPD developed, it will be possible to identify the core data/information associated to each organization/department and process that will be represented in class diagram. All data/information stored on structural component of LARG platform (class diagram) will be very important to assist the managers in decision making. The LARG platform will serve as support for decision making in ANP model, i.e., looking to a given KPI (metrics) value, is decided which practice should be implemented to improve these value.
Before development of the ANP model, a literature review was conducted to contribute to build a model to assist decision making in LARG context. In this stage is identified the clusters/elements to represent the ANP model.
Based on data collection in automobile industry and contributions of a team of experts, are eliminated the practices that are not implemented in automotive SC and is selected a set of implemented practices for making pairwise comparisons according to other factors (enablers, KPIs, paradigms, stakeholders), to validate the LARG ANP model. At the same time, is selected a set of KPIs to be pairwise compared according to other factors (practices, paradigms, stakeholders, enablers). To make pairwise comparisons between clusters/elements of ANP model, some questionnaires were made in the logistics department of a focal firm (Autoeuropa). The questionnaires were directed to the responsible of logistics department.
4
Figure 1.1 Research methodology.Literature review on Lean, Agile, Resilient and Green SCM
- SCM characterization on Lean, Agile, Resilient and Green (understand LARG SCM context) - Identification of LARG practices and KPIs (performance)
- Identification of LARG attributes (to class diagram development) - SCM characteristics
Literature review on techniques for information system modeling
- Select and study the techniques
- Understand the linking between the techniques
Literature review on models for decision making
- Select and study the models
- Understand the application of each model
Selection and linking of practices and KPIs
- Selection of LARG SCM practices in automotive industry context
- Selection of LARG KPIs to evaluate LARG SCM practices implementation - Connect LARG practices and KPIs to each entity (level of the chain) - Identification and selection of macro indicators (enablers)
LARG Information system modeling
- Mapping automotive SC Business Processes Diagram - BPD (using BPMN) - Use cases and use cases diagram development (using UML)
- LARG class diagram development (using UML)
Development of ANP model to select best LARG practices and KPIs
- Identification of clusters/elements to represent the model - ANP conceptual model (linking between clusters/elements)
- Questionnaires/interviews to eliminate no implemented LARG practices and no used KPIs - Questionnaires to make pairwise comparisons between clusters/elements
5
1.4 Research contribution of this dissertation
Firstly this dissertation intends to review the existing research on LARG SCM, namely characteristics, attributes, practices, performance indicators and existing models. That literature reviews aims to support the LARG SCM information system development and ANP model. This dissertation has also carried out a review of major LARG SCM practices and KPIs and finding the potential relationships between the practices and the KPIs, situation where the implementation of a practice can improve the value of a given KPI.
The key research contribution of this dissertation is the introduction of an information system model to assist SC managers on decision-making. Three types of diagrams have been developed in this research to support an LARG platform system that will improves the exchange of information between all actors in the SC. Information sharing through this proposed platform system is crucial for effective SCM, mainly in SCs as automobile where the frequency of information exchange should be very high. The business process diagram developed represents a powerful toll to understand the link of processes in different level of the chain or inside the organizations, processes to be improved, points where interoperability problems exist, and fundamentally data/information associated to each organization/department and process. The uses cases developed have an important contribution in this research since they represent all system requirements, i.e., the potential interactions between the users (agents of considered SC) and the system. The importance of class diagram is that allows storing all data/information required to a LARG SCM.
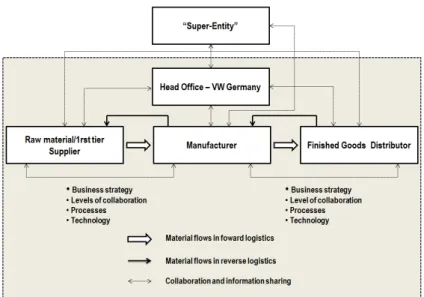
Other interesting contribution of this research is the introduction of a fictional ―super entity‖ that is responsible for managing the chain as a whole. This ―super entity‖ is an external entity that seeks SC competitiveness by improving SC performance as a whole. The main function of this ―super entity‖ is to make SC entities working in collaboration to achieve a unique result: SC competitiveness.
Another key contribution of this thesis is that offer an ANP model to support the decision-making, on selecting the best practices to be implemented in the automotive SC. This model, also allows testing other scenarios as select the best KPI to measures performance of a given entity, enabler most appropriate to achieve competitiveness and the paradigm more suitable to a given entity or supply chain. This model is very flexible since allows managers to prioritize the best factor according to other given factor.
1.5 Structure of the dissertation
The dissertation is organized in 7 chapters. This first chapter does a brief introduction, namely as regards the scope of study, objectives, methodology, and contribution of this research.
6
Chapter 3 and 4 are also a literature review. In chapter 3 a brief description of models for decision-making is done, and in chapter 4 is described the techniques to model the business process and information system.Chapter 5 presents the diagrams developed to assist LARG information system modeling, namely: Business Process Diagram (BPD), use cases and class diagram.
Chapter 6 applies the developed model to select the LARG SCM best practices.
In chapter 7 a case study in automobile SC is presented to show the results of ANP model.
The conclusions and a critical analysis of the results obtained are presented in chapter 8. Future research work is also suggested to develop as a result of the study now presented.
7
Chapter 2 Supply Chain Management (SCM)
Supply chains encompass the companies and the business activities needed to design, make, deliver, and use a product or service (Hugos, 2006). Businesses depend on their supply chains to provide them with what they need to survive and thrive. Every business fits into one or more supply chains and has a role to play in each of them (Hugos, 2006).
According to (Stevens, 1989), a Supply Chain (SC) can be described as a chain that links various agents, from the customer to the supplier, through manufacturing and services so that the flow of materials, money and information can be effectively managed to meet the business requirements. A supply chain, in other words, extends from the original supplier or source to the ultimate customer (Blanchard, 2010). There are basically three types of flows in a SC: material flow (direct flow and reverse flow), information flow and financial flow. Currently there is the assumption that SC‘s compete instead of other SC‘s (Martin Christopher & Towill, 2000). So, the competitiveness or failure of supply chains is determined by the way that the entities manage and integrate their process. It is in this context that the term Supply Chain Management (SCM) appears. Then, what is Supply Chain Management? According to (Hugos, 2006), the SCM can be defined as the things that can be done to influence the behavior of the supply chain and get the desired results. In literature, there are many definitions of SCM. Following is presented some definitions:
Hugos M. in his book (Essentials of Supply Chain Management, 2006), refers to SCM like ―the coordination of production, inventory, location, and transportation among the participants in a supply chain to achieve the best mix of responsiveness and efficiency for the market being served‖.
The systemic, strategic coordination of the traditional business functions and the tactics across these business functions within a particular company and across businesses within the supply chain, for the purposes of improving the long-term performance of the individual companies and the supply chain as a whole (Mentzer et al., 2001).
Strategic factor for increasing organizational effectiveness and for the better attainment of organizational goals such as enhanced competitiveness, better customer service and increased profitability (Gunasekaran, Patel, & Tirtiroglu, 2001).
Is the set of business processes and resources that transforms a product from raw materials into finished goods and delivers those goods into the hands of the customer. Supply chain management (SCM) has been defined as ―the management of upstream and downstream relationship with suppliers, distributors and customers to achieve greater customer value-added at less total cost‖ (Wilding, 2003).
8
Often there is some confusion between the concept of SCM and logistics. According to (Hugos, 2006), there is a difference between the concept of supply chain management and the traditional concept of logistics. According to him, logistics typically refers to activities that occur within the boundaries of a single organization and supply chain refer to networks of companies that work together and coordinate their actions to deliver a product to market. Also, traditional logistics focuses its attention on activities such as procurement, distribution, maintenance, and inventory management. Supply chain management acknowledges all of traditional logistics and also includes activities such as marketing, new product development, finance, and customer service (Hugos, 2006).And what is the SCM objective? According to (Groznik & Maslaric, 2010), the objective of supply chain management is to provide a high velocity flow of high quality, relevant information that enables suppliers to provide for the uninterrupted and precisely timed flow materials to customers. To (Susana G. Azevedo, Carvalho, & Machado, 2010a), the supply chain objective is to delivering the right product, in the right quantity, in the right condition, to the right place, at the right time, for the right cost. Since customer requirements are continuously changing, supply chains must be adaptable to future changes to respond appropriately to market requirements and changes.
2.1 SCM characterization on Lean, Agile, Resilient and Green
2.1.1 The Lean Paradigm
Lean Manufacturing (LM), was developed by Taiichi Ohno at Toyota Motor Company in the 1950s (Motwani, 2003). The term ―Lean‖ means a series of activities or solutions to eliminate waste, reduce Non-Value Added (NVA) operations, and improve the Value Added (VA) process (S. Wu & Wee, 2009). The word ―Lean‖ or ―Lean production‖ was developed from the Future Car Investigation by MIT, to interpret Japan‘s new production system, particularly the TPS (Toyota Production System) in order to distinguish it from mass production (Conti, Angelis, Cooper, Faragher, & Gill, 2006; MacDuffie & Helper, 1997; Womack, Jones, & Ross, 1991). The literature offers many definitions of lean philosophy, but all of them share most of the same principles (Susana G. Azevedo, Carvalho, & Machado, 2010b). According to Womack and Jones (1991), the lean paradigm is an approach which provides a way to do more with less (less human effort, less equipment, less time and less space), while coming closer to customer requirements (Womack et al., 1991).The lean paradigm is a systematic approach to identify and eliminate all non-value-added activities through continuous improvement (Susana G. Azevedo et al., 2010b).
9
The importance of the lean paradigm is highlighted by (Gunasekaran et al., 2001), in the following affirmation: ―The viability of a firm now largely depends on how well it can respond to customer requirements while becoming lean‖. The lean approach has essentially focused on the elimination of waste (Ashish Agarwal, Shankar, & Tiwari, 2007) and responsiveness to change (Motwani, 2003).The core content of lean manufacturing lies in Just in Time (JIT), reducing the inner waste of resources with the smallest investment achieving the biggest output (H. M. Wu, 2009).
2.1.2 The Agile Paradigm
The concept of agile manufacturing was presented in 1991, by the Iaccoca of Lehigh University, which focus on the ability to respond rapidly to changes in demand, both in terms of volume and variety. The origins of agility as a business concept lie in Flexible Manufacturing Systems (FMS) (Fan, Xu, & Gong, 2007). According to (Fan et al., 2007), flexibility is one of the key characters of an agile organization. This concept can be extended to a supply chain. To (M. Christopher, 2000), business agility embraces organizational structures, information systems, logistics processes, and, in particular mindsets.
Given the objective of supply chain, the agile supply chain intends to create the ability to respond rapidly and cost effectively to unpredictable changes in markets and increasing levels of environmental turbulence, both in terms of volume and variety (Ashish Agarwal et al., 2007). To (Baramichai, Zimmers, & Marangos, 2007), ―an agile supply chain is an integration of business partners to enable new competencies in order to respond to rapidly changing, continually fragmenting markets. The key enablers of the agile supply chain are the dynamics of structures and relationship configuration, the end-to-end visibility of information, the event-driven and event-based management‖. According to Christopher (2000), the agile supply chain characteristic is market sensitive. To him, market sensitive means that the supply chain is capable of reading and responding to real demand.
Agile manufacturing works well where demand is less predictable and the requirement for variety is high (M. Christopher, 2000). To(Fan et al., 2007),the aim of the agile supply chain is to carry inventory as generic as possible (postponement concept).
10
Decrease in manufacturing costs, increased customer satisfaction, removal of non-value added activities and increased competitiveness (Lin, Chiu, & Chu, 2006) are among benefits that can be achieved through agile strategies. It is recognized as fundamental strategies for survival in turbulent and volatile markets and to help companies to deliver the right product at the right time to the customers (Ashish Agarwal et al., 2007; Lin et al., 2006; Yusuf, Sarhadi, & Gunasekaran, 1999).2.1.3 The Resilient Paradigm
To increase profits margins, many companies develop strategies to seek out low-cost solutions. This can be a big problem because today‘s marketplace is characterized by higher levels of turbulence and volatility. According to (S. Azevedo, 2008) the risk to business continuity has increased as result of supply chain vulnerability to disruption. Today the objective in supply chain design has to be upon resilience, whereas in the past was cost minimization or service optimization (Tang, 2006). Resilient supply chains may not be the lowest-cost supply chains but they are more capable of coping with the uncertain business environment (H. Carvalho & Machado, 2009).
To (H. Carvalho & Machado, 2009), resilience refers to the ability of the supply chain to cope with unexpected disturbances. Supply chain resilience is concerned with the system ability to return to its original state or to a new one, more desirable, after experiencing a disturbance, and avoiding the occurrence of failure modes. The goal of supply chain resilience analysis and management is to prevent the shifting to undesirable states, i.e., the ones where failure modes could occur. In supply chain systems, the objective is to react efficiently to the negative effects of disturbances (which could be more or less severe) - (H. Carvalho & Machado, 2009). According to (Haimes, 2006), the aim of resilience strategies has two manifolds:
To recover the desired values of the states of a system that has been disturbed, within an acceptable time period and at an acceptable cost;
To reduce the effectiveness of the disturbance by changing the level of the effectiveness of a potential threat.
11
following way: redundancy capacity may or may not be used; it is this additional capacity that would be used to replace the capacity loss caused by a disruption. Flexibility, on the other hand, entails restructure previously existing capacity. Christopher and Peck (Martin Christopher & Peck, 2004) have taken care to avoid some of the pitfalls of synonyms; in particular they distinguish between ―resilience‖ and ―robustness‖. For them, robust mean ―strong or sturdy in physique or construction‖. Here the emphasis is on physical strength. In IT terminology ―robustness‖ is ―the ability of a computer system to cope with errors during execution‖. A robust process may be desirable, but does not itself equate to a resilient supply chain. They define resilience as ―the ability of a system to return to its original state or move to a new, more desirable after being disturbed.The ability to avoid the failure modes, after a disturbance occurrence, is vital for the supply chain success - it is a supply chain resilience property. In this sense, resilience can be a strong source of competitive advantage. However, resilience is not always desirable; for instance, systems states that reduce profitability can be highly resilient. The organizations difficulties in escaping from these undesirable states, even when reengineering programs are implemented, is emphasized by the relatively low success rate of business process reengineering (Al-Mashari, Irani, & Zairi, 2001).
2.1.4 The Green Paradigm
The green supply chain management was raised firstly by Manufacturing Research Association of Michigan State University in 1996, which is added the thought of green manufacturing and environmental management based on the traditional SCM in order to heighten the utility rate of resource and energy and reduce the environmental influence which was produced by some product (Jia & Bai, 2009). Environmentally sustainable green supply chain management has emerged as organizational philosophy to achieve corporate profit and market share objectives by reducing environmental risks and impacts while improving ecological efficiency of these organizations and their partners (Rao & Holt, 2005). Changes in government policies, such as the Waste Electrical and Electronic Equipment directive in European Union (Barroso & Machado, 2005) (Gottberg, Morris, Simon, Mark-Herbert, & Cook, 2006), making the industry responsible for post-consumer disposal of products, forces both manufacturers and researchers to implement sustainable operations across the supply chain (Zhu, Sarkis, & Lai, 2008). The increased pressure from community and environmentally conscious consumers had lead to rigorous environmental regulations, forcing the manufacturers to effectively integrate environmental concerns into their management practices (Rao & Holt, 2005).
12
retailer and customer to form a bidirectional logistic which is based on the reuse, remanufacture and recycle and to height the utility rate of the resource and emerge and reduce or eliminate the environmental influence (Wang, Zhang, Liu, Liu, & Zhang, 2005), i.e., suppliers, manufacturers and customers should work together towards the reduction of environmental impact from production processes and products (Vachon & Klassen, 2008). The schematic of the material flow and the echelons involved in a green supply chain is presented in Fig. 2.1. The goals system of GSCM is consisted of price, quality, cost, service, resource and environment (Guo, Zhao, & Wang, 2008). The content of GSCM includes green design, green material, green manufacture, green marketing, green packing, green consumption and green recycle (Denf & Wang, 2008; Guo et al., 2008; X. Z. Li & Wang, 2008).Figure 2.1 Green supply chain (Olugu, Wong, & Shaharoun).
According to (Srivastava, 2007), green supply chain management can reduce the ecological impact of industrial activity without sacrificing quality, cost, reliability, performance or energy utilization efficiency; meeting environmental regulations to not only minimizing ecological damage, but also leading to overall economic profit.
2.1.5 Lean, agile, resilient and green paradigms comparison
13
Table 2.1 Lean, agile, Resilient, and Green paradigms comparison (H. Carvalho & Machado, 2009).Driver Lean Agile Resilient Green
Purpose
Focus on cost reduction and flexibility, for already available products, through
continuous elimination of waste or non-value added activities across the
chain Understands customer requirements by interfacing with customers and market and being adaptable to future
changes
System ability to return to its original
state or to a new one, more desirable, after experiencing a
disturbance, and avoiding the occurrence of failures modes
Focus on sustainable development - the reduction of
ecological impact of industrial activity
Manufacturing focus
Maintain high average utilization rate. It uses just in time practices,
―pulling‖ the goods
through the system based on demand
Has the ability to respond quickly to
varying customer needs (mass customization), it
deploys excess buffer capacity to respond to market
requirements
The emphasis is on flexibility (minimal
batch sizes and capacity redundancies), the schedule planning is
based on shared information
Focus on efficiency and waste reduction for environmental benefit and developing of re-manufacturing capabilities to
integrate reusable/remanufactured components Alliances (with suppliers and customers)
May participate in traditional alliances
such as partnerships and joint ventures at the
operating level
Exploits a dynamic type of alliance
known as a ‗‗virtual organization‘‘ for
product design
Supply chain partners join an alliance network to
develop security practices and share
knowledge
Inter-organizational collaboration involving
transferring or/and disseminating green knowledge to partnersand
customer cooperation
Organizational structure
Uses a static organizational structure with few
levels in the hierarchy
Create virtual organizations with partners that vary
with different product offerings
that change frequently
Create a supply chain risk management culture
Create an internal environmental management
system and develop environmental criteria for
risk-sharing
Approach to choosing suppliers
Supplier attributes involve low cost and high quality
Supplier attributes involve speed,
flexibility, and quality Flexible sourcing
Green purchasing Inventory strategy Generates high turns and minimizes inventory throughout the chain
Make in response to customer demand
Strategic emergency stock in potential
critical points
Introduce reusable/ remanufactured parts in the
material inventory; Reduce replenishment frequencies to
decrease carbon dioxide emissions; Reduce redundant
materials
Lead time focus
Shorten lead-time as long as it does not increase cost
Invest aggressively in ways to reduce
lead times Reduce lead-time
Reduce transportation lead time as long it does not increase carbon dioxide
emissions Product design strategy Maximize performance and minimize cost
Design products to meet individual customer needs
Postponement Eco-design and incorporation of complete material life cycle for evaluating ecological risks
and impact
Based on Table 2.1 and literature review, is possible to conclude: the main objective of each paradigm is:
Lean – cost reduction and elimination of waste.
14
Resilient – capacity to respond to unexpected disruption. Green – sustainable development and reduction of environmental impact.
There are some interesting conflicts between the paradigms, e.g., in respect to inventory strategic; lean supply chains typically have lower emissions due to reduced inventory being held internally at each company, but the frequent replenishment (due to low inventory level required in lean paradigm) generally tends to increase emissions. As distance increases, it is quite possible for lean and green to be in conflict (H. Carvalho & Machado, 2009; Venkat & Wakeland, 2006). With the increase of replenishment, supply chains are increasingly covering larger distances, consuming significantly more fossil-fuel energy for transportation and emitting much more carbon dioxide (Venkat & Wakeland, 2006). So, lean may be green in some cases, but not in others (H. Carvalho & Machado, 2009). Other conflict is between lean and resilient paradigm; lean require low inventory to minimize inventory cost, and in resilient paradigm is necessary a high inventory level due unexpected disturbance. The managers have to find the better strategies for their company or supply chains.
2.2 Lean, Agile, Resilient and Green SCM Practices
To improve SCM performance it is needed to implement a set of practices in the SC‘s entities and measure the impacts of these practices which can occur at the different entities. Following is presented some practices of each paradigm, in each level of the chain. The practices suggested are based in the literature review (S. Azevedo & Machado, 2009; Susana G. Azevedo et al., 2010a; Susana Garrido Azevedo, Carvalho , & Machado, 2010; Helena Carvalho, Azevedo, & Machado, 2010). Complete list are presented in annex 1. All practices should contribute to an effective supply chain based on lean, agile, resilient and green paradigm. According to (Susana G. Azevedo et al., 2010b), all these practices contributes to a supply chain with less waste (non-value-added activities), more responsive to the customer requirements, able to overcome disruption conditions and also to reduce environmental impacts. There are some practices that can belong to one or more paradigm, and have different impact on each paradigm.
2.2.1 Lean practices
15
Table 2.2 Lean SCM practices.Lean SCM practices
D
is
tr
ibu
to
r Demand stabilization
Milk run or circuit delivery for smaller distances Order/shipment tracking/notice
To use third-party logistics for transportations
Foc
al
Firm
Just in time (JIT) (focal firm → first tier customer)
Pull flow control
Total quality management (TQM)
Supplier relationships/long-term business relationship
S
up
pli
er
Just in time (JIT) (first tier supplier → focal firm)
Just in sequence (JIS) (first tier supplier → focal firm) Delivery materials directly to the point of use Single sourcing and lean purchasing
2.2.2 Agile practices
Agile practices are all the practices reflect the entity ability to respond rapidly and cost effectively to unpredictable changes. Table 2.3 shows some agile practices that can be implemented in different level in the chain.
Table 2.3 Agile SCM practices.
Agile SCM practices
D
is
tr
ibu
to
r First choice partner
Ability to change quantity of supplier‘s order Ability to change delivery times of supplier‘s order
Use of IT to coordinate/integrate activities in procurement
Foc
al
Firm
Ability to change delivery times of supplier‘s order
To use IT to coordinate/integrate activities in design and development Rapidly reconfigure the production process
To increase frequencies of new product development
S
up
pli
er
Speed in adjusting delivery capability To capture information immediately
16
2.2.3 Resilient practices
Resilient practices are a set of practices that reflect the entity ability to cope with unexpected disturbances. Table 2.4shows a set of resilient practices that can be implemented in different level in the chain.
Table 2.4 Resilient SCM practices.
Resilient SCM practices
D
is
tr
ibu
to
r Sourcing strategies to allow switching of suppliers
Developing visibility to a clear view of upstream inventories and supply conditions Flexible supply base/flexible sourcing
Committing to contracts for material supply (buying capacity whether it is used or not)
Foc
al
Firm
Strategic stock
Excess of capacity requirements Creating total supply chain visibility
Developing collaborative working across supply chains to help mitigating risk
S
up
pli
er
Maintaining a dedicated transit fleet Flexible transportation
Silent product rollover
Developing visibility to a clear view of downstream inventories
2.2.4 Green practices
It is necessary to integrate the organizational environmental management practices into the entire supply chain in order to achieve a sustainable supply chain and maintain competitive advantage (Linton, Klassen, & Jayaraman, 2007; Zhu et al., 2008). The green supply chain management practices should cover all the supply chain activities, from green purchasing to integrate life-cycle management, through to manufacturer, customer, and closing the loop with reverse logistics (Zhu et al., 2008). Table 2.5shows some green SCM practices.
Table 2.5 Green SCM practices.
Green SCM practices
D
is
tr
ibu
to
r Formal policy on green logistics/transport
To invested in vehicles with reduced environmental impacts To work with customers to change product specifications To plan vehicles routes to reduce environmental impacts
Foc
al
Firm
To reduce energy consumption
To reuse /recycling materials and packaging Reverse logistics
ISO 14001 certification
17
S
up
pli
er Green procurement/sourcing
To work with product designers and suppliers to reduce and eliminate product environmental To use recyclable pallet to delivery materials
2.3 Lean, Agile, Resilient and Green SCM Performance
Measurement
Performance measurement is crucial to better SCM (Cagnazzo, Taticchi, & Brun, 2010).To develop an efficient and effective supply chain, it is necessary to assess its performance. . Performance measures should provide the organization an overview of how they and their supply chain are sustainable and competitive (Reichhart & Holweg, 2007). With this task, the entities can check the impact of the strategies/practices implemented and potential opportunities in supply chain management (and points to be improved). Cost, service level (available in the right place at the right time), lead time (A. Agarwal, Shankar, & Tiwari, 2006; Martin Christopher & Towill, 2000; Mason-Jones, Naylor, & Towill, 2000) and quality (of product) may be used as key performance indicators. In each of KPIs we have different metrics that can be used in different levels of the chain. (Susana G. Azevedo et al., 2010b), provides an overview of operational and economical measures that can be used to evaluate the different paradigms on SC‘s performance (see Table 2.6).
Table 2.6 Supply chain performance measures (Susana G. Azevedo et al., 2010b).
Metrics Measures
Ope ra ti ona l P erf orm ance
Quality Customer reject rate In plant defect fallow rate Increment products quality
Customer satisfaction
After-sales service efficiency Rates of customer complaints Out-of-stock ratio
Delivery
On time delivery Delivery reliability
Responsiveness to urgent deliveries
Time
Lead time Cycle times Delivery lead time
Inventory levels
Finished goods equivalent units Level of safety stocks
Order-to-ship E cono m ic al P erf orm a Cost
18
Efficiency Overhead expense Operating expenses
Environmental revenues
Revenues from ‗green‘ products
Recycling revenues
Cost avoidance from environmental action
Environmental costs
Cost of scrap/rework Fines and penalties
Costs for purchasing environmentally friendly materials Disposal costs
Recycling cost = transport + storage costs R & D expenses ratio
E
nvir
on
m
ent
al
P
erf
or
m
ance
Green image Number of fairs/symposiums related to environmentally conscious manufacturing the organization participate
Business wastage
Total flow quantity of scrap
Percentage of materials remanufactured Percentage of materials recycled /re-used Hazardous and toxic material output Solid and liquid wastes
Emissions
Energy consumption Green house gas emissions Air emission
2.4 LARG Supply Chain Management Practices vs. Performance
19
Table 2.7 LARG SCM practices influence on manufacturing supply chain performance (Susana G.Azevedo et al., 2010b).
Supply chain performance
LARG supply chain practices
Operational performance Economic Performance Environmental performance
Inventory
levels QualitysatisfactionCustomer Time Cost Environmental cost cash cycleCash-to- Business wastage
Just in time ↓ ↑ ↓ ↓ ↓
Supplier relationships ↓ ↑ ↓ ↓ ↓
Cycle/setup time reduction ↓ ↓ ↓
Speed in improving responsiveness to
changing market needs ↑ ↓ ↓ ↓
To produce in large or small batches ↓ ↑ ↓
Ability to change delivery times of
supplier‘s order ↓ ↓
Developing visibility to a clear view of upstream inventories and supply conditions
↓ ↑ ↓ ↓
Lead time reduction ↑ ↓
Demand- based management ↓ ↑ ↓
Reduction in the variety of materials
employed in manufacturing the products ↓ ↓ ↓ ↓ To work with product designers and
suppliers to reduce environmental impacts
↑ ↓ ↓
7 3 5 7 5 2 4 5
2.5 Supply Chain Characteristics
20
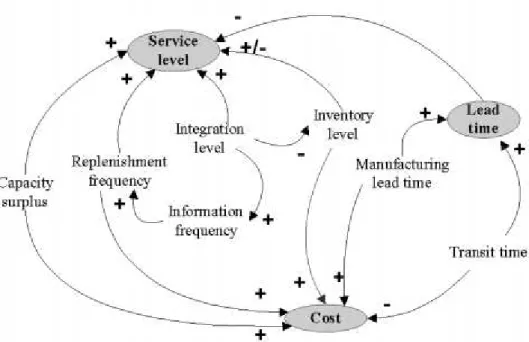
Figure 2.2 – Performance indicators and management characteristics relationships (H. Carvalho &
Machado, 2009).
The causal diagram represented in Fig. 2.1 is used to capture the supply chain dynamics. With this causal scheme, it is possible to visualize how management characteristics affect the performance indicators. A positive link indicates that the two nodes move in the same direction, i.e., if the node in which the link start decreases, the other node also decreases (if all else remains equal). In the negative link, the nodes change in opposite directions, i.e., an increase will cause a decrease in another node (if all else remains equal) (H. Carvalho & Machado, 2009). Reading the diagram should be made as follows: for example, if production lead time increase, lead time and cost will increase (negative effect). There are some relationships between the management characteristics; an increased integration level will reduce the inventory level. This impact will reflect in Lean and Resilient paradigm and/or perhaps in Green. In lean paradigm we should have low inventory level to decrease the carrying cost; contrariwise, if a company has low inventory level, lose their capacity to respond to unexpected disruption. This challenge is be answered by developing the LARG ANP model, according to the enterprise strategies.
The tradeoffs between lean, agile, resilient, and green SCM paradigms must be understood to help companies and supply chains to become more efficient, streamlined, and sustainable. To this end, it is necessary to develop a deep understanding of the relationships (conflicts and commitments) between the lean, agile, resilient, and green paradigms (Fig. 2.1), exploring and researching their contribute for the sustainable competitiveness of the overs production systems in the supply chain, measured by its Cost, Lead Time, Quality (of product) and Service Level (H. Carvalho & Machado, 2009).
21
green paradigms are complemented by each others. According to (H. Carvalho & Machado, 2009), the implementation of these paradigms in the supply chain creates synergies in the way that some supply chain characteristics should be managed, namely, ―information frequency‖, ―integration level‖, ―production lead time‖ and ―transportation lead time‖. However, the impact of each paradigm implementation in the characteristics magnitude may be different. For example, the lean paradigm seeks compulsively the reduction of production and transportation lead times to reducing the total lead time and minimizing the total waste. However, the resilient paradigm, although it prescribes this reduction in lead times, it is not so compulsive, since the objective is to increase the supply chain visibility and capability to respond to unexpected disturbance (H. Carvalho & Machado, 2009).23
Chapter 3 Models for Decision Making
Decision makers generally assume that logical thinking is the best and only way to make good decisions. In doing so they neglect to observe that our mind is both rational and emotional. The rational side is associated with logical and structured reasoning, whereas the emotional side is concerned with feelings intuitions and hunches (Zammori, 2009). According to the great mathematician Henri Lebesgue, making direct comparisons of objects with regard to a property is a fundamental mathematical process for deriving measurements (T. L. Saaty, 2008).
Many people including mathematicians whose thinking is grounded in the use of Cartesian axes based on scales of measurement believe that there is only way to measure things, and it needs a physical measurement scale with a zero and a unit to apply to objects (T. L. Saaty, 2008).We can also derive accurate and reliable relative scales that do not have a zero or a unit by using our understanding and judgments that are the most fundamental determinants of why we want to measure anything (T. L. Saaty, 2008).
Until the introduction of the Analytical Hierarchy Process (AHP) (T. L. Saaty, 1990) and its generalization to dependence and feedback the Analytical Network Process (ANP) (T. L. Saaty, 2005), there were no effective means to combine feelings (hunches) and rationale in a structured and formal mathematical way (Zammori, 2009). According to (Zammori, 2009), now it is possible to make better decisions relying on both spheres of our mind, because the AHP and the ANP are multi-criteria decision-making (MCDM) methods that combine intuition and judgments with reason emphasizing the role of inconsistency in the decision-making process. These methods are based on a multi-criteria measurement theory which provides a general framework to deal with decisions in a structured way (Hou & Su, 2007): (i) by rigorously structuring the problems as a hierarchy or a network of all the factors and the influences among them, and (ii) by establishing the intensities of the influence relations through pairwise comparison judgments. In this manner all the relevant knowledge and intuition that have bearing on a decision are ―scientifically‖ gathered together and it is possible to discover the rationale behind the best choice to be made and understand how quantitative reasoning underlies and guides the decision (Zammori, 2009).