ISSN 0101-2061 Food Science and Technology
DI:
D 10.1590/1678-457X.0037
1 Introduction
Honey is a valuable, complex, healthy natural bee product, and consumed from the ancient time to present. However, food safety is the one of the most important issue of today’s world. The use of antibiotics in apiculture is as old as beginning of 20th century. Although the treatment of honeybees with antibiotics is forbidden in the European Union (EU) and there are no Maximum Residues Limits (MRLs) established in Regulation 37/2010 (European Union, 2009a), sulfonamides, tetracyclines, nitrofurans and macrolides are applied by beekeepers to avoid and to fight diseases (e.g., American foulbrood, European foulbrood, and varroatosis) in honeybees (Kümmerer, 2009; Bargańska et al., 2011). The residues in honey are screened in last five years (2009-2013) data in the Rapid Alarm System for Food and Feed from the Directorate-General for Health and Consumers (RASFF Portal) in honey bee products involved the presence of antimicrobial residues (71%). The found compounds were: sulfonamides (35%), tetracyclines (15%), nitrofurans (13%), lincomycin (13%), aminoglycosides (10%), nitroimidazoles
(8%), macrolides (5%) and quinolones (3%) (Galarini et al., 2015). Thus, development of new methods for fast, easy and cheap analysis of residues in food samples is in high demand for food industry. The cost-effectiveness of analytical study and especially multi-class methods are main issues for residue analysis laboratory. Subsequent liquid/liquid extraction steps, some multi-class methods, the QuEChERS method, reverse phase solid phase extraction and a solid phase purification based on the strong cationic exchange to quantify veterinary drugs in honey are described in literature to date (Debayle et al., 2008; Hammel et al., 2008; Lopez et al., 2008; Martinez-Vidal et al., 2009; Bohm et al., 2012; Gomez-Perez et al., 2012; Wang & Leung, 2012; Galarini et al., 2015).
Tetracyclines were successfully determined by high performance liquid chromatography (HPLC) in the reversed phase mode, with different detection modes, such as ultraviolet (Tylová et al., 2010), fluorescence (Freitas et al., 2010), chemiluminescence (Wan et al., 2005). The liquid-liquid extraction (LLE) (Anderson et al., 2005)
Development of a rapid method for the determination of
antibiotic residues in honey using UPLC-ESI-MS/MS
İbrahim KIVRAK1,2*, Şeyda KIVRAK3, Mansur HARMANDAR4
Received: 09 Oct., 2015 Accepted: 20 Jan., 2016
1 Department of Chemistry and Chemical Treatment Technologies, Muğla Vocational School, Muğla Sıtkı Koçman University, Muğla, Turkey 2 Research Laboratory Center, Food Analysis Laboratory, Muğla Sıtkı Koçman University, Kötekli, Muğla, Turkey
3 Department of Nutrition and Dietetics, Faculty of Health Sciences, Muğla Sıtkı Koçman University, Kötekli, Muğla, Turkey 4 Department of Chemistry, Faculty of Science, Muğla Sıtkı Koçman University, Kötekli, Muğla, Turkey
*Corresponding author: [email protected]
Abstract
An accurate, reliable and fast multianalyte/multiclass ultra-performance liquid chromatography–tandem mass spectrometry (UPLC–MS/MS) method was developed and validated for the simultaneous analysis of 23 pharmaceuticals, belonging to different classes amphenicols, sulfonamides, tetracyclines, in honey samples. The method developed consists of ultrasonic extraction followed by UPLC–ESI–MS/MS with electrospray ionization in both positive mode and negative mode. The influence of the extraction solvents and mobile phase composition on the sensitivity of the method, and the optimum conditions for sample weight and extraction temperature in terms of analyte recovery were extensively studied. The identification of antibiotics is fulfilled by simultaneous use of chromatographic separation using an Acquity BEH C18 (100 mm x 2.1 mm, 1.7 µm) analytical column with a gradient elution of mobile phases and tandem mass spectrometry with an electrospray ionization. Finally, the method developed was applied to the determination of target analytes in honey samples obtained from the local markets and several beekeepers in Muğla, Turkey. Ultrasonic-extraction of pharmaceuticals from honey samples is a well-established technique by UPLC–ESI–MS/MS, the uniqueness of this study lies in the simultaneous determination of a remarkable number of compounds belonging to 23 drug at the sub-nanogram per kilogram level.
Keywords: antibiotics; fast method; honey; UPLC-ESI-MS/MS; chloramphenicol.
and solid-phase extraction (SPE) (Pailler et al., 2009) have been extensively applied to the pretreatment of liquid food samples. However, most of these methods are time consuming and usually toxic due to the use of organic solvents (Yang et al., 2014). Dn the other hand, the isolation of sulfonamides from other honey components was performed by solid phase extraction (SPE) (Kaufmann et al., 2002; Maudens et al., 2004; Thompson & Noot, 2005). Moreover, analysis by liquid chromatography followed by fluorescence or ultra-violet detection systems can give low detection limits (Maudens et al., 2004; Pang et al., 2003; Posyniak et al., 2003; Sheridan et al., 2008)
Recently, the basic advances in developing sensitivity and specifity of food analyses of pharmaceutical residues are due to the novel technology instrument, the application of ultra-performance liquid chromatography with tandem mass spectrometric detection (UPLC–MS/MS), which is more sophisticated technique allows a very effective isolation of analyte ions from the noise-producing matrix. The UPLC–MS/MS produces a high speed of analysis, greater resolution, higher peak capacity and sensitivity (Swartz 2005; Tamošiūnas & Padarauskas, 2008).
In the light of these concerns, the aim of this work was the development of an accurate, reliable and fast multiresidue/multiclass analytical method for simultaneous analysis of a 23 pharmaceuticals widely used in an apiculture.
2 Materials and method 2.1 Chemicals and reagents
Pharmaceutical standards (chloramphenicol, sulfacetamide, sulfadiazine, sulfathiazole, sulfamerazine, sulfameter, sulfamethizole, sulfamethazine, sulfamethoxipyridazine, sulfachloropyridazine, sulfamethoxazole, sulfadimethoxine, sulfisoxazole, sulfadoxine, sulfabenzamide, tetracycline, oxytetracycline, epioxytetracycline, epitetracycline, epichlortetracycline, chlortetracycline, methacycline, doxycycline) were purchase from Dr. Ehrenstorfer GmbH (Wesel, Germany). Acetic acid and formic acid were obtained from Sigma-Aldrich (St. Luis, MD, USA). HPLC-grade water was obtained from Millipore (Darmstadt, Germany) Milli-Q system. LC–MS grade methanol was purchased from Merck Millipore. Each of antibiotic standards was weighted 10 mg with 0.1 mg sensitivity into 50 mL flask and dissolved with methanol separately, and then concentration of stock standards was calculated considering their purity percentages.
2.2 Honey sample extraction
Honey samples were obtained from local markets and several beekeepers in Muğla, Turkey. The samples were stored at room temperature in the dark until analysis. Dne honey sample was checked to be free of any of the targeted antibiotics and it was used as blank honey for calibration curve. Standard antibiotic solutions were prepared individually by dissolving and diluting with methanol.
An aliquot of honey sample (1 g) was weighed into a 10 mL volumetric flask, was dissolved in 0.5% acetic acid in Milli-Q water (10 mL), and then shaken vigorously 3 min, sonicated for 30 min at 50 oC in sweep mode in water-bath (37 kHz, 1000 W,
Elmasonic S120H), centrifuged (Eppendorf 5810R) for 4 min at 4000 rpm. The supernatant was passed through disposable 0.20 µm PTFE membrane filter (Macherey-Nagel Chromafil Xtra PTFE-20/25) to vial, and then the vial was stayed at 10 oC in sample manager department of instrument for the injection to UPLC–ESI–MS/MS.
2.3 UPLC–ESI–MS/MS analysis
The analysis was carried out by UPLC–ESI–MS/MS instrument, consisted of a Waters Acquity Ultra Performance LC with a Waters column manager and heater/cooler, binary system manager, sample manager coupled to a Waters Xevo TQ-S triple quadrupole mass spectrometer equipped with electrospray ionization (ESI) (Waters Acquity Ultra Performance LC, Xevo TQ-S MS/MS, Waters Co., Milford, MA, USA). An Acquity UPLC BEH C18 column (100 mm × 2.1 mm, particle size: 1.7 μm) was held at 40 oC with eluents composed of mobile phase A (0.5% acetic acid in Milli-Q water) and mobile phase B (0.5% acetic acid in methanol). The flow rate was 0.4 mL.min-1. Following gradient program was used: the gradient started with mobile phase A at 100%, then at minute 2 was 20%, reaching 100% at minute 6. After that, the system was left for 2 min to re-equilibrate before the next injection. The triple quadrupole mass spectrometer was Xevo TQ-S MS/MS equipped with an electrospray ionization (ESI) interface. The operating parameters for the mass spectrometer were as follows: capillary voltage was 2.00 kV, source and desolvation temperatures were 150 oC and 500 oC, respectively. Desolvation and cone gas flow were 1000 and 150 L.h-1. The most important parameters of MRM transitions of UPLC–ESI–MS/MS system for the acquisition and identification of the 23 target compounds were summarized in Table 1. Dwell time was 10 ms for all transitions to obtain at least 12 data points across the narrowest peak in the window. Data analysis and quantification were performed using the Waters MassLynx and TargetLynx software, respectively.
The matrix-matched calibration method was used to quantify 23 analytes. Therefore, an 8-point standard curve (including zero) was constructed for each analyte by ploting the peak area of the Multiple Reaction Monitoring (MRM) transitions giving the most intense signal of each analyte versus its nominal concentration. Thus, the blank honey was spiked with standard mixture of analytes at 0, 1, 5, 10, 25, 50, 100, 200 µg.kg-1 concentration levels for the matrix-matched standards.
3 Results and discussion
Analytes of pharmaceuticals were chosen for the basis of their worldwide encounter possibility in honey.
parent ions and the collision energy for which each one gave the highest abundance. These parameters are later used to constitute MRM method, summarized in Table 1.
The sample preparation of honey samples was very simple and fast with good recoveries of the target compounds. A sample extraction method, described in section 2, has been successfully applied in this study. It included an ultrasonic extraction with water consisting acetic acid and injection to UPLC system with no additional SPE treatments.
The mobile phase and extraction solvents (acetic acid and formic acid), sample weight (0.1, 1 and 5 mg), and extraction temperatures (30, 50 and 80 oC) were investigated to determine the best extraction efficiency. Dptimal extraction was achieved with 1 mg of sample extracted with acetic acid in water in an ultrasonic bath at 50 oC.
Acetic acid in water provided efficient extraction for all 23 analytes. Acetic acid was used to disassociate sugar-bound sulfonamides in honey. Application of water-bath in sweep mode, microprocessor-controlled function of the water-bath, for 30 min at 50 oC gave rise to blend and homogenize the mixture for the ultrasonic extraction. In this sample treatment system there was not used any clean-up step, solid-phase extraction. The use of matrix-matched standards ensured correct quantification of the honey samples.
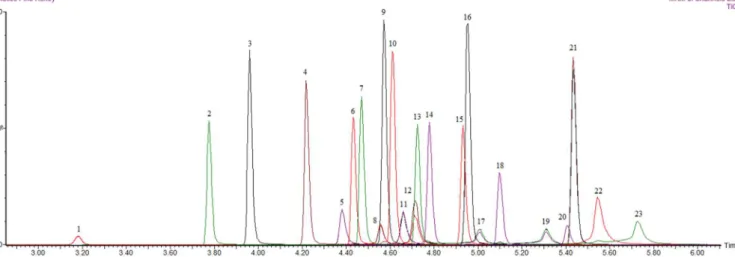
Detection was performed with tandem mass spectrometry and using the multiple reaction monitoring mode. Mass spectra were acquired in the positive and negative electrospray ionization (ESI) mode, and the multiple reaction monitoring was used to monitor the transitions of quantifier ions to qualifier ions (the parent > daughter ion transitions, m/z). Confirmation of compounds was achieved through two or more daughter ions for each of pharmaceuticals. And the results of the study were executed by a matrix-matched calibration curve; it was constructed between 0 to 200 µg.kg-1 levels. The matrix-matched curves were linear in the range investigated. Correlation coefficients were minimum 0.99 for each of antibiotics. Although the use of veterinary drugs is not authorized in the EU legislation in apiculture, and in this study two MRM transitions or more as at least four identification points were used. Total ion chromatograms of 10 µg.kg-1 level of matrix-match calibration curve were shown in Figure 1.
The limit of determination (LoD) of sulfonamide group of antibiotics was ranged from 0.15 to 0.54 µg.kg-1, and the limit of quantitation (LoQ) was ranged from 0.26 to 0.90 µg.kg-1, sulfacetamide and sulfisoxazole, respectively. LoD of tetracycline group of antibiotics was evaluated as 0.14 and 0.35 µg.kg-1, and LoQ of this group was found between 0.24 and 0.58 µg.kg-1, epitetracycline and epioxytetracycline, respectively. LoD and LoQ of chloramphenicol were observed 0.16 to 0.27 µg.kg-1 honey, respectively. Thus, the obtained limit of determination and the limit of quantitation values were respectively lower Table 1. Summary of multiple reaction monitoring parameters for all compounds determined.
Parent ion (m/z)
1º daughter ion (m/z)
Cone voltage (V)
2º daughter ion (m/z)
3º daughter ion (m/z)
Collision
(V) ESI
RT (min)
Amphenicols
Chloramphenicol 305.0 165.0 25 258.0 275.0 20,20,12 + 5.41
Tetracyclines
Tetracycline 445.4 154.0 22 410.2 427.0 26,20,18 + 4.66
Epichlortetracycline 479.2 444.2 31 462.2 22,15 + 5.01
Epioxytetracycline 461.3 426.2 19 444.2 19,16 + 4.56
Epitetracycline 445.3 410.2 25 427.2 19,15 + 4.38
Doxycycline 445.2 154.0 25 428.2 28,20 + 5.73
Chlortetracycline 479.3 444.2 27 462.2 20,18 + 5.31
Dxytetracycline 461.2 426.2 22 443.1 19,13 + 4.72
Methacycline 443.0 201.0 28 381.0 426.0 25,20,16 + 5.55
Sulfonamides
Sulfadimethoxine 311.1 92.0 28 156.0 245.0 32,20,12 + 5.44
Sulfamethazine 279.1 92.0 30 124.0 186.0 28,20,16 + 4.58
Sulfamerazine 265.0 92.0 26 156.0 172.0 28,15,17 + 4.22
Sulfamethoxipyridazine 281.1 92.0 27 126.0 156.0 30,18,15 + 4.61
Sulfadoxine 311.0 92.1 27 108.0 156.0 32,28,15 + 4.95
Sulfathiazole 256.0 92.1 23 108.0 156.0 25,23,15 + 3.96
Sulfameter 281.0 156.0 20 215.0 26,26 + 4.43
Sulfacetamide 215.0 92.0 17 108.0 156.0 22,18,12 + 3.18
Sulfadiazine 251.0 92.0 25 156.0 27,15 + 3.77
Sulfamethoxazole 254.0 92.0 25 156.0 26,16 + 4.78
Sulfisoxazole 268.0 92.0 22 156.0 28,13 + 4.93
Sulfamethizole 271.0 92.0 19 156.0 30,15 + 4.47
Sulfabenzamide 277.0 108.0 13 156.0 22,15 + 5.10
than 0.14 and 0.90 µg.kg-1. These values were lower than the recommended concentration or action limits fixed by the European Union (Center for Research Libraries, 2007; Galarini et al., 2015). And also recovery (trueness) percentages obtained for the method were highly satisfactory. By comparison of peak areas at 10, 50, 100 µg.kg-1 spike concentrations, between solution of individual standard analytes and honey sample spiked with analyte mixture, average recoveries were measured between 81.3 to 99.1%, which also satisfied the requirement for regulation (European Union, 2009a). Dverall recoveries were expressed in Table 2. The highest recovery obtained among sulfonamide group antibiotics was sulfamethizole as 86.8%, and among tetracycline group antibiotics was tetracycline 99.1%, and for chloramphenicol 87.7%.
However, honey samples were analyzed for intra-day and inter-day precision study at 3 levels of spike concentrations 10, 50, 100 µg.kg-1. The excellent precision percentages were maintained for intra-day and inter-day analysis in Table 3. With respect to Council Directive 657 EC in 2002 (European Union, 2002), coefficients of variation (CV) of analysis of a method shall require to be below 30% for 1-10 µg.kg-1 concentration level. After the method validation of this study, intra-day CV % was found between 2.16-10.69%, and inter-day CV % was 5.25-26.34% at 10 µg.kg-1 concentration level. Moreover, in the intra-day and inter-day analysis, the lowest precision percentages obtained for tetracycline as 0.88 and 2.18% at 50 µg.kg-1 level, respectively, among tetracycline group antibiotics. Dn the other hand, among sulfonamide group antibiotics, the lowest precision percentages of the intra-day and inter-day analysis were produced by sulfathiazole as 1.99% at 50 µg.kg-1 level and 4.87% at 50 µg.kg-1 level. Precision of chloramphenicol was below 8% for intra-day and below 19% for inter-day. According to European Commission (EC) concerning the performance of analytical methods and the interpretation of precision results, % precision of studied antibiotics were thoroughly acceptable, which is 20% for concentration range ≥ 10 µg/kg ≤ 100 µg.kg-1 (European Union, 2002).
As honey has no maximum residue levels (MRLs) for the studied antibiotics, the European Commission (Regulation (EC) No 470/2009) (European Union, 2009b) states that if antibiotic residue is present, it must be below the limit of quantitation Figure 1. Total ion chromatograms of 10 µg.kg-1 level of matrix-match calibration curve. (1) Sulfacetamide, (2) Sulfadiazine, (3) Sulfathiazole,
(4) Sulfamerazine, (5) Epitetracycline, (6) Sulfameter, (7) Sulfamethizole, (8) Epioxytetracycline, (9) Sulfamethazine, (10) Sulfamethoxipyridazine, (11) Tetracycline, (12) Dxytetracycline, (13) Sulfachloropyridazine, (14) Sulfamethoxazole, (15) Sulfisoxazole, (16) Sulfadoxine, (17) Epichlortetracycline, (18) Sulfabenzamide, (19) Chlortetracycline, (20) Chloramphenicol, (21) Sulfadimethoxine, (22) Methacycline, (23) Doxycycline.
Table 2. The limit of determination (LoD), the limit of quantitation (LoQ) and average recovery of the method.
LoD (µg.kg-1)
LoQ (µg.kg-1)
Average Recovery
(%)
Amphenicols
Chloramphenicol 0.16 0.27 87.7
Tetracyclines
Tetracycline 0.24 0.41 99.1
Dxytetracycline 0.25 0.42 94.7
Epioxytetracycline 0.35 0.58 96.0
Epichlortetracycline 0.25 0.42 92.8
Chlortetracycline 0.21 0.35 89.2
Methacycline 0.30 0.50 90.5
Epitetracycline 0.14 0.24 93.8
Doxycycline 0.24 0.39 90.9
Sulfonamides
Sulfacetamide 0.15 0.26 81.3
Sulfadiazine 0.49 0.82 86.2
Sulfamethoxazole 0.19 0.32 85.3
Sulfamerazine 0.35 0.59 86.1
Sulfisoxazole 0.54 0.90 86.3
Sulfamethizole 0.49 0.81 86.8
Sulfabenzamide 0.20 0.33 86.1
Sulfamethazine 0.30 0.50 86.2
Sulfachloropyridazine 0.51 0.84 85.3
Sulfadimethoxine 0.35 0.59 86.0
Sulfathiazole 0.31 0.52 86.6
Sulfameter 0.26 0.44 86.3
Sulfamethoxipyridazine 0.17 0.28 86.1
according to the analytical method used. Although this limit varies between laboratories and that there is no legislation or official recommendation, in this study the target limit considered was below 1 µg.kg-1, yet the tolerated level found in the literature in Europe differs (Juan-Borrás et al., 2015; Muňoz de la Peňa et al., 2007; Sajid et al., 2013).
For the analysis of real samples: The applicability of the method was evaluated by analyzing pine honey samples from Muğla.
In honey samples, five of twenty-three analytes, were detected. The maximum concentrations were detected, in honey samples, for the sulfonamides drug sulfamethazine (647 µg.kg-1) and for the tetracyclines drug tetracycline, epitetracycline, oxytetracycline, and epioxytetracycline (968, 197, 743, 158 µg.kg-1, respectively). Sulfamethazine is one of the most encountered drugs in honey samples worldwide and Turkey, too. Figure 2 displayed total ion chromatogram of one of the pine honey sample, in which 5 pharmaceuticals were detected.
Figure 2. Total ion chromatogram of pharmaceutical residues, detected in pine honey sample.
Table 3. Intra-day and inter-day precision percentage data at spiking levels of 10, 50, 100 µg.kg-1 for each of antibiotics.
Intra-day precision CVr (%)a Inter-day precision CV
R (%)
a
10 µg.kg-1 50 µg.kg-1 100 µg.kg-1 10 µg.kg-1 50 µg.kg-1 100 µg.kg-1
Amphenicols
Chloramphenicol 5.11 7.63 5.49 12.49 18.70 13.79
Tetracyclines
Tetracycline 3.80 0.88 3.43 9.26 2.18 8.39
Dxytetracycline 4.87 3.38 3.75 11.73 8.26 9.11
Epioxytetracycline 4.10 3.37 4.49 9.77 8.39 10.90
Epichlortetracycline 6.92 6.78 3.91 16.87 16.42 9.55
Chlortetracycline 8.58 1.30 2.66 20.67 3.22 6.49
Methacycline 4.09 2.48 4.49 9.99 6.05 10.89
Epitetracycline 3.58 1.46 3.01 8.69 3.58 7.41
Doxycycline 10.69 2.28 4.47 26.34 5.53 10.85
Sulfonamides
Sulfacetamide 2.64 2.65 3.40 6.45 6.50 8.35
Sulfadiazine 3.40 2.61 2.71 8.26 6.41 6.65
Sulfamethoxazole 3.15 3.14 4.35 7.62 7.69 10.67
Sulfamerazine 2.21 2.91 3.13 5.42 7.14 7.66
Sulfisoxazole 3.00 3.32 4.05 7.31 8.13 9.89
Sulfamethizole 3.73 2.91 3.32 9.11 7.16 8.14
Sulfabenzamide 4.06 2.35 3.32 9.89 5.74 8.09
Sulfamethazine 3.21 2.78 3.10 7.76 6.86 7.59
Sulfachloropyridazine 3.92 3.60 2.97 9.50 8.79 7.24
Sulfadimethoxine 3.53 2.73 1.89 8.57 6.72 4.61
Sulfathiazole 2.16 1.99 2.92 5.25 4.87 7.17
Sulfameter 3.82 3.10 3.36 9.35 7.60 8.20
Sulfamethoxipyridazine 2.81 3.76 3.67 6.86 9.24 8.99
Sulfadoxine 3.61 2.33 3.22 8.71 5.66 7.84
a Coefficients of variation calculated in repeatability (CV
4 Conclusion
In conclusion, an accurate, reliable, fast, and sensitive UPLC–ESI–MS/MS method for simultaneous analysis of 23 pharmaceuticals, belonging to three different classes -amphenicols, sulfonamides, tetracyclines- in honey was developed. Sugars bonded to pharmaceuticals in honey were quickly and successfully removed with the waste adjustment of binary system manager. A fast, time effective, and simple sample preparation method was performed in approximately 35 min., and instrumental run time was only 8 min.
The method developed consists of an ultrasonic extraction, appreciably simplifying sample preparation. A thorough optimization of the UPLC–MS/MS parameters (mass spectra, mobile phase optimization) was performed, resulting in maximum sensitivity, selectivity, and recoveries of the target compounds.
Results show that the method is accurate, fast, reliable, and reproducible, and meets the requirement for the EU regulation for honey.
The developed procedure by having low decision limits is quite consistent with actual amounts in real samples in the markets. This method exhibits useful and necessary analytical characteristics for the determination of pharmaceutical residues in honey samples, and enables food safety. In this method, the simple sample treatment and use of UPLC allowed a large number of samples to be processed per day for food and laboratory sectors.
References
Anderson, C. R., Rupp, H. S., & Wu, W. H. (2005). Complexities in tetracycline analysis – hemistry, matrix extraction, cleanup, and liquid
chromatography. Journal of Chromatography. A, 1075(1-2), 23-32.
http://dx.doi.org/10.1016/j.chroma.2005.04.013. PMid:15974114. Bargańska, Z., Ślebioda, M., & Namieśnik, J. (2011). Determination of
antibiotic residues in honey. Trends in Analytical Chemistry, 30(7),
1035-1041. http://dx.doi.org/10.1016/j.trac.2011.02.014.
Bohm, D. A., Stachel, C. S., & Gowik, P. (2012). Validation of a multi-residue method for the determination of several antibiotic groups
in honey by LC-MS/MS. Analytical and Bioanalytical Chemistry,
403(10), 2943-2953. http://dx.doi.org/10.1007/s00216-012-5868-z. PMid:22367248.
Center for Research Libraries. (2007, December 7). CRL guidance paper:
CRLs view on state of the art analytical methods for national residue
control plans (pp. 1-8). Chicago: CRL.
Debayle, D., Dessalces, G., & Grenier-Loustalot, M. F. (2008). Multi-residue of traces of pesticides and antibiotics in honey by
HPC-MS-MS. Analytical and Bioanalytical Chemistry, 391(3), 1011-1020.
http://dx.doi.org/10.1007/s00216-008-2003-2. PMid:18425645. European Union. Commission of the European Communities. (2002,
August 12). Implementing Council Directive 96/23/EC concerning
the performance of analytical methods and the interpretation of
results. Official Journal of the European Union.
European Union. European Commission. (2009a, December 22).
Pharmacologically active substances and their classification regarding maximum residue limits in foodstuffs of animal origin
(Commission Regulation (EU) no 37/2010). Official Journal of the
European Communities.
European Union. European Parliament. (2009b, May 6). Laying down
Community procedures for the establishment of residue limits of
pharmacologically active substances in foodstuffs of animal origin, repealing Council Regulation (EEC) No 2377/90 and amending Directive 2001/82/EC of the European Parliament and of the Council and Regulation (EC) No 726/2004 of the European Parliament
and of the Council (Regulation (EC) no 470/2009). Official Journal
of the European Union. Retrieved from http://eur-lex.europa.eu/
LexUriServ/LexUriServ.do?uri=DJ:L:2009:152:0011:0022:en:PDF Freitas, D. F., Porto, C. E. D., Vieira, E. P., & Siqueira, M. E. P. B. (2010).
Three-phase, liquid-phase microextraction combined with high performance liquid chromatography-fluorescence detection for the simultaneous determination of fluoxetine and norfluoxetine in
human plasma. Journal of Pharmaceutical and Biomedical Analysis,
51(1), 170-177. http://dx.doi.org/10.1016/j.jpba.2009.07.017. PMid:19683889.
Galarini, R., Saluti, G., Giusepponi, D., Rossi, R., & Moretti, S. (2015).
Multiclass determination of 27 antibiotics in honey. Food Control,
48, 12-24. http://dx.doi.org/10.1016/j.foodcont.2014.03.048. Gomez-Perez, M. L., Plaza-Bolanos, P., Romero-Gonzales, R.,
Martinez-Vidal, J. L., & Garrido-Frenich, A. (2012). Comprehensive qualitative and quantitative determination of pesticides and veterinary drugs in honey using a liquid chromatography-Drbitrap high resolution
mass spectrometry. Journal of Chromatography. A, 1248, 130-138.
http://dx.doi.org/10.1016/j.chroma.2012.05.088. PMid:22721762. Hammel, Y., Mohamed, R., Gremaud, E., LeBreton, M., & Guy, P.
A. (2008). Multiscreening approach to monitor and quantify 42 antibiotic residues in honey by liquid chromatography-tandem
mass spectrometry. Journal of Chromatography. A, 1177(1), 58-76.
http://dx.doi.org/10.1016/j.chroma.2007.10.112. PMid:18054364. Juan-Borrás, M., Periche, A., Domenech, E., & Escriche, I. (2015).
Routine quality control in honey packaging companies as a key to guarantee consumer safety. The case of the presence of sulfonamides
analyzed with LC-MS-MS. Food Control, 50, 243-249. http://dx.doi.
org/10.1016/j.foodcont.2014.08.021.
Kaufmann, A., Roth, S., Ryser, B., Widmer, M., & Guggisberg, D. (2002). Quantitative LC/MS-MS determination of sulfonamides and some
other antibiotics in honey. Journal of AOAC International, 85(4),
853-860. PMid:12180678.
Kümmerer, K. (2009). Antibiotics in the aquatic environment – A review
– Part I. Chemosphere, 75(4), 417-434. http://dx.doi.org/10.1016/j.
chemosphere.2008.11.086. PMid:19185900.
Lopez, M. I., Pettis, J. S., Smith, I. B., & Chu, P. S. (2008). Multiclass determination and confirmation of antibiotic residues in honey
using LC-MS/MS. Journal of Agricultural and Food Chemistry, 56(5),
1553-1559. http://dx.doi.org/10.1021/jf073236w. PMid:18257525. Martinez-Vidal, J. L., Aguilera-Luiz, M. M., Romero-González, R., &
Frenich, A. G. (2009). Multiclass analysis of antibiotic residues in honey by ultraperformance liquid chromatography-tandem mass
spectrometry. Journal of Agricultural and Food Chemistry, 57(5),
1760-1767. http://dx.doi.org/10.1021/jf8034572. PMid:19195999. Maudens, K. E., Zhang, G., & Lambert, W. E. (2004). Quantitative
analysis of twelve sulfonamides in honey by high-performance liquid chromatography with post-column derivitization and fluorescence
detection. Journal of Chromatography. A, 1047, 85-92. http://dx.doi.
org/10.1016/j.chroma.2004.07.007. PMid:15481463.
Muňoz de la Peňa, A., Mora Diez, N., Mahedero García, M. C., Bohoyo Gil, D., & Caňada-Caňada, F. (2007). A chemometric sensor for
determining sulphaguanidine residues in honey samples. Talanta,
73(2), 304-313. http://dx.doi.org/10.1016/j.talanta.2007.03.047. PMid:19073032.
egg and honey. Chromatographia, 67(9/10), 783-788. http://dx.doi. org/10.1365/s10337-008-0579-5.
Thompson, T. S., & Noot, D. K. (2005). Determination of sulfonamides in honey by liquid chromatography–tandem mass spectrometry.
Analytica Chimica Acta, 551(1-2), 168-176. http://dx.doi.org/10.1016/j.
aca.2005.03.077.
Tylová, T., Dlšovsk, J., Novák, P., & Flieger, M. (2010). High-throughput analysis of tetracycline antibiotics and their epimers in liquid hog manure using Ultra Performance Liquid Chromatography with
UV detection. Chemosphere, 78(4), 78353-78359. http://dx.doi.
org/10.1016/j.chemosphere.2009.11.020. PMid:20004932. Wan, G. H., Cui, H., Zheng, H. S., Zhou, J., Liu, L. J., & Yu, X. F.
(2005). Determination of tetracyclines residues in honey using high-performance liquid chromatography with potassium permanganate–sodium sulfite–β-cyclodextrin chemiluminescence
detection. Journal of Chromatography. B, Analytical Technologies
in the Biomedical and Life Sciences, 824(1-2), 57-64. http://dx.doi.
org/10.1016/j.jchromb.2005.06.039. PMid:16009603.
Wang, J., & Leung, D. (2012). The challenges of developing a generic extraction procedure to analyse multi-class veterinary drug residue in milk and honey using ultra-high pressure liquid chromatography
quadrupole time-of-flight mass spectrometry. Drug Testing and
Analysis, 4(Suppl 1), 103-111. http://dx.doi.org/10.1002/dta.1355.
PMid:22851366.
Yang, X., Zhang, S., Yud, W., Liu, Z., Lei, L., Li, N., Zhang, H., & Yu, Y. (2014). Ionic liquid-anionic surfactant based aqueous two-phase extraction for determination of antibiotics in honey by
high-performance liquid chromatography. Talanta, 124, 1-6. http://dx.doi.
org/10.1016/j.talanta.2014.02.039. PMid:24767438. mass spectrometry analysis of sulfonamides, tetracyclines, analgesics
and hormones in surface water and wastewater in Luxembourg. The
Science of the Total Environment, 407(16), 4736-4743. http://dx.doi.
org/10.1016/j.scitotenv.2009.04.042. PMid:19477484.
Pang, G., Cao, Y., Fan, C., Zhang, J., Li, X., & Jia, G. (2003). Liquid chromatography-fluorescence detection for simultaneous analysis
of sulfonamide residues in honey. Analytical and Bioanalytical
Chemistry, 376(4), 534-541.
http://dx.doi.org/10.1007/s00216-003-1883-4. PMid:12739095.
Posyniak, A., Zmudzki, J., Niedzielska, J., & Sniegocki, T. (2003). Grzebalska, A. Sulfonamide residues in honey. Control and
development of analytical procedure. Apiacta, 38, 249-256.
Sajid, M., Na, N., Safdarb, M., Lu, X., Ma, L., Hec, L., & Duyanga, J. (2013). Rapid trace level determination of sulfonamide residues in honey with online extraction using short C-18 column by high-performance liquid chromatography with fluorescence detection.
Journal of Chromatography. A, 1314, 173-179. http://dx.doi.
org/10.1016/j.chroma.2013.09.020. PMid:24055224.
Sheridan, R., Policastro, B., Thomas, S., & Rice, D. (2008). Analysis and occurrence of 14 sulfonamide antibacterials and chloramphenicol in honey by solid-phase extraction followed by LC/MS/MS analysis.
Journal of Agricultural and Food Chemistry, 56(10), 3509-3516. http://
dx.doi.org/10.1021/jf800293m. PMid:18433136.
Swartz, M. E. (2005). UPLC™: an introduction and review. Journal of
Liquid Chromatography & Related Technologies, 28(7-8), 1253-1263.
http://dx.doi.org/10.1081/JLC-200053046.