The case of the defence sector
Toma´s B. Ramos
a,, Ineˆs Alves
a, Rui Subtil
a, Joa˜o Joanaz de Melo
b aFaculty of Marine and Environmental Sciences, University of the Algarve, Campus de Gambelas, 8000-117 Faro, PortugalbDepartment of Environmental Sciences and Engineering, Faculty of Sciences and Technology, New University of Lisbon, 2829-516 Caparica, Portugal
Received 20 September 2004; received in revised form 27 December 2005; accepted 29 December 2005 Available online 30 March 2006
Abstract
The development of environmental performance policy indicators for public services, and in particular for the defence sector, is an
emerging issue. Despite a number of recent initiatives there has been little work done in this area, since the other sectors usually focused
on are agriculture, transport, industry, tourism and energy. This type of tool can be an important component for environmental
performance evaluation at policy level, when integrated in the general performance assessment system of public missions and activities.
The main objective of this research was to develop environmental performance policy indicators for the public sector, specifically applied
to the defence sector. Previous research included an assessment of the environmental profile, through the evaluation of how
environmental management practices have been adopted in this sector and an assessment of environmental aspects and impacts. This
paper builds upon that previous research, developing an indicator framework—SEPI—supported by the selection and construction of
environmental performance indicators. Another aim is to discuss how the current environmental indicator framework can be integrated
into overall performance management. The Portuguese defence sector is presented and the usefulness of this methodology demonstrated.
Feasibility and relevancy criteria are applied to evaluate the set of indicators proposed, allowing indicators to be scored and indicators
for the policy level to be obtained.
r
2006 Elsevier Ltd. All rights reserved.
Keywords:Public services; Environmental performance policy indicators; Defence sector
1. Introduction
There are significant differences between public sector
organizations and the private sector, particularly at
organizational and functional levels, with their specific
policies, goals, objectives, targets, products and services.
Public organizations must provide responses to the needs
of society that are not covered by the private sector. As
stated by
Boland and Fowler (2000)
, in the public service
there is no profit maximization focus, little potential for
income generation and generally no bottom line against
which financial performance can ultimately be measured.
The majority of public organizations still generate most of
their income from the state and have to account to several
stakeholders.
Within the public sector there are several types of public
organization such as: central and local government
departments, agencies, trading funds and public
corpora-tions. Public sector organizations pursue political and
social goals rather than simple commercial objectives. In
the private sector, there are sole traders, partnerships,
co-operatives and private and public limited companies. There
are also hybrid organizations such as jointly owned
enterprises where the government retains a share of
ownership. According to
Carter et al. (1992)
it is surely
better to dispense with the public/private dichotomy and
regard ownership as a continuum ranging from the pure
government department to the individual entrepreneur.
Much performance assessment transcends the public/
private distinction and reflects characteristics which cut
across this particular divide.
Corresponding author. Tel.: +351 289800900x7235;
fax: +351 289818353.
Many public organizations produce services instead of
products. The greatest experience with environmental
management tools has been in business, and especially
industry. Environmental management tools have been
most often applied to manufacturing industries and
tangible products. Beyond the traditional manufacturing
sector, there is the need to go further and address their
application to services, an underdeveloped and
under-researched area of corporate environmental management
(
Welford et al., 1998
). The typical differences stated in the
work mentioned, between manufacturing industry and the
service industry, can also be used to characterize public
services, namely: (i) services are intangible (whereas
manufactured goods are concrete); (ii) most services consist
of acts and interaction; and (iii) the production and
consumption of a service cannot always be kept apart.
The particular case of the defence sector is characterized by
its complexity, with its numerous personnel and many
facilities and activities with, in turn, their numerous
products and services. The different branches, i.e. the
navy, army and air force, and the entire administrative
sector carry out their missions. The main task of a
country’s armed forces is to defend and protect its
sovereignty and interests. Due to the nature of its missions
and activities, defence has an important social role and also
has great potential to harm or benefit the environment in a
highly visible manner. Compared to other government
domains, defence services potentially have more significant
environmental impacts than other public institutions.
The integration of environmental and sustainable
devel-opment considerations into policy sectors and economic
activities is one of most challenging targets at an
international level. As stated by
Hertin et al. (2001)
, in
already difficult and contested areas of policy there is a risk
that environmental and sustainable development is
side-lined as a worthy, but intractable objective. When public
policy needs to be increasingly flexible, responsive and
co-operative, integration needs to be achieved by efficiency.
Policy indicators are one possible way of ensuring that
sustainability issues are being consistently and
transpar-ently considered in public policy. Indicators provide
performance measurement, reporting and communication
to stakeholders. Providing a coherent common framework
for sector-environment integration indicators is a
Eur-opean goal and is becoming a reality in several sectors,
such as transport, enterprise and agriculture. Despite their
social, environmental and economic importance, the public
sector overall and defence are often omitted in
sector-environment integration approaches and studies.
There are many different kinds of frameworks for
evaluating environmental and sustainability performance.
Examples are the work carried out by
Global Reporting
Initiative (GRI) (2002)
,
Melo and Pegado (2002)
,
Tyteca et
al. (2002)
,
Dias-Sardinha and Reijnders (2001)
,
Wehrmeyer
et al. (2001)
,
Bennett and James (1999b)
,
Young and
Welford (1998)
,
Epstein and Young (1998)
,
Johnson
(1998)
,
Ditz and Ranganathan (1997)
and
Azzone et al.
(1996)
, with particular focus on the organization level
(profit or not-for-profit, private or public); at the sector
level,
Berkhout et al. (2001)
for industry,
United States
Environmental Protection Agency (USEPA) (1999)
for
transport, and EEA (2000b) for various sectors
(agricul-ture, transport, industry, energy and households) also
developed performance frameworks. Despite the diversity
of methods and tools for measuring environmental
performance, indicators almost always play a central role.
To assure that environmental performance indicators
(EPIs) serve the purpose for which they are intended and
to control the way they are specifically selected and
developed, it is important to organize them into a
framework. These frameworks can just focus on indicators
or be integrated into broader performance assessment
approaches, as happens with some of those mentioned
above. Such diversity in environmental indicator
frame-works, as shown by
Hodge (1997)
and
Ramos et al.
(2004c)
, is leading to increased difficulty in comparing
organizations, sectors and countries and is contributing to
a rather confusing and not very well established
terminol-ogy, in contrast to the case with financial performance.
In addition, various authors make a contribution to
defining the state of the art in EPIs for organizations, in
particular at company level (e.g.
Olsthoorn et al., 2001
;
Johnston and Smith, 2001
;
Bennett and James, 1999a
;
Ranganathan, 1998
;
Young and Welford, 1998
;
Callens
and Tyteca, 1995
;
Tyteca, 1996
; and
Young, 1996
), which
shows the important progress achieved. The development
of EPIs has evolved from pressure indicators, reporting on
physical amounts based on inputs/outputs (e.g. air
emis-sions, waste production or energy use), to the inclusion of
the state of the environment and environmental impacts, as
reported by
Johnston and Smith (2001)
and
Olsthoorn
et al. (2001)
. The drive to measure corporate environmental
performance is the product of several factors, in particular
compliance with legislation, image and reputation
en-hancement and stakeholder pressure, among others.
Despite the different scope, the major driving forces for
business are applicable to public sector organizations, with
some exceptions such as market strategy or shareholder
pressure.
Although the measurement of performance in the public
sector is relatively new, an important amount of literature
on performance management has developed since the late
1970s (
Boland and Fowler, 2000
). Public sector
environ-mental performance integrated into overall performance
management is substantially new, with little literature
available.
among similar public sector areas, at a national or
international level. These environmental indicators
repre-sent highly aggregated information which should be used
like socio-economic indicators, gross domestic product
(GDP), the inflation rate or the unemployment rate. For
sectoral purposes headline indicators can be decomposed.
Therefore, sector-specific indicators have to be added, since
such aggregated information may not be sufficiently
comprehensive for policy analysis and management (
Eur-opean Environment Agency (EEA), 1999
).
The main objective of this research was to present a
conceptual indicator framework and a set of EPPIs for the
Portuguese defence sector. The main purpose of these
indicators is to evaluate sectoral environmental
perfor-mance, including the results of public policies and
strategies, mandatory regulations and voluntary practices
or standards. This study aims to contribute to the ongoing
debate about indicator frameworks for sector-environment
integration. Previous research includes an assessment of the
environmental profile, through the evaluation of how
environmental management practices have been adopted
in the sector and an assessment of the main military
activities (
Ramos and Melo, 2005, 2006
). It also includes an
assessment of environmental aspects and impacts (
Ramos
et al., 2004a
). This work builds upon that previous
research, developing an indicator framework supported
by the selection and construction of EPIs. Another aim is
to discuss how current environmental indicator
frame-works can be integrated into overall performance
manage-ment.
The
indicators
obtained
should
give
the
comprehensive support necessary to drive sectoral
environ-mental performance evaluation.
2. Overview of the experience with environmental indicators
in the public and defence sectors
Despite several initiatives on sector-environment
inte-gration indicators (e.g.
Hertin et al., 2001
;
European
Environment Agency (EEA), 2000a, b
;
Organization for
Economic Co-operation and Development (OECD), 1999
;
USEPA, 1999
), centered on pressure indicators, there are
relatively few programmes of EPIs applied to the public
sector overall or to the defence sector in particular. This is
emphasized by a general dearth of scientific literature in
this domain.
Nevertheless, some initiatives are presented here as
examples of the ongoing work that is being carried out
around the world.
Tables 1 and 2
present an overview of
environmental indicator systems applied to the public and
defence sectors, respectively. The tables are based on
chronological development and coverage: (i) the indicator
framework; (ii) the indicators’ primary objective; (iii) the
number of indicators; (iv) the assessment target that they
focus on (only for the defence sector).
The indicator initiatives in the public sector demonstrate
that this domain is quite new around the world, despite
several important examples, namely in the United
King-dom and Canada. Environmental performance
measure-ment is just one component of the strategies for greening
government or sustainable development in government
operations and the public sector overall. In the systems
presented the number of EPIs range from 5 to 82, showing
the great diversity of objectives and approaches and the
generally poor methodological consensus in this emergent
domain.
As with the public sector overall, defence indicator
systems show a significant range of diversity, with the
number of environmental indicators ranging from 2 to 60.
They are supported by different methodological
frame-works, namely the Balanced Scorecard, ISO 14031,
Pressure-State-Response and Leading-Lagging. Though
some examples of environmental indicators are integrated
in a broader approach to performance management for
defence services (including social, environmental,
econom-ic/financial performance aspects), the majority are isolated
environmental performance frameworks. Most of the
examples presented show that sectoral environmental
performance evaluation, measurement and reporting are
the main objectives. Much of the work carried out does not
use a well defined indicator framework with different
categories, but rather just develops an ad hoc list of
indicators without any particular methodological
proce-dure.
3. Development of the conceptual framework
The development of EPIs for the defence sector faces
additional problems and challenges. Defence activities cut
across many sectors, e.g. transport, energy, industry and
agriculture, among others, and lead to environmental
interaction that reflects these links. Furthermore, the
organizational complexity and the large dimension (area
of land, personnel, equipment and infrastructure) of this
sector are also important considerations to take into
account. Due to these characteristics, establishing what
to evaluate is one of the main tasks. It is very important to
ascertain what environmental impacts can be assigned to
defence organizations, defining the borders of the sector’s
environmental influence. It is necessary to clarify these
limits to avoid double accounting between different
economic sectors. Evaluating the integration of
environ-mental issues into sector policies, including management
practices, is also a hard task. As stressed by
Carter et al.
(1992)
, it is a recognized problem that the outcome of a
Table 1
Environmental indicator initiatives in the Public Sector
Author/year Framework name: indicator categories Primary objectives/comments Number of
indicators
United States
Environmental Protection Agency (1996)
Compliance indicators To assess environmental compliance at federal
facilities. Standard indicators measure changes in compliance for the various programs in the same way the consumer price index measures changes in the rate of inflation relative to a given base year. Compliance indicators are intended to measure the level of relatively serious non-compliance at major federal facilities.
5
United Kingdom Government (1997)
Greening Government The initiative was created in 1997. The Greening
Government initiative therefore represents an attempt to mainstream the environment across the entire work of government, incorporating environmental objectives in operational aspects of departmental performance but also greening the fundamental objectives of departments by ensuring that full weight is given to environmental impacts in policy appraisal and development. Its objective is to contribute to the government’s annual report on sustainable development, including indicators on green government operations.
Not available
PMSGO (1999) Environmental Performance Measurement for
Sustainable Government operations
To assist Canadian federal departments/agencies in proposed field testing measures by providing details on their definition and guidance on their calculation. It is intended to complement the generic guidelines for planning and implementing the environmental performance measures contained in ISO 14031. The starting point for establishing environmental performance measures for the operations of federal departments is the environmental goals that departments/agencies have set in their sustainable development strategies (SDS) (e.g.Environment Canada, 1997).
82
Government of Canada (2000)
Sustainable development in government operations: a coordinated approach
Outlines a part of the government-wide effort to set common directions for the SDS. Is intended to promote green government and recommend best practices. Proposes a toolbox of collaboratively developed performance measures for seven priority areas and offers a sample set of concrete targets.
22
Mohninger (1999a,b,2000)
Environmental performance indicators: To develop baseline measurements and track progress in the area of environmental stewardship within Government of Jamaica ministries. Examines methods of measuring and monitoring the success of water, energy conservation and green purchasing programmes. To develop a baseline, set realistic targets and track whether these targets are being achieved. Internal performance indicators are a measurement of activities implemented by an organization in order to reduce its environmental impacts. Direct effect indicators measure the direct outcome of an organization’s environmental activities and programmes (e.g. estimating the number of trees saved as a result of purchasing green paper). Environmental quality indicators are measures of the effects on the environment of an organization’s environmental activities and programmes.
11 Internal performance—
Direct effects—Environmental quality
Government of Canada (2002)
Environmental performance measures: To provide environmental performance measures within the scope of Greening Government reporting guidelines. To help departments and agencies measure their progress in the eight priority areas identified (Government of Canada, 2000), namely: Energy Efficiency, Human Resources Managements, Land Use Management, Procurement, Vehicle Fleet Management, Waste Management, Water Conservation, Wastewater Management and
58 Environmental load—
Coast load—
insufficient to represent all the different environmental and
sustainability scenarios.
Taking state-of-the-art environmental indicator
frame-works into account, an attempt was made to use an
indicator framework for environmental performance
eva-luation that could be applied to the public sector in general
and its specific domains in particular, including individual
organizations. The defence sector was chosen as a
case-study. An indicator framework was developed with the aim
of combining the strengths of the most credible and tested
frameworks, to eliminate potential gaps and respond to the
sector-environment integration challenges.
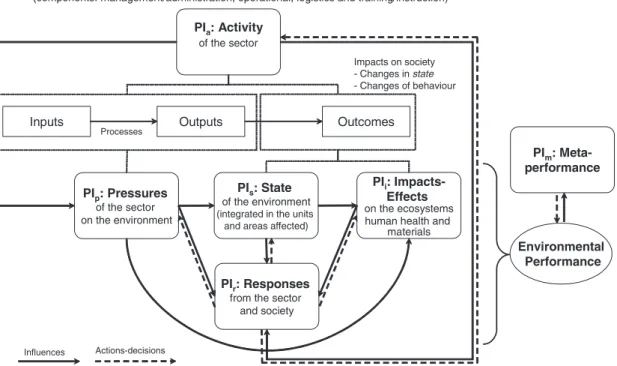
An indicator framework to manage and assess the sector’s
environmental performance was developed—sectoral EPIs
(SEPI) (
Fig. 1
). This framework was based on a
rearrange-ment of the indicator frameworks PSR (
Organization for
Economic Co-operation and Development (OECD), 1993b
),
PSR/E (
United States Environmental Protection Agency
(USEPA), 1995
), DPSIR (
National Institute of Public
Health and Environment (RIVM), 1995
, and
United
Nations Environment Programme and National Institute
of Public Health and the Environment (UNEP/RIVM)
(1994)
) and INDICAMP (
Ramos et al., 2004c
). This model
seeks to incorporate a systems analysis approach,
integrat-ing the main cause–effect relationships between the different
categories of performance monitoring indicators (
activity
,
pressures
,
state
,
impacts/effects
and
responses
). It also
includes the
meta-performance
indicators (
PI
m) category to
assess the effectiveness of the performance indicators
themselves. Although the sector level was the main focus
of the framework, it also aims to be applicable to individual
organizations or facilities.
The performance indicator framework SEPI was
devel-oped taking into account the model proposed by
Carter
et al. (1992)
for performance indicators in public
organiza-tions, based on the main flows among
input-processes-output-outcomes. These flows are assumed as the basis for
the entire EPI framework. It should be stressed that when
applied to public services this approach is generally
complex, as stressed by
Flynn (2002)
for the output
measurement problems or as stated by
Boland and Fowler
(2000)
for outcome evaluation. Despite this, the proposed
framework was designed to include the main materials
related to public services, along with energy, water,
products, services and information flows—in particular
those linked with defence missions and activities. Defence
sector inputs and outputs are related with
pressures
on the
environment but also with
responses
to environmental
problems. Outcomes are mainly related to
state
and/or
impacts
and
responses
categories, and are particularly
difficult to evaluate or in some cases almost impossible.
In the public sector, pressure indicators (namely the
components related to product/service outputs) can have
unusual characteristics, as compared to business pressures.
For example a product can be a policy, where the potential
environmental effects (positive and negative) are mainly
indirect and very difficult to assess.
This model shows how sector
activities
(PI
a) produce
pressures
(PI
p) on the environment, which then modify the
state
of the environment (PI
s). The variation in state then
implies
impacts
or
effects
on human health, the ecosystem
and materials receptors (PI
i), causing sectors/organizations
and society to
respond
(PI
r) with various management and
policy measures, such as internal procedures, information,
Table 1 (continued)
Author/year Framework name: indicator categories Primary objectives/comments Number of
indicators
Environmental Management Systems.
Environmental Load includes physical quantities of matter and energy being consumed or discharged; Total Cost includes quantities such as total cost of waste to landfill or total cost of water consumed.
United Kingdom Government (2002)
Framework for sustainable development on the government estate
The overarching aim of the Framework is to increase the contribution that all departments make to sustainable development, improving the performance of the Estate and reporting on progress. The framework is being released in stages and when complete will cover the main sustainable
development impacts associated with the running of departments. The first three parts of the framework include overarching commitments to identifying, managing and reporting on key sustainable development impacts of the Estate, as well as the first suite of targets to tackle specific sustainable development impacts from business travel and water use. The remaining parts cover waste, energy, procurement, estate management, biodiversity and social impacts.
12
The number of indicators only reflects those related to the environmental component, since in some cases the indicator frameworks also include the
Table 2
Environmental indicator initiatives in the defence sector
Author/year Framework name: indicator
categories
Primary objectives/comments Number of
indicatorsa
Assessment targetb
DND/CF (1997; 2000a; 2003)
Measurement, analysis and reporting of performance:
The proposed performance measures were developed by the Committee on Performance Measurement for Sustainable Government Operations (PMSGO, 1999) and were adapted by the Department of National Defence and Canadian Forces as an integral component of the department’s overall performance measurement process.
33/30/31 Defence Sector
Pressure—State—Response Using the PSR framework (OECD, 1993), they
measure and report the department’s progress in meeting its sustainable development commitments.
Swedish Defence Material
Administration (1998)
fideNorth Atlantic Treaty Organisation (NATO) (2000)
ISO 14031: Environmental Performance Indicators (Operational Performance Indicators and Management Performance Indicators)— Environmental Condition Indicators
To report the military unit environmental performance based on the ISO 14031 indicator framework. They also use indicators for comparisons with other organizations and describe the extent of environmental impacts.
31 Military Unit
United States Department of Defense (US DoD) (1999)
Environmental Performance Indicators: Leading—lagging
To evaluate the environmental performance of the United States Department of Defense (DoD), based on the process input (leading) and end-of-process or output (lagging) indicators. They refer to a variety of data on an issue being focused on (e.g. hazardous waste output); report trends in environmental conditions; and assess the effectiveness of efforts in protecting the environment. The indicator categories should address materials, energy, water and waste emissions.
n.a. Defence Sector
Netherlands MOD (2000)
Environmental Performance Indicators
Based on the Defence Environmental Policy Plan of the Netherlands Ministry of Defence, these performance indicators were developed to measure whether the 21 policy objectives have been reached or not. For each indicator the objective and certain methodological considerations are presented.
26 Defence Sector
Department of National Defence and the Canadian Forces (DND/CF) (2000b)
Strategic Performance Framework: Operational Forces—Resource Management—Defence Team— Contribution to Government of Canada
To provide managers with a common set of balanced, results-oriented performance information that will assist strategic-level decision-making and provide a basis for reporting departmental results. The Balanced Scorecard management concept was adopted as the basis for Performance Measurement. The Department has chosen to balance measurement across five key perspectives: Operational Forces; Defence Team; Leadership & Values; Contribution to Government of Canada; and Resource Management. Each of these perspectives is subdivided into measures. Similarly, measures are divided into indicators. TheContribution to Government of Canada
perspective includes the Environmental Management objective, which is measured by the following indicators: Environmental Incident Rate and Pollution Program Index.
2 Defence Sector
South Africa
Department of Defence (South Africa DoD) (2000)
Sustainable Development Indicators: Economic—Social— Environmental
To monitor and report progress towards the objectives set out in the environmental implementation plans (EIP). The EIP for Defence is directed toward securing the capacity required by the DoD for the
Table 2 (continued)
Author/year Framework name: indicator
categories
Primary objectives/comments Number of
indicatorsa
Assessment targetb
development of a national strategy for sustainable development through its line function of defence. Indicators are derived from Agenda 21.
United States Department of Defense (US DoD) (2001)
Pollution Prevention and Compliance Metrics: Leading— Lagging
To improve measurement of the DoD’s impacts on the environment throughleading
andlaggingindicators tied to the military mission. To make the metrics meaningful to senior DoD and Military Department management and understandable to non-environmental audiences, both inside and outside the DOD. For each indicator information is presented on the goal, the metric and who reports.
18 Defence Sector
Australian Department of Defence (Australian DoD) (2002)
EPRF-Environmental Performance Reporting Framework: Government as Customer—Government as Owner—Business Processes— People
The EPRF is the means by which defence (corporately and at the site level) reports the EMS performance management requirements (monitoring, measurement and auditing, and management review). The Balanced Scorecard approach has been adapted to give a balanced indication of performance, in relation to strategic objectives. The EPRF looks at environmental performance from the same perspectives as theDefence Matters Scorecard, for the whole-of-Defence performance. Under each perspective key objectives and
environmental performance indicators and measures are defined.
10 Military Unit/
Defence Sector
Marine Corps Base— Camp Lejeune (2002)
Camp Lejeune Balanced Scorecard: Workforce Growth and
Learning—Financial—Internal Processes—Customers
The Strategic Plan outlines the strategy to meet this challenge by establishing strategic goals and using the Balanced Scorecard. In each perspective area, strategic objectives and performance measures are identified and used to drive achievement of the strategic goals. The perspectiveInternal Processesincludes enhanced environment indicators: % implementation of Environmental
Management Systems and % Implementation of Integral Natural Resources Plan.
2 Military Unit
United Kingdom Ministry of Defence (UK MOD) (2003)
Framework for Sustainable Development on the Government Estate
To assess, manage, report and improve the performance of the Government Estate. The first three parts of the framework include overarching commitments to identifying, managing and reporting on key sustainable development impacts of the Estate, as well as the first suite of targets to tackle specific sustainable development impacts from business travel and water use. The remaining parts cover waste, energy, procurement, estate
management, biodiversity and social impacts. The United Kingdom Ministry of Defence (MOD) statement sets out the targets in the overarching commitments part of the framework, together with the MOD’s responses to those targets. The water and travel strategy is MOD’s response to the
government’s targets to reduce the sustainable development impacts from water management and business travel.
7 Defence Sector
US DoD (2003) Environmental Management System (EMS) Implementation Criteria and Metrics
To guide progress and measure performance during the early stages of EMS
implementation. Consistent with policy established in the Department of Defense EMS
6 Military Unit/
Table 2 (continued)
Author/year Framework name: indicator
categories
Primary objectives/comments Number of
indicatorsa
Assessment targetb
Memo (US DoD, 2002). Fulfilment of the six criteria at each appropriate facility is the minimum necessary to meet the implementation requirement of Executive Order (EO) 13148, ‘‘Greening Government through Leadership in Environmental Management’’.
Marshall (n.d.) Indicators of Sustainable Development: Pressure—State— Response
The indicators of sustainable development proposed by the United Kingdom Department of the Environment, based on the PSR framework (OECD, 1993), were adapted by the MOD for monitoring and reporting its progress towards the objectives set out in the Sustainable Development Strategy.
60 Defence Sector
United States Department of Defense (US DoD) (n.d.)
Environmental Performance Indicators
Measures of environmental performance established by the Deputy Undersecretary of Defense for Environmental Security to evaluate the services’ management of their respective environmental quality and remediation programs. For each indicator the objective, the units of measurement and certain
methodological aspects are presented.
13 Defence Sector
United States Army (US Army) (n.d)
Army EMS Implementation Metrics
Adapted from DoD EMS implementation Metrics (United States Department of Defense (US DoD) (2003), it reflects the actions needed to comply with Section 401(b) of Executive Order (EO) 13148,’’Greening Government through Leadership in Environmental Management’’ and DoD and Army EMS Policies.
7 Army
aThe number of indicators only reflects those related to the environmental component, since in some cases the indicator frameworks also include the
social and economic/financial components.
bAssessment Target: defence sector; military branches (Air Force, Army, Navy); units (bases, barracks, commands, among others); n.a.—not available.
regulations and taxes (see the dashed lines in
Fig. 1
). The
particular features of each of these categories are based on
the methodologies developed by the
Organization for
Economic
Co-operation
and
Development
(OECD)
(1993a)
,
UNEP/RIVM (1994)
, RIVM (1995),
United
States Environmental Protection Agency (USEPA) (1995)
and
European Environment Agency (EEA), 2000b
.
Activity
indicators (PI
a) are of special concern to
characterize the socio-economic performance and
function-ing of the sector, showfunction-ing the development of the sector’s
size and shape, as partially pointed out in
EEA (2000b)
for
a similar indicator category. However, the complete use of
PI
ais beyond the scope of this work, since many of their
uses are related to general sector performance management
and assessment.
Impacts/effects
indicators (PI
i) are
parti-cularly important, because they measure the actual effect
on the environment of a given activity, though they are
often difficult to assess. State indicators are used as data to
define impact indicators.
The SEPI framework also assumes that the performance
of overall environmental performance monitoring
indica-tors can be evaluated at one main stage with the
meta-performance
indicators (Pi
m). At this level, indicators
represent the effort to conduct and implement the indicator
program, also measuring their effectiveness. In a certain
way, the
meta-performance
indicator category may be
viewed as a
response
or
management
category (in ISO
14031:1999 terms), where the target is the EPI system itself.
This should be distinguished from response-type
indica-tors, which describe the responses of the sector,
organiza-tions and society and in which the targets are the
environmental, social and economic systems.
Meta-perfor-mance
indicators show the following: (i) how appropriate
the EPIs are (the
activity
,
state
,
pressures
,
impacts/effects
and
responses
categories), which leads to a review of and
improvement in these components; (ii) an evaluation of
overall monitoring activities and results, including the
environmental impact of the data collecting process
itself, to measure how well the indicator initiative is going;
and (iii) an evaluation of the sector’s environmental
performance measurement system and impact mitigation
action.
The indicator categories for
pressures
,
impacts/effects
(when available) and
responses
allow evaluation of
environmental performance.
Meta-performance
directly
evaluates the performance of all environmental indicators
used and indirectly the sector’s environmental
perfor-mance.
EEA (2000b)
also stresses some of the above
assumptions, stating that
pressure
indicators (e.g.
emis-sions, waste flows, water use) can almost always be
attributable to the implicated sectors. On the other hand,
this requires modelling techniques and it is also sometimes
impossible to attribute environmental
state
and
impacts/
effects
indicators to sectors. These limitations can be
minimized if instead of considering the sector as a whole,
we take several individual organizations as a representative
sample of the sector.
Development of the EPI system is based on various
fundamentals: (a) the type and dimension of the sector/
organization; (b) baseline environmental sensitivity; (c)
major significant environmental aspects and/or impacts
identified/predicted and related mitigation measures; (d)
the identification of impacts which have poor accuracy or
lack of basic data; (e) other related environmental
monitoring programs; (f) the need for all public sector
domains to have a common general indicator list, although
sector-specific indicators exist; (g) the importance of
indicators satisfying the information desires of the
stake-holders (internal and external); and (i) the need for the
information communicated to be potentially comparable
and widely disseminated.
This indicator framework was designed to be integrated
into overall performance management, since the
environ-ment is defined as an autonomous target component, which
gives it a specific performance role, as happens with
financial performance. The
activity
indicator category is the
link with the performance of non-environmental issues,
and can be disaggregated into another specific framework
for performance evaluation of missions and activities.
Integration among the various components of performance
management and assessment is a fundamental issue. It
should be pointed out that several pieces of research work
have tried to incorporate the environment into broader
performance frameworks that already have socio-economic
components. Examples are certain adaptations of the
balanced scorecard developed by
Kaplan and Norton
(1996)
, in particular, the work of
Epstein and Young
(1998)
,
Johnson (1998)
and
Dias-Sardinha et al. (2002)
.
4. Indicators for the Portuguese defence sector
4.1. The Portuguese defence sector
The Portuguese defence sector is one of the largest in the
public service, despite its relatively small size compared to
those of other countries. The main characteristics of this
sector are summarized in
Table 3
. The data presented show
the importance of this domain in the Portuguese public
sector overall and in the country profile. Environmental
management systems, their implementation and
certifica-tion, and any environmental awards obtained by the
military units were also identified.
The Ministry of Defence (
Ministe´rio da Defesa Nacional
(MDN)
) oversees a vast number of organizations (e.g.
directorates general, public institutes and state-owned
companies), plus the armed forces (divided into the three
military branches, army, air force and navy (including
marines)) and all the related organizations (e.g. bases,
garrisons, agencies and commands).
important number of missions, activities, products and
services; its potential environmentally significant impacts;
its large acquisition processes; its significant public
expenditure; its profile and awareness of fair environmental
management practices; its growing role in modern society
and, finally, its general exclusion from environmental
studies under European and Portuguese law such as the
environmental impact assessment regulations.
The increasing environmental integration in the
Portu-guese military units may indeed become an example for the
rest of the public sector to develop better practices. Some
practices and indicators in the defence sector are similar to
those in the private sector. Others are specific to the public
service and may well be replicated in other public
institutions that are taking more time to adopt
environ-mental management practices. Still others are specific to
the military, often being those with the most significant
impacts; they may have less demonstration value, but they
are of course important for local impact reduction.
Unlike the classic business input-output model, the main
mission of a country’s national defence system is to defend
and protect its sovereignty and interests, i.e. the major
‘‘product’’ output flow. The inputs and outputs in defence
can generally be represented by
Fig. 2
. On the basis of
environmental field assessments, national questionnaire
surveys (
Ramos et al., 2004a
) and the literature, the typical
defence flows were identified (see
Fig. 2
). This scheme
represents the main inputs from the environmental and
socio-economic systems necessary to assure that the
defence sector works, at the process, facility and equipment
levels. Consequently, outputs originate from defence
activities and are released into the interacting natural and
human systems. Many of these inputs and outputs
represent the main groups of the defence services’ potential
environmental pressures that may influence the
environ-ment and modify the state of the ecological and social
systems. Despite certain general assumptions, this
flow-chart could represent the main inputs, processes and
Table 3
Main characteristics of the Portuguese defence sector (adapted fromMiniste´rio da Defesa Nacional (MDN), 2002)
Main sector variables Portuguese Defence
Sector
Armed Forces
Air Force Army Navy (including
Marines)
Personnel (number)
Manpower 42 677 7523 22 528 12 626
Total Personnel1 56 202 9218 28 422 17 230
Military Units (number)
Total Military Units2 300 53 142 105
Bases/Garrisons 125 19 88 18
Institutes, Academies, Schools and Centres of Instruction
76 25 26 25
Classified Buildings (number)
Cultural Buildings 32 0 27 4
Buildings of Public Interest 32 0 13 15
Occupied area (ha) 23 135a 11 559 10 379 1187
Total expenditure (106
h) 1447b 342 588 413
Mission or main activities e.g. territorial defence and military security; logistics; military instruction and training; inspection/surveillance; rescuing operations; general management/administration; military exercises; marine pollution control and forest fire prevention, among others.
Military equipment available (number)
n.a. Military aircraft: Combat cars: 101 Warships: 50
124 Armoured vehicles: 522 Helicopters: 5
Howitzers: 141 Armoured amphibious
vehicles: 5
Helicopters: 28 Missile systems: 166 Missile launch systems: 5
Heavy mortars: 125 Missiles: 13
Bridges: 11 Heavy mortars: 36
Defence sector environmental awards from 1993 to 2002 (number)
29 3 17 9
EMS implementation (number) 3 1 2 0
EMS certification under ISO 14001: 1996 (number)
3 1 2 0
n.a.—not available; 1—Civilians included; 2—military unit was adopted to represent all the different kinds of military organizations encompassed by this study. According to this definition, one facility or camp may include several independent units that fulfil the criterion of having a person in charge of environmental issues.
aAbout 0.25% of the Portuguese territory.
outputs in the Portuguese defence sector, and be of special
value for indicator development.
4.2. Development of Indicators
In this study the main object of analysis is the whole
defence sector. It is, however, divided into several
components, including the armed forces and the
adminis-trative agencies/departments, covering military and civilian
components. As the business sector can be divided into the
corporate, company, site or facility levels, the defence
sector can also be disaggregated into several organizational
levels. Accordingly, the application of the SEPI framework
to the Portuguese defence services was carried out with two
organizational levels in mind: L
1—the overall defence
sector (the military branches—the Air Force, Army and
Navy—and all organizations under the Ministry of
Defence); and L
2—military
units
(e.g. bases, garrisons,
agencies and commands). In association with these levels
the information could be reported at two spatial levels:
national or local. In this paper, where the main aims are
sector-oriented, only the national level will be considered.
The indicators were developed particularly to satisfy
policy level needs, i.e. the set proposed is made up of key
environmental defence-sector indicators. These indicators
should be able to communicate the sector’s environmental
performance to policy makers, military chiefs and the
general public. These indicators have a high information
content and reduced complexity and are relevant for the
target audience. Although the aggregation of indicators
into indices is more attractive to top decision-makers and
the general public, headline indicators could simply be
single quantitative or qualitative indicators with a special
meaning, fulfilling the objectives desired.
Despite some degree of specificity, the indicators
developed for the Portuguese defence sector are naturally
common to other defence sectors throughout the world,
and to the other public and private domains. Even so, to
satisfy the sector-specific characteristics, a methodological
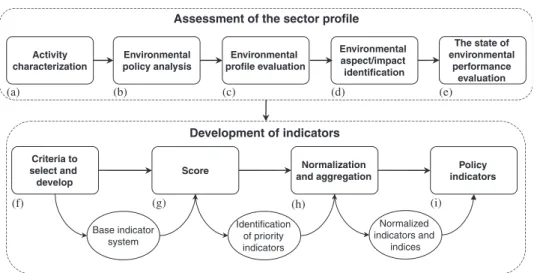
procedure was carried out to accomplish the final goal, the
development of EPPIs (
Fig. 3
).
In the first stage, the sector profile assessment was
conducted using the following fundamental steps
devel-oped in previous work (
Ramos and Melo, 2005, 2006
;
Ramos et al., 2004a, b
):
(a) A review of sector mission and activity characteristics:
inputs, processes, outputs and, when possible, the
outcomes; a clear description of their estate, including
type and/or number of organizations, staff, buildings
and facilities, land area owned, and material and
equipment managed.
(b) Systematic analysis of the integration of environmental
considerations into defence sector policies, centered on
the following elements: the environmental policy of the
Portuguese Armed Forces (
Ministe´rio da Defesa
Nacional (MDN), 2001
); the NATO Standardization
Agreement (STANAG 7141 EP—1st edition) (
North
Atlantic Treaty Organisation (NATO), 2002
).
(c) The sector’s environmental profile: based on an
assessment of the environmental management practices
implemented.
(d) Identification of the environmental aspects and impacts
(significant and non significant).
(e) The state of environmental performance evaluation in
the Portuguese defence services.
It was principally the information obtained at this stage
that was used as the basis for the development of the
sectoral environmental performance policy indicator.
Therefore, after these phases (a–e) had been carried out,
the indicators were developed (phases f–i). On the basis of
the pre-defined goals and objectives for the indicator system
to be developed, various indicator guidelines and criteria
were taken into account, namely those presented by
Johnston and Smith (2001)
,
Wehrmeyer et al. (2001)
,
International
Organisation
for
Standardization
(ISO)
(1999)
,
Young (1996)
,
Kuhre (1998)
,
Personne (1998)
,
Her
Majesty’s Stationery Office (HMSO) (1996)
,
Ramos (1996)
,
Barber (1994)
,
UNEP/RIVM (1994)
and
Ott (1978)
.
Some of the most relevant criteria used in this phase
were: social and environmental relevance; ability to provide
a representative picture of significant environmental
aspects and impacts; the extent to which it fits into the
conceptual framework; to be goal driven; simplicity, ease of
interpretation and ability to show trends over time;
responsiveness to change in the environment and related
project actions; capacity to give early warning about
irreversible trends; ability to be updated at regular
intervals; present or future availability at a reasonable
cost/benefit ratio; appropriateness of scales (temporal and
spatial); acceptable levels of uncertainty; data collection
methods comparable with other data sets; a good
theoretical base in technical and scientific terms; existence
of a target level or threshold against which to compare it so
that users are able to assess the significance of the values
associated with it; and minimal environmental impact of
the sampling process itself.
When a base indicator system had been obtained (see
Appendix A), a scoring procedure was used, following the
method developed by
Ramos et al. (2004c)
. To obtain the
headline indicator core set, avoiding a too complex and
resource-demanding system, the SEPI indicators could be
scored according to a qualitative expert knowledge
assessment of their
relevancy
and
feasibility
, which included
some of the above mentioned criteria, though in a more
focused evaluation. The
relevancy
classification covers: (i)
the association with major and actual sectoral
environ-mental integration policy issues; (ii) links with policy
targets or scientifically/technically determined reference
values; (iii) the technical and scientific importance; (iv) the
synthesis capability; (v) the usefulness in communicating
with and reporting to a wide audience; and (vi) the
appropriateness to the organization level. The
feasibility
classification covers: (i) sensibility; (ii) robustness; (iii) cost;
and (iv) the operability of the determination methods.
Some of the properties used to assess relevancy and
feasibility coincide with the criteria for headline and sector
policy indicator selection that are mentioned by the
Commission of the European Communities (2003)
,
Orga-nization for Economic Co-operation and Development
(OECD) (2001)
,
Hertin et al. (2001)
, the
EEA (2000b)
,
Swedish Environmental Advisory Council (SOU) (1999)
,
the
Commission of the European Communities (1999)
and
the
European Environment Agency (EEA) (n.d.)
.
To proceed with the qualitative assessment for
evaluat-ing
relevancy
and
feasibility
classes, an expert panel was
set-up, composed of academics and MDN staff with
environmental and defence expertise. In the first stage only
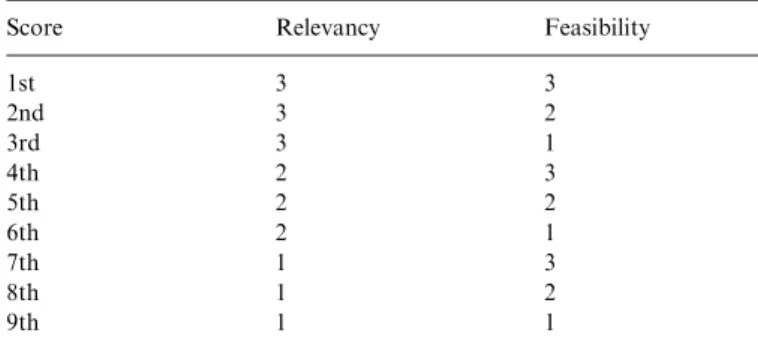
the indicators with the highest classification were included,
keeping in mind that, when adding up this score, the total
number of indicators should not exceed, on average, 7
indicators per category. Each indicator was classified from
1 (lowest classification) to 3 (highest classification): low—1;
medium—2; high—3. The headline indicators used in SEPI
were those with a score of 6 (the sum of relevancy and
feasibility). Relevancy was the main criteria for indicator
selection, followed by the feasibility of the indicator
determination method. The other indicators scored were
to be considered for other kinds of performance evaluation
(
Table 4
). A final post-scoring was conducted to assure that
the core set of indicators obtained represented the real
situation in the Portuguese defence sector: a check was
made that the significant environmental aspects and
impacts identified for the sector in
Ramos et al. (2004a)
were reflected in the indicators chosen.
The EPPIs obtained and their results should be reviewed
periodically to identify opportunities to improve and reach
the objectives. A special attribute of this framework is the
possibility of obtaining a significant part of the review
information from the meta-performance indicators. Some
of the steps in the reviewing process can include a review of
certain points similar to those presented by
International
Organisation for Standardization (ISO) (1999)
, namely: the
Criteria to select and develop
Score and aggregationNormalization indicatorsPolicy
Base indicator system
Identification of priority indicators
Normalized indicators and
indices Activity
characterization
Environmental policy analysis
Environmental profile evaluation
Environmental aspect/impact identification
Development of indicators
The state of environmental
performance evaluation
(a) (b) (c) (d) (e)
(f) (g) (h) (i)
appropriateness of the monitoring scope and objectives; the
cost effectiveness and benefits achieved; the progress
towards meeting environmental performance criteria; the
appropriateness of environmental performance criteria; the
appropriateness of SEPI indicators; and data sources, data
collection methods and data quality.
The indicators can be produced in three formats:
absolute; normalized or aggregated into an index. In
general, to evaluate environmental performance these
various possibilities are complementary and should be
used as a function of the objectives. Absolute indicators
state the magnitude of the environmental problem, the
normalized indicators allow us to associate with the
efficiency, and the indices communicate aggregate
informa-tion by adimensional units, for example by polluinforma-tion,
quality or performance classes. Targeting the top decision
makers or the general public, as policy indicators do, the
information should be in the easiest and most succinct
format. Therefore, a key procedure is the transformation of
the collected data into adequate units of measurement and
the normalization of indicators, in order to allow
compar-ability and make the data available to different target
audiences. For this indicator system we propose a range of
normalizing factors
(common denominators) to produce
the results:
functional unit
1—major defence missions (e.g. territorial
defence; military exercises), defence products (e.g.
cartography; military equipment) and services (e.g.
marine environmental surveillance for the Ministry of
the Environment) (number).
Members of staff (military plus civilian personnel)
(number).
Building area (ha).
Military
units
(number).
Public environmental investments and expenses (
h
).
Nevertheless, the choice between normalized or absolute
indicators will depend mainly on the objective. As stressed
by
Characklis and Richards (1999)
there is no analytical
solution to this basic divergence of goals, i.e. someone
interested in eco-efficiency might see the
production-weighted indicator as consistent with the overriding goal
of less environmental impact per unit product. A local
community would likely find the total environmental
loading to be more important.
Overall indicators should be evaluated for the entire
Portuguese defence sector and also disaggregated by
service branch, the Air Force, Army and Navy, when
appropriate.
The SEPI framework provides for the possibility that
indicators can be aggregated by category into
environ-mental indices (by arithmetic or heuristic algorithms),
reflecting the composite results of each framework
cate-gory. As a result, the environmental performance could
ideally be presented with an index for each indicator
category: activity, pressure, state, impact–effects, response
and meta-performance. Some of the methodological
draw-backs of environmental indices and weighting must be
taken into account, to avoid significant losses of
informa-tion and assure meaningful results.
A system of about 135 indicators for SEPI framework
categories was developed as a base to obtain, by scoring,
the core set of headline indicators for the Portuguese
defence sector. Some of the indicators belonging to this
system were also chosen on the basis of previously
mentioned literature, presented in
Tables 1 and 2
, and of
the criteria for indicator selection and development
presented earlier.
Table 5
presents the core set of indicators obtained after
scoring the long list of 135 indicators from 1 to 3, for their
relevancy and feasibility. Indicators are divided by SEPI
category, and examples of units of measurement are given
for each indicator. It became clear that this headline core
set, despite their sector specificity, should cover all major
environmental issues/problems, and many of those
indica-tors are also applicable on the macro level (national sector
level) and micro-level (i.e. public agency, firm or
corpo-rate level). Nevertheless, it should be stressed that some
of the indicators have no meaning when analysed at
micro-level.
Despite the efforts to obtain an equilibrated core set of
headline indicators, quantitatively and qualitatively, the
total number of indicators is still high. This is a problem,
although mitigated by the fact that different categories of
indicators are directed at specific goals. Hence, most
indicators will simply not be needed in any one particular
situation. As stated in EEA (n.d.), in recent years there has
been a trend to develop a more limited number of indicator
core sets, in particular when dealing with headline
indicators. However, there is not a widely accepted
consensus on the length of the list of ‘‘typical’’ headline
indicators, except that there should only be a few (e.g. from
5 to 30).
Table 4
Score for indicators according to theirrelevancyandfeasibility (classifica-tion: 1—low; 2—medium; 3—high)
Score Relevancy Feasibility
1st 3 3
2nd 3 2
3rd 3 1
4th 2 3
5th 2 2
6th 2 1
7th 1 3
8th 1 2
9th 1 1
1
Standard unit of production appropriate to the sector, as defined by
Table 5
Environmental performance policy indicators, according to SEPI categories, for the Portuguese defence sector
Indicators categories Units (examples)a
Activity
PIa1—Personnel (military and civilian) No
PIa2—Public expenditure 106hyear 1
PIa3—Defence missions and activities: production and storage of military
weapons, ammunition and other military-type goods; operation, maintenance and repair of military/non-military buildings, machinery and equipment (including vehicles); military field exercises; inspection/ surveillance; rescuing operations; demilitarization; defence research and development initiatives; total missions and activities
No year 1
PIa4—Travelling on duty: air, road, boat and railway (by vehicle fleet) km year 1
PIa5—Defence organizations: military units and others no.
PIa6—Land area owned, leased or managed (by land use type and by
military activity, in particular training and exercises)
Ha
PIp7—Conventional ammunition, missiles and explosives used or
detonated (by type)
no year 1
Pressures
PIp1—Energy consumption: total and by source (renewable and
non-renewable)
J year 1
PIp2—Fuel consumption (by equipment/vehicle fleet): total and by fuel
type (natural gas, light oil, heavy oil, diesel, propane, steam)
t year 1; m3year 1
PIp3—Spills of oil, fuel or hazardous substances no.year
1
; m3.year 1; t.year 1 PIp4—Wastewater discharges: domestic sources, industry and
contaminated stormwater:
m3.year 1; inhabitant equivalent;
metals and compounds, chlorinated organic substances, other organic compounds (e.g. total organic carbon—TOC; Polycyclic aromatic hydrocarbons—PAH), suspended solids, nutrients (total nitrogen and phosphorus), sediment from runoff (see European Pollutant Emission Register—EPER)
t year 1by pollutant
PIp5—Air emissions from stationary and mobile sources (SO2; NOx;
PM10; VOCs; CO; heavy metals) (see EPER)
t.year 1by pollutant
PIp6—Solid waste generation by type: hazardous and non-hazardous
wastes; military equipment and ammunition wastes; domestic, industrial, medical, forestry, garden, agricultural, construction and demolition wastes; sludge from wastewater treatment plants
t year 1
State
PIs1—Soil contamination (e.g. metal contamination such as iron,
aluminium, copper, tungsten, depleted uranium and lead)
no. of contaminated sites; ha; m3
PIs2—Soil eroded and compacted Ha; %
PIs3—Air quality (SO2; NOx; PM10; VOCs; CO; heavy metals) (within
unit areas and outside)
mg m 3; no. of days exceeding air quality standards year 1
PIs4—Surface and groundwater quality by water uses (microbiologic and
physical-chemical indicators): agriculture; industrial processes; washing; domestic supply; ecological protection; recreation purposes, among others
mg l 1; % of non-compliance samples year 1; MPN.100 ml 1(for
microbiological parameters)
PIs5—Noise levels (with and without defence activities, particularly
exercises): (within the unit area and outside)
No. of sites exceeding noise levels limits year 1
PIs6—Endangered species of flora and fauna No. of species
Impacts-effects
PIi1—Health effects (staff and local communities) blood lead levels: ppm
PIi2—Noise impacts on population % of population highly annoyed
PIi3—Cultural heritage degradation, including historic properties,
archaeological sites, and more traditional cultural sites
Qualitative assessment
PIi4—Biotic communities disturbance Community disturbance assessments; number animals deaths year 1
PIi5—Effects on the quality of organisms used in human diet (e.g. marine
organisms)
Presence of faecal contamination in bivalvia (MPN indicator of faecal contamination FW 1)
Responses