Maria João Sampaio Araújo Correia de Sousa
Impact of thermal environment assessment
tools on layout change
Tese de Mestrado
Mestrado em Engenharia Industrial
Trabalho efetuado sob a orientação do(s)
Professora Doutora Senhorinha Teixeira
Professora Doutora Isabel Freitas Loureiro
iii
A
CKNOWLEDGMENTSTo Professor Senhorinha Teixeira, for all the tireless support, the constant availability to give me all the help I needed and for all the opportunities and incentives to include my personal development.
To Professor Isabel Loureiro for the advice and guidance given throughout the work, and for the transmission of essential knowledge for the accomplishment of this study.
To Professor Luis Martins and to my colleagues Sara Cardoso and Vitor Correia for the essential help in the development of the study and the measurements at the place under study. To Engineer Hélia, who has always welcomed me to Continental-ITA with all the care and availability, for the advice and support throughout the development of the study.
I would like to thank my family for all the support they have given me over the years and for their unconditional support in all my decisions.
And finally, I would like to thank my boyfriend for the accompaniment and absolutely essential help and for the patience.
v
A
BSTRACTThe layout in an industrial context reveals immense importance to understand how the human body feels the impact of the differences in thermal environmental parameters.
Considering this factor, the main objective of this work is to follow up on previous works for the layout that was previously implemented, and then perform a study on the new layout. A methodological procedure of the environmental parameters and several simulations was developed in the Human Body Modeling Software in order to generate more accurately several views on how the temperature and humidity evolves in the worker and, indeed, what impact this layout change had.
An experimental survey of the environmental parameters was performed, and the metabolism was calculated to allow the characterization of the thermal environment. These parameters are necessary to verify that the worker is exposed to certain environmental and working conditions that can lead to situations of thermal stress. Measurements of these parameters were performed at 30 plant points, using appropriate equipment such as the globe thermometer, the anemometer term and the Data Logger. The calculation of the Wet Bulb Globe Temperature (WBGT) and Predicted Mean Vote and Predicted Percentage of Dissatisfied (PMV / PPD) indices was performed using the Malchaire model and an Excel sheet prepared for this purpose. In this way, the evaluation of the thermal environment of an industrial unit was carried out experimentally and the sensitivity of the human thermal model was tested with the Human Body Modeling Software.
The main conclusions obtained suggest that although a slight increase in the experimental values compared to those obtained in previous studies, in relation to the PMV-PPD and WBGT indices, it can be observed that there was a small decrease, although the values are still high. Through the simulation, it is verified that the temperature of the ambient air and the temperature for the distinct parts of the body tend to the same behavior and the clothing can attenuate the effects of the heat.
K
EYW
ORDS:
Thermal environment; Experimental measurements; Human Thermal Model; Human Factors in Layout;
vii
R
ESUMOO layout em contexto industrial revela grande importância para compreender a forma como o corpo humano sente o impacto das diferenças dos parâmetros ambientais térmicos.
Tendo em conta este fator, o objetivo principal deste trabalho é fazer um seguimento a trabalhos anteriores, realizados por Guise, 2014 e Gomes, 2015 para o layout que previamente se encontrava implementado, e realizar então um estudo ao novo layout. Foi realizado um procedimento metodológico dos parâmetros ambientais e diversas simulações no Software de Modelação do Corpo Humano de forma a gerar com mais precisão diversas vistas sobre como evolui a temperatura e a humidade no trabalhador e efetivamente qual o impacto que teve esta mudança de layout.
Foi realizado um levantamento experimental dos parâmetros ambientais e foi calculado o metabolismo para permitir obter a caracterização do ambiente térmico. Estes parâmetros são necessários para verificar se o trabalhador está ou não exposto a determinadas condições ambientais e de trabalho que podem levar a situações de stress térmico. As medições destes parâmetros foram realizadas em 30 pontos da planta, através de equipamentos apropriados como o termómetro de globo, o Termo anemómetro e o Data Logger. O cálculo dos indíces Wet Bulb Globe Temperature (WBGT) e Predicted Mean Vote and Predicted Percentage of Dissatisfied (PMV/PPD) foi realizado com recurso ao modelo de Malchaire e a uma folha de Excel elaborada para o efeito. Desta forma, a avaliação do ambiente térmico de uma unidade industrial foi realizada de forma experimental e a sensibilidade do modelo térmico humano foi testada com o Software de Modelação do Corpo Humano.
Verifica-se um aumento nos valores experimentais relativamente aos obtidos em estudos anteriores e a mesma situação se verifica nos índices PMV-PPD e WBGT. Através da simulação, conclui-se que a temperatura do ar ambiente e a temperatura para as diferentes partes do corpo tendem ao mesmo comportamento e o vestuário consegue atenuar os efeitos do calor.
Palavras-chave:
Ambiente térmico; Medições experimentais; Modelo Térmico Humano; Fatores humanos no Layout
ix
T
ABLE OF CONTENTS Acknowledgments ... iii Abstract ... v Resumo ... vii List of figures ... xiList of tables ... xiii
List of symbols ... xv
1 Introduction ... 1
1.1 Company presentation ... 1
1.2 Objectives and Research Questions ... 5
1.3 Dissertation Organization ... 6
2. Literature Review ... 7
2.1 Portuguese legislation and international standards ... 7
2.2 Factors that influence human thermoregulation with the environment ... 9
2.3 Thermal environment ... 9
2.4 Metabolism ... 14
2.5 Assessment by PMV-PPD indexes ... 15
2.6 Assessment by WBGT index ... 17
2.7 Human Thermal Modeling ... 18
3. Methodology ... 21
3.1 Characterization of the thermal environment in study ... 21
3.2 Selection of the measuring point and strategy ... 22
3.3 Activities ... 24
3.4 Parameters ... 24
3.5 PMV/PPD and WBGT... 27
3.6 Human Thermal Modeling Software ... 28
4. Results ... 33
4.1 Environmental Parameters ... 33
4.2 Metabolism ... 36
4.3 Experimental data on points to simulate ... 37
x
4.5 Human Body Modeling Software ... 41
5. Final Considerations ... 45
Bibliography ... 47
Annex I –Thermal isolation ... 51
Annex II – Previous Layout in study ... 53
xi
L
IST OF FIGURESFigure 1.1 - Continental-Industria Têxtil do Ave, S.A. ... 2
Figure 1.2 - Components of a tire (Santiago, 2013) ... 3
Figure 1.3 - Productive process (Guise, 2014) ... 3
Figure 2.1 - Relative accident frequency & air temperature (Parsons, 2003) ... 11
Figure 2.2 - Equipment (Guise, 2014)... 12
Figure 2.3- Relationship between PMV and PPD (Djongyang et al., 2010) ... 16
Figure 2.4 - Numeration of the 16 parts dividing the body into the numerical simulation (Gomes,2015) ... 19
Figure 3.1 - Twisters corredor ... 22
Figure 3.2 - Plant with measunring points ... 23
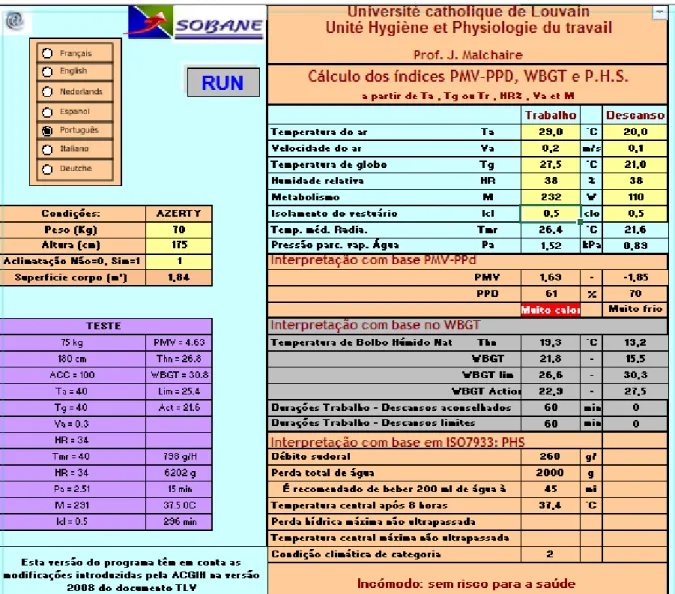
Figure 3.3 - Malchaire Table ... 28
Figure 3.4 -The three layers of each part of the body and the two layers of clothing ... 29
Figure 4.1- PMV values in the course ... 38
Figure 4.2 - WBGT values in the course ... 39
Figure 4.3 - Skin layer temperature values in parts of the human body ... 42
Figure 4.4 - Clothing layer temperature values in parts of the human body ... 43
Figure 4.5 - Relative humidity in skin layer in parts of the human body... 43
Figure 4.6 - Temperature in the trunk throughout the course ... 44
Figure 4.7 - Humidity in the trunk throughout the course ... 44
xiii
L
IST OF TABLESTable 2.1 - Consequences of thermal stress ... 11
Table 2.2 - Seven-point thermal sensitivity scale (ISO 7730) ... 15
Table 2.3 - Levels of measurements for the physical parameters of an environment ... 18
Table 3.1 - Metabolic rate for body posture ... 27
Table 3.2 - Initial temperature values of each part of the body in the three layers. ... 32
Table 4.1 - Environmental parameters measured ... 34
Table 4.2 - Descriptive statistics of the environmental parameters in the shift from 14h00-22h00 of SPSS ... 35
Table 4.3 - Experimental data from Guise (2014) and experimental data from de the current study ... 35
Table 4.4 - Ativities and metabolic rate associated ... 36
Table 4.5 - Experimental data of the points to be simulated. ... 37
Table 4.6 - Descriptive Statistics of the PMV values ... 40
Table 4.7 - Descriptive Statistics of PPD on SPSS ... 40
Table 4.8 - Descriptive Statistics of WBGT on SPSS... 41
Table I.1 - Thermal isolation ... 51
Table III.1 - Metabolic rate for body posture (adapted from ISO 8996:2004) ... 54
Table III.2 - Metabolic rate for type of work (Adapted from ISO 8996:2004) ... 54
Table III.3 - Values of metabolic rate for body motion to work speed (Adapted from ISO 8996:2004) ... 54
xv
L
IST OF SYMBOLSIEA – International Ergonomics Association HSE – Health and Safety Executive
TSQ – Thermal Sensation Questionnaire PMV – Predict Mean Vote
PPD – Predicted Percentage of Dissatisfied WBGT – Web Bulb Globe Temperature
SPSS - Statistic Package for the Social Sciences ISO – International Organization of Standardization
ASHRAE – American Society of Heating, Refrigerating and Air-Conditioning Engineers Tg – Globe temperature (ºC)
Ta – Air temperature (ºC) Va – Air velocity (m/s)
Tr – Mean Radiant Temperature (ºC) T – Temperature (ºC)
Hr – Relative humidity (%) Clo – Clothing
1 I
NTRODUCTIONIn the industry, the human component is important and fundamental, but it is not always has the importance that deserves (Fanger, 1970). The importance of the study of the thermal environment was evidenced with the publication of the "Thermal Comfort" Fanger, in 1970, where the author emphasizes the disciplinary character of this area of study. The ideal situation for any worker is one where there is the so-called thermal comfort. (Fabbri, 2013)
The thermal comfort is defined by the feeling of personal well-being, related to the temperature, it is a balance of the temperature produced in the body with the heat that loses to the environment that surrounds. Thereby, the same environment will not satisfy everyone. But the main goal is to turn a work environment as comfortable as possible, to avoid work accidents and/or health problems (Fabbri, 2013).
A comfortable worker is more willing to work, increasing this way the company productivity. The health and efficiency of workers are influenced by environments of extreme or oscillating temperatures, it becomes an important theme to be studied in recent years, with the objective of being able to promote the well-being and safety as well as the efficiency of the worker in order to minimizing exposure to thermal stress. (Bernard & Hanna, 1988)
1.1 Company presentation
Continental AG was founded in Hanover in 1871. It was the first German company producing pneumatic tires for bicycles.
In 1990, a joint venture was set up together with the Portuguese company Mabor, for the production of tires. Currently, Continental is located in Africa, Asia, Europe and America and belongs to the group of the largest world producers of tires.
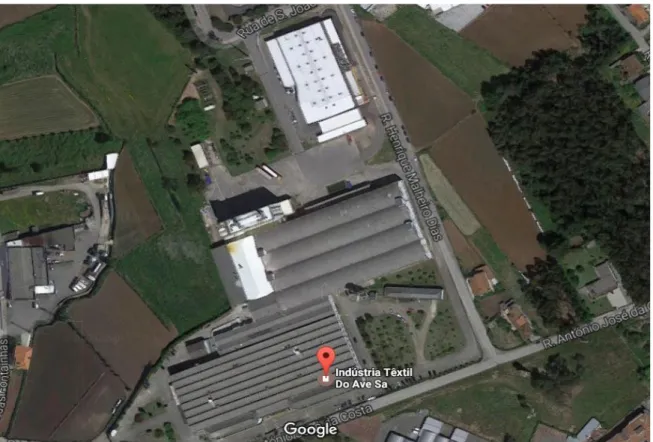
At Continental Group there are two factories that produce textile reinforcements; one is located in the United States of America and the other is Continental – Indústria Têxtil do Ave. S.A. (C-ITA), located in Lousado, Vila Nova de Famalicão, visible in Figure 1.1.
Figure 1.1 - Continental-Industria Têxtil do Ave, S.A.
C-ITA, the local where this work was developed, was founded in 1948 as a consequence of the first tire factory in Portugal, Mabor.
Continental ITA’s production is of 15000 tons per year it works 24 hours a day, 7 days per week they have 172 factory workers, there net income in 2013 was € 195.74 million, the industrial complex has an area of 52000 m2.
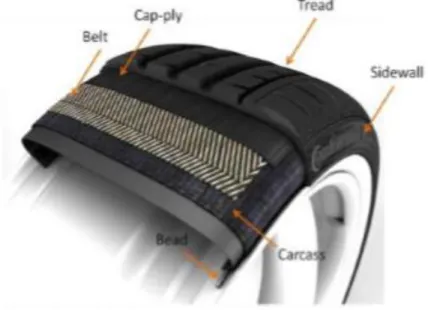
C-ITA dedicates to textiles production for tires, being initially used cotton as a feedstock. In 1958, cotton was replaced by high tenacity rayon and, years later, by synthetic fibers, like polyamide and nylon. These materials provide unique features to the tire, gaining security, comfort and the best direction conditions possible. This is extremely important since the tire (Figure 1.2) is the link between the vehicle and the floor.
Figure 1.2 - Components of a tire (Santiago, 2013)
The company is certified with the standards ISO 9001 and ISO 14001. The productive process, visible in Figure 1.3, is divided in three main sections: Twisting, Weaving and Dipping.
Figure 1.3 - Productive process (Guise, 2014)
The winding is realized on the products which do not have the appropriate dimensions to introduce in the twisters. In this stage, the yarn is rewound to obtain the correct dimensions, being then able to follow to the twisting process. In winding process there is also the possibility to remove irregularities that the yarn may contain. The winding process is not applied to all products since the majority already presents the correct dimensions. The goal of the twisting process is to twist the yarns in Z or S, in other words, interlace them, clockwise and anti-clockwise, respectively. The rope is produced which has better properties comparatively to the yarn, such as, higher tenacity and strength. The rope obtained has a cohesive structure, since this operation avoids the slip between fibers.
In weaving step, the bobbins from twisting process are arranged on looms that interlace the ropes in transverse and longitudinal direction, obtaining the textile fabric. The textile fabric that is obtained is wound on a bobbin of large dimensions that become in a roll. Hence, these rolls are sent to the dipping process. This process can be performed on rope or roll. The impregnation of rope is realized on SingleEnd machines, with DC twisters, and the roll impregnation on ZELL machine. In this step, is given a physical and chemical bath to the fibers to confer them a strong adhesion to the rubber in the tire production. Otherwise, the fibers would not adhere to rubber.
Background and Motivation
Ergonomics is the study of the relationship between man and work, with the aim of applying the technologies necessary for the successful accomplishment of man's work, devising a measure of health, safety and comfort in carrying out his task, in other words is the process of designing or arranging workplaces, products and systems so that they fit the people who use them.
In August 2000, the International Ergonomics Association (IEA) approved the official definition of ergonomics. According to the IEA, ergonomics is a scientific discipline related to understanding the relationships between humans and other elements of a system and the profession, which applies theories, principles, data and methods to projects in order to improve the well-being and the performance of the global system (IEA, 2017).
The confirmation about the importance of the study of thermal comfort came in 1970 with the work of Fanger on Thermal Comfort, where the author empharizes the disciplinar character of this study área (Fanger 1970). Fanger stablished the necessary conditions to thermal Comfort and the principles to assess and analyzed thermal environments (Broega, 2008)
Thermal Comfort is the condition of mind that expresses satisfation with the thermal environment and is assessed by subjective evaluation, it’s affected by personal diferences like
culture, genre or age and depends on physical, physiological and psychological processes (Djongyang, Tchinda, & Njomo, 2010; Parsons, 2002).
The objective of the studies of thermal Comfort is to establish the necessary conditions to turn a thermal environment appropriate to human occupancy.
In industrial context, it becomes difficult and often impractical to have the objective of thermal comfort. This situation is due to the productive processes that often import high amounts of radiant heat for the industrial warehouses, the operations or even the absence of structural measures that reduce the impact of the variation of the outside temperature in the industrial sector.
The Health and Safety Executive (HSE) indicates that the importance of thermal comfort is equally related to the workers behavior, since they can make decisions that jeopardize their safety, for example, stop using personal protective equipment because they feel heat (Guise ,2014; Gomes, 2015).
1.2 Objectives and Research Questions
The main objective of this work is to verify the importance of the thermal environment evaluation in an industrial context using the simulation technique, and the importance that it has in the decision making of layout changes. For that, the assessmet of the thermal environment in a plant of a textile industry, was done. The assessement was conducted by experimental and simulated ways.
In order to comply with this assessment, through the layout taken and studied by Costa (2015), Guise (2014), Gomes (2015), the following secondary objectives emerge:
1. Analysis of experimental data obtained from site measurements;
2. Characterization of new sources of heat and radiant heat (including already new machines that were not inserted in Costa (2015), Guise (2014), Gomes (2015) analysis); 3. Calculation of Metabolism, through the pathways performed;
4. Calculation of the PMV, PPD and WBGT indices per point measured, using Malchaire spreadsheets;
5. Simulation of the human thermal response to the thermal environment, using a human thermal model;
1. Which are the factors the influence the thermal environment? 2. In which way do they influence it or the worker?
3. What is the impact of the thermal environment in choosing a layout? 4. What are the ideal techniques for measuring the thermal environment?
5. What impact can a thermal environment assessment tool have on decision-making to change Layout?
6. There was an improvement or impairment of the thermal comfort conditions of the worker with the change of the layout?
1.3 Dissertation Organization
The present dissertation is divided in three parts: Foreword, Developed Work and Conclusions. The Part I includes the Introduction and Literature Review. Here, some theoretical topics, such as, occupational ergonomics, thermal comfort and environment, and human thermal modeling are approached, with the purpose to contextualize the developed work in terms of theoretical framework.
In Part II, the Methodology is presented as well as the Results and Discussion. This part explains the material and proceedings used and the data obtained through the experimental and simulated way. The comparison of the obtained results and discussion are presented.
2.
L
ITERATURER
EVIEWThe human body is a thermodynamic system that produces heat and is always in interaction with the environment to achieve the thermal balance that is indispensable for human life. Therefore, there is a constant exchange of heat between the body and the environment that surrounds it, governed by the laws of physics and influenced by mechanisms of physiological adaptation, environmental conditions and individual factors. The sensation of thermal comfort is directly related to the effort made by the body to maintain the thermal balance and thus to the best perception of this process, it is next the human thermoregulation and the thermal balance of the human body (Ruas, 2002).
2.1 Portuguese legislation and international standards
The Directive nº 53/71 shows some instructions about how to proceed with thermal environment. This directive states that the conditions of temperature and humidity should be maintained within the convenient limits to avoid damage in worker’s health. When it is not possible to chance the environment, the workers should be protected through personal protective equipment.
The Directive nº 987/93 indicates that considering the working methods imposed to the worker, the temperature and humidity should be appropriate to the human organism, and, when necessary, must be placed protections for the worker agains harmful sources of heat.
The Decree-Law nº 243/86 of August, 20th has as objective “ensure good hygiene and safety conditions and better quality of the work environment in all locations that develop trade, office and service activities”. This Regulation states the environmental limits, of temperature and humidity, that a worker should be in his work location, the temperature limits range values should be between 18ºC and 22ºC, reaching 25ºC in exceptional cases, the limits of the humidity of the work atmosphere must be between 50% and 70%, , these limits are related to commercial spaces and offices.
ISO standards for thermal environment assessment are related with hot, moderate and cold environments.
To assess an environment, there are available several ISO standards such as ISO 7243, that addresses to Assessment of heat stress using the WBGT, this standard considers the use of clothing and metabolic rate, ISO 7933, that addresses to Ergonomics of the thermal environment, ISO 9886, thar describes methods for measuring and interpreting physiological parameters, ISO 13732-1 that giver guidance for cases where it is necessary to specify temperature limit values of hot surfaces, 13732-2 describes methods for the assessment of human responses to contact with surfaces, 13732-3 methods for the assessment of human responses to contact with surfaces ,ISO 7730 presents methods for predicting the general thermal sensation and degree of discomfort of people exposed to moderate thermal environments, is based on the application in moderate environments, it is evaluated through the PMV (Predicted Mean Vote) index, that determines the thermal sensation of the body, and PPD (Predicted Percentage of Dissatisfied) index, that provides information about thermal discomfort, ISO 10551 covers the construction and use of judgement scales for use in providings reliable and comparative data on the subjective aspects of thermal comfort or thermal stress, ISO 11079 determination and interpretation of cold stress when using required clothing insulation, ISO 9886 specifies requirements for test methods as regards composition cork for the manufacture of outsoles of shoes and boots.
Beyond these, there are supporting standards, such as ISO 7726 intruments for measuring physical quantities, ISO 8996 determination of metabolic rate, ISO 9920 estimation of thermal insulation and water vapour resistance of a conthing ensemble, ISO 12894 that addresses to medical supervision of individuals exposed to extreme hot or cold environments.
The ASHRAE Standard 55 (2010) that belongs to American Society of Heating, Refrigerating and Air-Conditioning Engineers Organization, specifies conditions for acceptable thermal environments and is intended for use in design, operation and commissioning of buildings and other occupied spaces, the standard is applicable to healthy adults in indoor spaces designed for occupancy for periods not inferior to 15 minutes (ASHRAE 55:2010).
To calculate de values of PMV-PPD index is necessary to calculate the metabolism and the clothing, metabolism is the minimum amount of heat that a person produces in physical rest in an environment temperature of 20 ° C (ISO 7730: 2005; ISO 8996: 2004).
Metabolism is an important indicator of comfort or stress resulting from exposure to a thermal environment. The clothing insulation, expressed in Clo and characterized by the total thermal resistance of the Icl garment, provides thermal resistance between the skin surface and the environment. (ISO 8996: 2004)
2.2 Factors that influence human thermoregulation with the environment
In warm or cold environments, there can be an influence due to several factors such as, for example, gender, degree of acclimatization and age (Epstein & Moran, 2006). The forms of behavioral actions, in other words, adaptation, can also influence the thermoregulation and thus the acceptance of temperature (Djongyang, Tchinda & Njomo, 2010).
Age, hot temperatures, generally affect older people due to metabolic rate generally. (Parsons, 2003). As cited in Parsons (2003), however the diferente of this variation is not significant between elderly people and young adults.
Gender, because according to several studies, females tend to be more sensitive to deviations of temperature, but this difference is statistically irrelevant, around 5%. As cited in Araújo (2012), show that the discomfort is more frequent in women, but the diference can be due to the lighter cloth of women comparatively to men. So, it seems that there are no significant differences between men and women when exposed to the same temperatures (Parsons, 2003; Islam, 2005; Rodrigues, 2007).
Acclimatization is the process physiological changes in response to natural changes in the external environment, through blood flow and cardiac rhythm variations, which increase the tolerance of the individual to a thermal environment, for an extended period (Talaia, 2013). According to Miguel (2005) “when the Men is exposed to the heat in repetitive and prolonged way, develops adjustments that helps him support it better” and during the first 15 days of work, the worker should be considered nonacclimatized.
Adaptation is the quality of accommodating to a particular situation, a person is an eminently adaptive being, is a behavioral phenomenon is related to the actions that the individual can take to feel comfortable. Those actions can be simple modifications in activity levels (Humphreys, 2005; ISO 7730:2005, Araujo, 2012).
2.3 Thermal environment
The thermal environment can be defined as the set of thermal variables of the station That influence the worker's body, thus being an Important that it intervenes, directly or indirectly in the health and well-being of the same, and in carrying out the tasks assigned to it.
Hot thermal environments can have consequences ranging from the sensation of thirst or heat, lack of concentration, general discomfort and therefore to the possible decrease of performance and productivity. In extreme situations, they can cause more serious health problems, such as
sunstroke, collapse and even death. Exposure to a particular warm environment can lead to a lack of enthusiasm for work and a consequent increase in irritability. Uncomfortable people lose their motivation and tend to be slow, reducing productivity. According to Parsons (2003), quoted by Guise (2014) there is no doubt that the warm, moderate or cold environment can interfere with human activities, affecting task performance and influencing productivity. The thermal environment is one of the most important parameters to be characterized, in order to ensure comfort and improve working conditions. The thermal parameters existing in the work environment influence the workers' body, this can directly or indirectly affect their health and well-being and, consequently, in the performance of their assigned activities. The feeling of thermal discomfort in the work environment can decrease performance at work and in turn a decrease in productivity.
Man is a homeothermic being, that is, under normal conditions of health and comfort, despite the thermal variations of the surrounding environment, his body temperature assimilates a constant value close to 36.7°C, due to the fact that metabolism produces An internal heat energy equivalent to that lost to the environment. (Parsons, 2003)
According to Miguel (2005) a comfortable environment is “a neutral environment for which the physiological parameters that determine the sensation of heat have an optimum value”. Thermal comfort is, therefore, a state of mind, which makes it a subjective sensation. It can be considered, at an equilibrium state, as a lack of discomfort.
2.3.1 Thermal Stress
The effect of the hot environment on man can be psychological, psychophysiological and pathological. The psychological problems are related to the state of malaise and discomfort, psychophysiological is related to the increase of workload of the heart and the circulatory and pathological system to aggravation of diseases. Psychological discomfort can range from a subjective feeling of discomfort to a reduction in the efficiency of manual tasks.
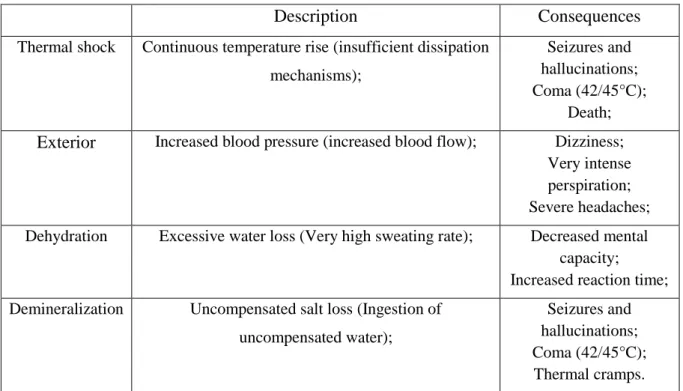
Table 2.1 shows some of the consequences that result from thermal stress in hot thermal environments on humans.
Table 2.1 - Consequences of thermal stress
Description Consequences
Thermal shock Continuous temperature rise (insufficient dissipation mechanisms);
Seizures and hallucinations; Coma (42/45°C);
Death; Exterior Increased blood pressure (increased blood flow); Dizziness;
Very intense perspiration; Severe headaches; Dehydration Excessive water loss (Very high sweating rate); Decreased mental
capacity; Increased reaction time; Demineralization Uncompensated salt loss (Ingestion of
uncompensated water);
Seizures and hallucinations; Coma (42/45°C); Thermal cramps.
Exposure to heat in a work environment becomes an important health and safety concern at work that may directly or indirectly affect industrial workers in the workplace. We can sugest that thermal stress is associated with high temperatures and humidity of the surrounding environment. Many work environments expose workers to extremely hot and humid conditions. There are several human factors that contribute to the sustainability of a worker to thermal stress, such as health problems, increasing age, disposition level, dehydration, alcohol intake, and the ability to acclimatise to extreme temperatures. In addition to the high ambient temperature, other environmental factors can contribute to thermal stress, such as low convection currents, high humidity, low evaporation loss and high thermal insulation levels (Daud, Abdin, Aziz, Naing ,& Nordin, 2010).
2.3.2 Heat protection/ controlling measures
The thermal environment can be controlled through the application of technical measures, practical measures in the organization of work and the use of individual protection. That is, constructive, organizational measures and individual protection. As constructive measures one can intervene in the general ventilation of the equipment or isolate the equipment of heat production. The most common organizational measures are related to the distribution of work rhythms or the introduction of acclimatization periods (usually 15 days for start-up workers). Personal protective measures, such as the provision of suitable clothing, are the last to be considered in the Safety point of view and when all other measures are not feasible. (Afonso, Piçarra, Ferreira, & Felisberto, 2010; Guise, 2014).
2.3.3 Parameters
The thermal environment is influenced by six parameters: four environmental parameters (air temperature, radiant temperature, air velocity and humidity), and two individual parameters (clothing and metabolism resulting from physical activity), which parameters must be evaluated to verify if the worker is or is not exposed to certain environmental and work conditions that can lead to thermal stress. (Parsons 2013)
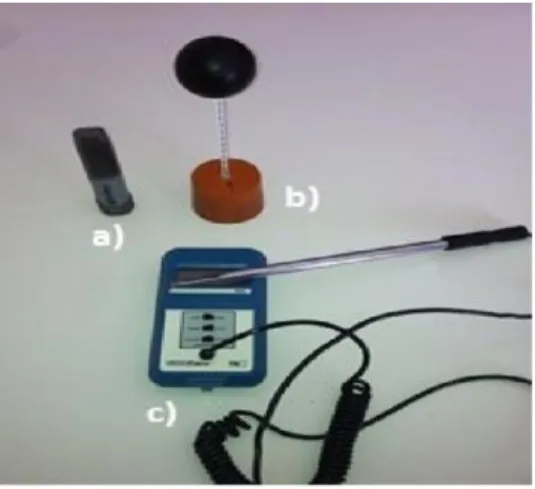
To measure air temperature and relative humidity a Data Logger model EL-USB 2 from Lascar was used (see a) in Figure 2.2). A globe thermometer was used to measure the globe temperature (see b) in Figure 2.2). The air velocity was measured using a thermo anemometer, model 8330 from TSI VelociCheck (see c) in Figure 2.2).
Air temperature is related to the heat exchanges by convection between environment and a person (Miguel,2005). It measured by a thermometer and the values is expressed in centigrade (°C) (Araújo, 2010).
Radiant temperature is measured by a globe thermometer and is expressed equally to air temperature. Its determination can be measured in function of globe temperature, air temperature and air velocity (Araújo, 2010). Air velocity around the body is another parameter that intervenes in the determination of heat exchange by convection and evaporation in Men (Miguel, 2005). It results from natural convection and from the occupants’ movements and it can be measured by anemometers and is expressed by meter per seconds (ms-1).
Air humidity is related to the determination of heat exchanges by evaporation between a environment and a person. The relation between water vapor and dry air mass it’s called absolute humidity (Wa) and the relation between the partial pressure of water vapor at humid air and saturation pressure of water vapor, at the same temperature, it’s called relative humidity (Wr) (Miguel,2005). It is expressed in percentage (%) and can be measured with a rotary psychrometer (Araújo, 2010).
The relative humidity is expressed as a percentage and corresponds to the proportion of water the air contains, given the temperature and pressure present, and the maximum volume of humidity it may contain. It can be said that relative humidity is the ratio of the partial pressure of water vapor in the humid air to the saturation pressure of water vapor at the same temperature. The humidity of the air in conjunction with the air velocity intervene in the loss of heat by evaporation. With increasing temperature, it increases the difficulty in heat losses by convection and radiation, so the organism increases its elimination by evaporation. When air is saturated with water vapor, evaporation is interrupted, and the body loses the ability to lose heat through this mechanism. In case the air temperature is higher than the skin temperature, the consequence will be an increase in body temperature. However, in case of air being dry, the heat losses continue despite the higher temperatures.
Clothing can be seen “as a layer or layers of barriers that protect the body against unsuitable physical environments” (Li, 2010). The clothing insulation is characterized by the total thermal resistance of clothing (Icl), and provides a thermal resistance between the skin surface and the environment (Miguel, 2005; Parsons, 2003). It is a crucial factor in heat loss and comfort changes. The unit Clo corresponds to a clothing insulation of 0.155 K.m-2. W-1. Clothing can
reduce energy consumption when used appropriately according to the season and outside weather conditions (Bradshaw, 2006). Researchers normally estimate the clothing insulation
values using tables but in detailed studies, it is asked to the occupants to complete a checklist, to select a more precise Clo (Charles, 2003).
Metabolism is expressed in W.m-2 and it is the least heat produced by a person, in rest, at 20°C (Miguel, 2005). It also can be used the Met unit that corresponds to 58.15 W.m-2. It can be determined directly by calorimetry5 or indirect calorimetry, but it is normally measured with the resource to tables of estimates of metabolic heat (Parsons, 2003; ISO 7730:2005).
Metabolism is an important indicator of comfort or stress that results of the exposure of a certain thermal environment (ISO 8996:2004; Rodrigues, 2007). When a person performs an activity, whether mental or physical, metabolism increases to provide energy. However, even if the person is not performing any activity but body heat loss increases and internal temperature decreases, metabolism also increases, to stabilize the temperature (Bradshaw, 2006).
2.4 Metabolism
The human body can regulate heat exchanges with the environment to maintain a constant temperature, but when in conditions of extreme heat, cold or wind, Man uses clothing as a means of helping the body adapt to the environment. Thus, comfort models may also include the effect of presence or absence of clothing. When the clothing, considered in two layers, enters the process of heat exchanges, the transfers of moisture and heat are dissipated through the skin. Transfers are divided into two parts: the outer layer of clothing takes the properties of the same and makes exchanges with the air through convection and radiation, and the inner layer takes the properties of the air making changes with the skin. (Parsons, 1999)
According to ISO 8996 (2004), the metabolic rate can be obtained by three methods, which differ in the accuracy of the results and practical applicability.
The first one is the determination of the rate of metabolism by measuring oxygen consumption and carbon dioxide production is the most accurate method of obtaining results, however it is a method of little use. The method consists in obtaining the volumes of oxygen consumed and of carbon dioxide produced, from the analysis of the gas expired by the worker in a representative period of his work cycle. The procedure for collecting the expired air is a function of the physical request of the activities.
The second method proposed by ISO 8996 (2004) is record the heart rate at work to obtain the metabolism. This method is not as accurate as the previous one and is based on the fact that for each person there is a linear relationship between frequency and consumption of oxygen and
therefore also between it and metabolism. This relationship is individual and depends on age, sex and physical ability. Once the relationship has been established, it is possible to calculate the metabolic rate of a person as a cycle from the oxygen consumption obtained from the heart rate record.
The third and last one is the estimation through tables provided by ISO 8996 (2004), to obtain the rate of metabolism. There are four types of tables with the reference values. The first two, with a high error potential, classify the metabolism rate (low, moderate, high and very high) by type of activity or occupation (carpenter, painter, teacher, etc.) In the other two types, which enable improved results than the previous ones, the work is detailed in specific activities, such as moving objects, climbing stairs, walking at ground level, etc. or activities are divided in terms of movements and efforts. In the latter case, the metabolism of a given work is calculated by summing up, to the basal metabolism, the plots because of body posture, movements and efforts.
2.5 Assessment by PMV-PPD indexes
The PMV index, developed by Fanger in 1970, later adopted by ISO 7730, refers to the subjective opinions of people in the workplace. This index predicts the average voting value of a large number of people on a thermal sensation scale. So three positive points correspond to feelings of hot, zero to comfort feeling and three negative points to feelings of cold (ISO 7730, 2005).
Table 2.2 - Seven-point thermal sensitivity scale (ISO 7730)
Value Sensation +3 Very hot +2 Hot +1 Slighty hot 0 Neutral -1 Slighty Cold -2 Cold -3 Very Cold
The equation 2.1 represents PMV:
𝑃𝑀𝑉 = (0,303. 𝑒0.036𝑀+ 0,28). 𝐿 (2.1)
According to ISO 7730 of 1984, the combined PMV / PPD index is recommended for the characterization of comfortable environments. For a thermal comfort situation, the PMV limits can be considered values between - 0.5 and + 0.5 and for PPD less than 10%.
PMV, also used to predict the number of persons that feel uncomfortable either by hot or cold excess, can be incorporated in PPD índex. This, establish the number of persons that feel thermal uncomfortable, being the ones who voted in the categories: very hot, hot, cold or very cold (Guise, 2014)
It can be determined by equation 2.2:
𝑃𝑃𝐷 = 100 − 95. 𝑒−(0,0335.𝑃𝑀𝑉4+0,2179.𝑃𝑀𝑉2) (2.2)
PMV-PPD model is the one used in ISO 7730 (2005) and ASHRAE 55 (2013), as the standards most used to assess thermal comfort of neutral environments. According to the standards, thermal environments that are considered comfortable should have a PMV between -0.5 and +0.5 and a PPD inferior to 10%. When PMV equals zero then thermal neutrality occurs. In the Figure 2.2 we can see how the relationship beetween PMV and PPD is characterize.
2.6 Assessment by WBGT index
The index, when analyzed with clothing and metabolism resultant from physical activity, shows if determined hot environment constitutes risk to the worker (Parsons, 2006; 2013).
The index to assess hot thermal environments, purposed by ISO 7243:1982, is the Wet Bulb Globe Temperature (WBGT) This index was developed by Yaglou and Minard, in 1957 (as cited in Parsons, 2006), with the intuit to control the accidents caused by heat at military training camps of the Army and Marine and is referred by many authors as the most adequate index to industrial application (Budd, 2008; Pourmahabadian, Adelkhah & Azam, 2008).
Calculation of the indoor WBGT index requires the combination of two measures: the natural wet temperature (𝑇𝑛ℎ) and the global temperature (𝑇𝑔). In an external environment where direct solar radiation is present at the workplace, it is necessary to know the air temperature (Ta), in equation 2.3 it shows WBGT calculated in outdoors (Lemke & Kjellstrom, 2012).
(2.3)
In equation 2.4 it shows WBGT calculated inside or outsider in conditions of no direct wave radiation
(2.4)
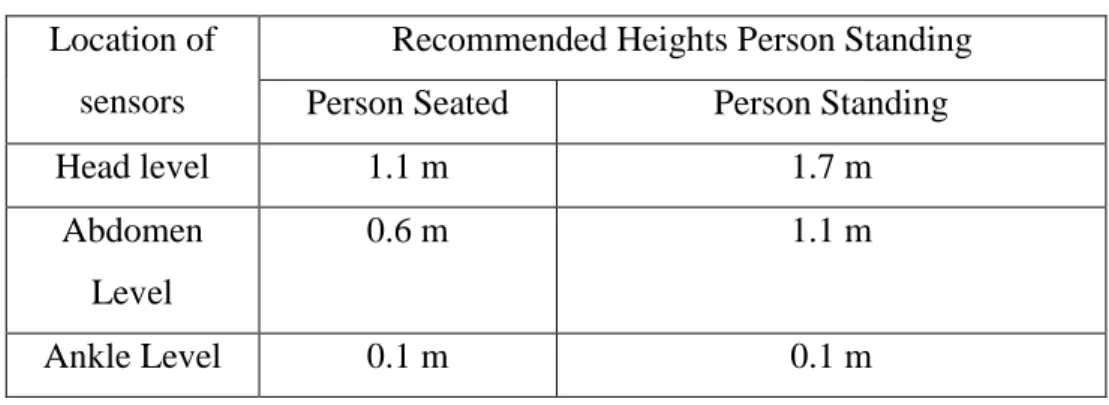
According to ISO 7726 (1998) and referred to by Lamberts et. al (2014), a surrounding environment may be homogeneous or heterogeneous. Homogeneous environments are those that the variations in the values of the physical parameters in the place around the people are less than 5%. A heterogeneous environment presents a variation of more than 5% in the values of the physical parameters in the space around the people (Lamberts et al., 2014, Gomes, 2015). When we have an homogeneus environment, determined by a series of measurements performed on the location and on the intended turn, in three levels (Table 3), head, abdomen and ankle, we were able to confirm what kind of environment we were facing, it is only necessary to make the measurements in one level, abdomen, in relation to the ground level, since the parameters existing in the work place of the workers are close to constant, and then calculating the WBGT index at that level.
Table 2.3 - Levels of measurements for the physical parameters of an environment
Location of sensors
Recommended Heights Person Standing Person Seated Person Standing
Head level 1.1 m 1.7 m
Abdomen Level
0.6 m 1.1 m
Ankle Level 0.1 m 0.1 m
2.7 Human Thermal Modeling
In order to simulate the human thermal response to the thermal environment, different models and techniques have been used ranging from experimental mannequins to very sophisticate and complex numerical models (Rodrigues, 2017).
Computation Fluid Dynamics (CFD) has been used mainly to simulate the thermal environment and to predict the values for the ambient parameters (Murakami, Kato, & Zeng, 2000; Costa, Teixeira & Loureiro, 2015).
Manikins can simulate the human thermal response, in various conditions of a certain environment and also, numerical models of the human thermoregulation and thermal comfort can be found in the literature. Dear et al. (2013) made a good review about the evolution of these models.
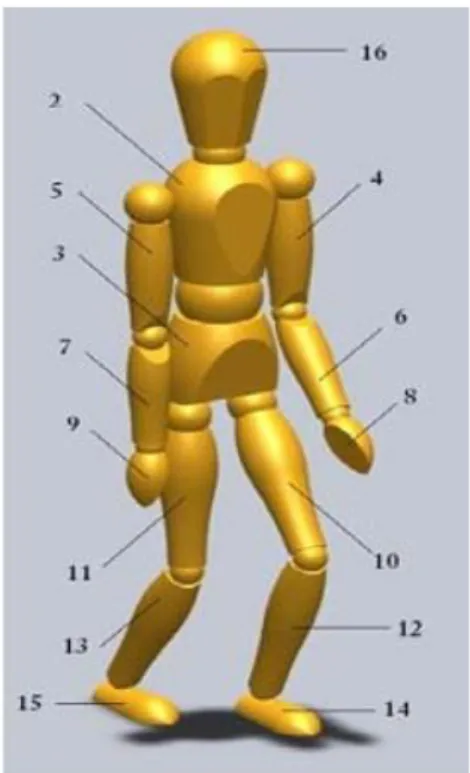
The human body is simulated as a set of body segments with different constitution and properties. But in general, the current models are based on the Stolwijk’s (1971) thermoregulation model which assumed the body divided into six different segments. Several authors used 16 segments (head, chest, back, pelvis, left shoulder, right shoulder, left arm, right arm, left hand, right hand, left thigh, right thigh, left leg, right leg, left foot and right foot (Huizenga et al., 2001; Wan & Fan, 2008; Teixeira el al, 2010).
The model of Teixeira el al (2010) has been developed at University of Minho and it has been used with success in modelling the response of the human body into different environments (Teixeira et al, 2015; Teixeira et al, 2016). The human body is divide into 16 segments (Figure 2.4) as other models and each body segment is composed of three layers – core, muscle and skin. Accounting to the use of clothes, they are simulated as two additional layers and heat and moisture exchanges are simulated as well (Teixeira et al., 2010).
3.
M
ETHODOLOGYIn this chapter, the applied methodology in this work is presented and discussed, always taking into account the main research objective.
This study has as main objective the follow-up of a study conducted by Guise in 2014 and Gomes in 2015 (Guise, 2014; Gomes, 2015). In the study carried out by Guise (2014), in Continental-ITA, an analysis of the environmental parameters and a characterization of the activity was carried out for the company's layout. In the study carried by Gomes (2015), those parameters measured by Guise (2014), have been placed in the modeling software of the human body in order to evaluate how it can affect each part of the human body when it performs certain tasks in a given course, previously studied and defined.
With the change of this layout to the current one, we intend to verify, with the accomplishment of new measurements to the place, if this change of layout, did indeed change or not the parameters measured and in what scale affect the worker.
3.1 Characterization of the thermal environment in study
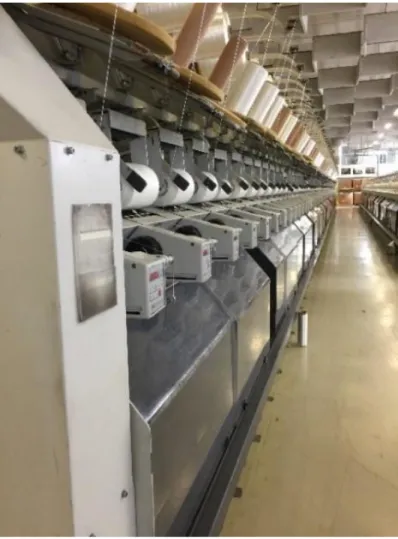
The twist sector was selected for the evaluation of the thermal environment. This sector was selected due to several factors, such as the demanding of the productive process and the occupational health experience of the technician.
Following on from other studies carried out in connection with the layout in this same section, where data were collected by Guise (2014) and later modeled in the human body modeling software by Gomes (2015), in order to understand how effectively the worker felt the temperature and humidity throughout their natural work activity, a change of layout took place, which led to a need for a new study of this layout, being necessary the gathering of new experimental data of the section and a new modeling of these data in the modeling software of the human body.
The twist section contains four winders, of which two are specialized at the edges of the wire and two are specialized in wire, with a maximum speed of 3,000 RPM and a maximum power
of 7.5 kW; and twenty-one twisters, the maximum speed being between 9,000 and 10,000 RPM, and its maximum power of 140 kW. Workers are required to carry out their previously assigned activities with the same frequency on all machines. Then, according to the production process carried out by the Company, the process is briefly discreet. Wire coils are supplied on pallets by external suppliers and transported to an area closer to the fans to facilitate the supply of machines. The coils go through the winding process to obtain the proper size so that they can be used in the fans. The new coils are used to fuel fans in cars with capacity for 72 units of coils, 36 on each side of the car. These cars are placed in an intermediate storage for later transported to the weaving process.
Figure 3.1 - Twisters corredor
3.2 Selection of the measuring point and strategy
Following Guise (2014) and Gomes (2015), it was determined that the shift from 2:00 p.m. to 10:00 p.m. (afternoon shift), the minimum and maximum PMV value observed was 3.87 and
4.81, respectively, and a mean is 4,39 was then determined that it would be the turn to which a new study would be developed after the site layout change.
The main parameters for assessing thermal comfort are the average radiant temperature, relative humidity, air temperature and air velocity. In order to carry out the measurements of the previously discussed parameters, several equipment and procedures were used to measure the measurements as accurately as possible. The equipment used was a globe thermometer for measuring worker exposure to radiant heat, an anemometer term for air velocity measurement and a USB Data Logger for measuring air temperature and humidity and dew point.
In order to determine the levels at which measurements were to be taken, they were carried out at three different levels, namely the soil level (0.10 m), trunk (1,10 m) and head (1,70 m), in order to determine whether or not there were significant differences between these points. These diferences where found small and so, it was established, that measurements would only be taken at the trunk level.
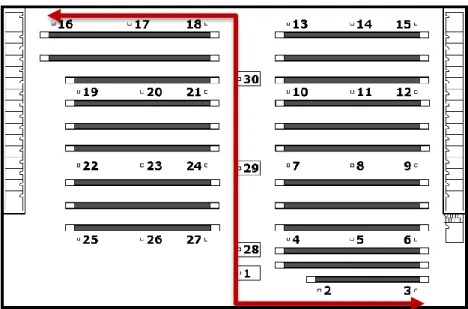
Thirty diferente points were defined for measuring. The measuring equipment was placed on a tripod at the previously established level so as to remain stable during the measurement period for greater precision of the values.
The locations where measurements were taken are shown in Figure 3.2.
3.3 Activities
The activities described here are a relevant factor for the calculation of the metabolic rate in the twist section. These activities, which were described in Guise (2014), were also verified by direct observation in locu in the present work. This confirms the existence of 10 essential tasks:
1) Lower the fixed shims, replace the spool spool and collect the empty tubes; 2) Insert a new coil in the fixed shims;
3) Connect the bobbin wires to the fixed cornering bobbins and raise them; 4) Remove the empty tube from the bottom of the fan;
5) Insert a new coil into the bottom of the fan; 6) Remove coil of twisted wire;
7) Insert an empty tube and connect the wires to be twisted again; 8) Unload the machine (move the fan coils to the corners);
9) Push the carriage with the reels to load the fan; 10) Checks.
The characteristics of an "average" individual are as follows:
A. A 30-year-old man weighing 70 kg and 1.75 m in height (body surface area of 1.84 m2);
B. A 30-year-old woman weighing 60 kg and 1.70 m tall. (body surface area of 1.69 m2).
3.4 Parameters
3.4.1 Average radiant temperature
Radiant temperature consists of the average temperature at which the surface of an individual is located in a given location and is a measure of heat lost by radiation from the body. This value, the average radiant temperature, may be a little higher or a little lower than that of the air temperature, because it expresses the presence of different temperatures that affect only one place, exchanging heat through the radiation.
To obtain these values, measurements were made with a globe thermometer, and through equation (3.1), it was possible to convert to mean radiant temperature (TRM).
1 4 4 8 0,6 273 273 2,5 10 a a TG TRM v TG T (3.1)Since the globe thermometer lacks a longer stabilization time than the rest of the equipment, it was defined 20 minutes before the first measurement and 10 minutes before the measurements at the other points.
Where TRM corresponds to the average radiant temperature, TG is the temperature of the globe, Ta is the temperature of the air, both in °C and va corresponds to the speed of the air. (ISO 7726)
3.4.2 Relative Humidity
The relative humidity is expressed as a percentage and corresponds to the proportion of water the air contains, given the temperature and pressure present, and the maximum volume of moisture it may contain. It can be said that relative humidity is the ratio of the partial pressure of water vapor in the humid air to the saturation pressure of water vapor at the same temperature. The humidity of the air in conjunction with the velocity of the air intervenes in the loss of heat by evaporation. With increasing temperature, it increases the difficulty in heat loss by convection and radiation, so the body increases its elimination by evaporation. When air is saturated with water vapor, evaporation is interrupted and the body loses the ability to lose heat through this mechanism. In case the air temperature is higher than the skin temperature, the consequence will be an increase in body temperature. However, in case of dry air, the heat losses continue despite the higher temperatures.
Relative humidity was measured using the USB Data Logger. This equipment was programmed by the "Easy Log" software that would collect data every minute until the rest of the measurements.
3.4.3 Air Temperature
The air temperature corresponds to the dry temperature of the ambient air that circulates around people and determines the flow of heat between the person and the air, also called dry bulb temperature (TBS) is the main factor of thermal comfort. (Águas, 2000)
The sensation of comfort consists in the loss of heat of the body by the differential of temperature between the skin and the air, complemented by the other thermoregulatory mechanisms. As a consequence, heat is produced by the body through metabolism and its losses are lower when the air temperature is high or higher when the temperature is lower.
The air temperature was measured using the USB Data Logger. This equipment was programmed by the "Easy Log" software that would collect data every minute until the rest of the measurements.
3.4.4 Air velocity
This measurement parameter is one of the most difficult to measure because it corresponds to the movement of the air relative to the object, varying in time and space. It has a great impact, since its effect is associated, either to temperature, convection or air humidity, by the effect of evaporation.
The speed unit in the international system is the meter per second (m / s) and is determined by an anemometer. The movement of the air favors the effects of evaporation on the human body, removing the water in contact with the skin more efficiently and thus, reducing the sensation of heat.
This parameter was measured with an anemometer term. With this equipment was established to wait about 5 minutes before the measurements.
3.4.5 Metabolism
Metabolism is heat that is continuously generated deep inside the body by chemical processes, which ultimately involve the oxidation of the food we eat by the oxygen in the air we breath. Even when we are lying quite still or asleep and our bodies are only 'ticking over,' metabolic heat is produced at a rate equivalent to the power consumption of a 60 watt electric light bulb. During physical work the muscles of the body convert about only 20% of the chemical energy used into mechanical power, and the other 80% appears as heat. All the heat generated in the deep tissues must be brought by the blood stream to the skin surface where it is dissipated to the air.
The metabolism was calculated according to the ISO 7730:2005. A full description of this calculation is provided. In order to obtain the metabolic rate, a careful description of the workers activity was made. To achieve this, each activity was divided in different tasks and through
direct observation a careful description was made. Another important variable used to calculate the metabolism is the task time in relation to the total work time.
According to ISO 7730:2005, metabolism is calculated through the equation:
(3.4)
Where it’s considered M1 the metabolic rate for body posture, M2 the metabolic rate for type of
work, M3 the metabolic rate for body motion, Mbasal the basal metabolismo that equals the
value of 44 and Barea represents de body suface area that equals the value of 1,8.
Table 3.1 - Metabolic rate for body posture
3.5 PMV/PPD and WBGT
The PMV is an index that predicts the average value of the votes of a large group of people on the 7-point thermal sensitivity scale (see Table 2.2), based on the human body's thermal balance. Thermal equilibrium is obtained when the internal production of heat in the body equals the loss of heat to the environment. In a moderate environment, the human thermoregulatory system will automatically attempt to modify skin temperature and sweat secretion to maintain thermal balance.
The PMV, PPD and WBGT indices were recalculated using the Malchaire, Genhardt and Piette (1999) spreadsheet for each of the three levels measured in their respective work shifts. The input variables were the environmental parameters (air temperature, globe temperature, relative humidity and air velocity) and individual parameters (metabolism and insulation of clothing).
Body posture Metabolic rate (w/m2)
Sitting 0
Kneeling 10
Crouching 10
Standing 15
Figure 3.3 - Malchaire Table
3.6 Human Thermal Modeling Software
The human body simulation software was used in order to compare the experimental results with the simulated data. This software was written in Fortran and runs in Microsoft Visual Studio.
This software analyzes the human response when submitted to different thermal environment conditions, allowing to simulate the human response to the experimentally obtained environmental conditions.
The human body software helps to understand whether the worker undergoes thermal stress or not, since it is based on differential equations of heat and mass transfer and can predict the
influence of parameters of thermal comfort on the temperatures and humidity of the body and clothing.
The human body software is based on differential equations of heat and mass transfer and can predict the influence of thermal comfort parameters on body and clothing temperatures and humidities (Teixeira et al., 2010).
The human body is divided into 16 diferent parts, represented in Figure 2.3. Part (1) is the heart - lungs, (2) trunk, (3) abdomen, (4) left arm, (5) right arm, (6) left forearm, (7) right forearm, (9) right hand, (10) left thigh, (11) right thigh, (12) left leg, (13) right leg, (14) left foot, (15) right foot and part (16).
The values of metabolism, clothing isolation and experimentally measured environmental conditions are provided to the program.
The main objective was to simulate the human response to different conditions, using as inputs the environmental and individual parameters previously mentioned.
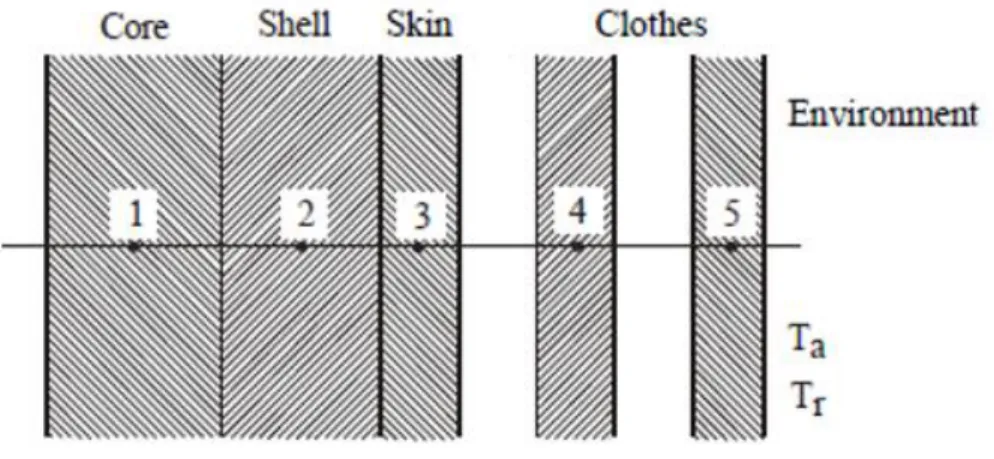
The human body can be considered covered with clothing or naked. When it is bare, the heat exchange with the environment is done through the mechanism of convection, radiation and evaporation. When the body is covered with clothing, it is considered two layers, that is, there is a heat exchange of the skin with the first layer of clothing and the last layer of clothing makes changes of heat with the air by means of convection and radiation (Teixeira et al., 2010). As is shown in Figure 3.4, part (1) is considered as a unique system of blood vessels, the other 15 parts of the body are divided into three layers: the core, the shell (or muscle) and the skin. The two layers of clothing can also be seen in figure 3.4, the layer (4) is in contact with the skin and the layer (5) is in contact with the surrounding environment.
Equations of the thermal balance
For each body part (1 - 16) and for each layer (core, shell/muscle and skin) were considered thermal balance equations (Teixeira et al., 2010).
Equation 3.3 represents the heat balance of the first layer of the human body, where i represents parts 2 to 16 of the body, K is the coefficient of heat transfer by conduction. The first term of the equation represents the heat exchange between the heart system lungs and the nucleus of parts i of the human body. The second term represents the heat exchange by conduction between the muscle and the nucleus. The last term represents the metabolic heat produced in the nucleus of each part i of the body. (Gomes 2015)
(3.3)
Equation 3.4 representes the heat balance of the second layer of the human body, the muscle, where 𝑪̇ is the capacity of the heat flow rate and the index S is the sweat. The first term represents the heat exchange between the heart-lungs system and the muscle of the i-parts of the body. The second term corresponds to heat transfer by conduction between the two layers, nucleus (1i) and muscle (2i). Also in the third term is heat transfer by conduction, but between skin (3i) and muscle (2i). The fourth term represents the metabolic heat produced in the muscle layer of part i of the body. The last term is the heat lost by the sweat that is assumed to be produced in the muscle layer. (Gomes 2015)
(3.4)
The heat balance of the third layer of the human body (considered naked), the skin, is represented on equation 3.5 where 𝒎̇ is the mass flow rate, Δ𝒉 is the enthalpy of vaporization per unit mass and the index g stands for water vapor. These terms represent heat transfer by conduction (K) between skin (3i) and muscle (2i); by radiation (rad), between the skin and the environment and by convection (conv) between the skin and the environment, respectively; by the sweat produced in the muscle layer and by passing the skin layer, respectively, and, finally, by the evaporation that occurs on the surface of the skin.
(3.5)
Where the first term represents heat transfer by conduction between the skin layer 3i and the muscle layer 2i. The second term corresponds to the conduction between the skin layer and the first layer of clothing in each part i of the covered body. In the third and fourth terms they correspond to the heat transfer by the sweat produced in the layer of muscle and then passing the layer of skin, respectively. The last two terms represent heat transfer by water vapor (g) and transfer of liquid mass (L) to the first layer of clothes.
(3.6)
As this method solves the step-by-step equations, the initial temperature values in all parts of the body and the layers (core, muscle, skin, and clothes) and the concentration of water vapor with the tissue layers, everywhere of the covered body are given and can be modified by the user.
In table 3.2 we can verify the temperatures to which the worker is at the starting point of his course, so it is possible to have a more detailed and promenorized analysis of the variation of these values along the course, such as very high changes in these values that could induce the worker in thermal stress.
Table 3.2 - Initial temperature values of each part of the body in the three layers.
The main objective of the program is to estimate the temperature as a function of time, in the different parts of the body and for different thermal environments tested.
During the simulation of the human body were considered some parts of the naked body and other parts covered with clothes. The part of the head was considered naked. Four more parts of the human body, the left forearm, the right forearm, the left hand and the right hand were also considered nude. For the remaining parts, the body was considered covered.
Abdomen (°C) Arm (°C) Forear m (°C) Hand (°C) Lengh t (°C) Foot (°C) Thigh (°C) Head (°C) Skin Layer 33.31 33.31 32.86 33.72 35.32 33.66 34.31 33.65 Muscle Layer 36.28 34.20 34.19 35.63 35.34 35.15 35.34 36.20 Core Layer 36.96 35.55 35.59 35.69 35.84 35.27 35.83 37
4.
R
ESULTSIn this chapter, we proceeded to present the results obtained, where the experimental and simulation results will be analyzed. Data were analyzed using the IBM SPSS Statistics software V21. In the last part is presented the simulation of the human body during a given course with different environmental conditions. The results of the experimental part and the simulation part will be analyzed, then a comparison of the results of the two parts will be made. This chapter is divided into several sub-chapters.
In the first subchapter a description of the physical parameters of the thermal environment was made for the three periods that the measurements were made. This is done by calculating the metabolism. In the last sub-chapter is the simulation of the human body during a given course with different environmental conditions
4.1 Environmental Parameters
The experimental data was analyzed by SPSS, through descriptive statistic, in which we were able to obtain the following data on table 4.1, these data are relative to a description of the environmental parameters in the afternoon shift in the twist section. During the shift, the average air temperature and the globe temperature were 31.05 and 29.80, with a standard deviation of 1.44 and 1.77, respectively. The air temperature has a maximum and minimum value of 32.5 °C and 27.5 °C respectively. For the globe temperature, the maximum value was 32.5°C and the minimum of 27.5°C. The mean value of air velocity was 0,15 m/s, with a standard deviation of 0.09 m/s and ranges from 0.00 m/s to 0.40 m/s. The relative humidity had an average value of 34.67% with a standard deviation of 6.59% and has a maximum and minimum value of 50.5% and 26% respectively. All these data were developed in SPSS, through descriptive statistics of the same.
Table 4.1 - Environmental parameters measured
Points Air temperature (ºC) Humidity (%) Air velocity (m/s) Globe Temperature (ºC) 1 27.5 38 0.15 27.5 2 28.5 37 0.3 28.5 3 29.5 45.5 0.11 29.5 4 30.5 38 0.11 32 5 31.5 46 0.15 31.5 6 32.5 45 0.25 32.5 7 31.5 38.5 0.1 32 8 32 35 0.3 32 9 30.5 30 0.1 30.5 10 30.5 33 0.06 31 11 31.5 32.5 0.2 32 12 32.5 30 0.06 32.5 13 32.5 29 0.19 32.5 14 31.5 26.5 0.4 31.5 15 33 39 0.12 33 16 32.5 44 0.16 33 17 31.5 50.5 0 33 18 32.5 37.5 0.17 32.5 19 32.5 27 0.03 32.5 20 31.5 26.5 0.17 31.5 21 32 33 0.14 32 22 30 32.5 0.2 31 23 29.5 36 0.03 30.5 24 29 34 0.05 29.5 25 28.5 33.5 0.3 28.5 26 31 29.5 0.2 31 27 32.5 32 0.15 32.5 28 30 28 0.01 30 29 31 27 0.3 31 30 32 26 0.15 32
Table 4.2 - Descriptive statistics of the environmental parameters in the shift from 14h00-22h00 of SPSS
Descriptive Statistics
N Minimum Maximum Mean Std. Deviation Air temperature (ºC) 30 27.5 32.5 31.050 1.4405 Air Humidity (%) 30 26.0 50.5 34.667 6.5867 Temperature of the globe (ºC) 30 27.0 32.5 29.803 1.7748 Air Velocity (m/s) 30 .00 .40 .1553 .09790 Valid N (listwise) 30
Due to the considerable changes in layout, it was not possible to carry out the same course that was carried out in Guise (2014), although it was possible to match three points (17, 18, 19 and 16,19,18 respectively in both layout) of the course, which were also chosen for this course because their conditions seem to be more precarious.
Table 4.3 - Experimental data from Guise (2014) and experimental data from de the current study
As the table of comparisons suggests, the differences are significant, inspite of both values reach to the alarm point, but it can be concluded that in some points the air velocity has decreased which can cause a slight increase of the temperature in that zone, this increase can easily be justified by the increase in the number of machines in that measuring area.
Experimental data Guise(2014) Current experimental data Points Ta (ºC) Tg (ºC) Hr (%) Va (m/s) Points Ta (ºC) Tg (ºC) Hr (%) Va (m/s) 17 28 28.5 28 0.30 16 33 32.5 44 0.16 18 30.5 31 23.5 0.10 19 32.5 32.5 27 0.03 19 31 31 20.5 0.27 18 31 32.5 37.5 0.17