Original Article
Artigo Original
Fabiana Zambon1,2 Felipe Moreti1 Aline Cristina Tafarelo Vargas1 Mara Behlau1
Keywords
Voice Dysphonia Self-assessment Faculty Protocols Speech, Language and Hearing Sciences
Descritores
Voz Disfonia Autoavaliação Docentes Protocolos Fonoaudiologia
Correspondence address: Fabiana Zambon
Rua Borges Lagoa, 208, Vila Clementino, São Paulo (SP), Brazil, CEP: 04038-000. E-mail: [email protected]
Received: 02/09/2015
Accepted: 05/24/2015
Study carried out at the Speech–Language Pathology and Audiology Department of Universidade Federal de São Paulo – UNIFESP; Centro de Estudos da Voz – CEV; Sindicato dos Professores de São Paulo – SINPRO-SP – São Paulo (SP), Brazil.
(1) Speech–Language Pathology and Audiology Department of Universidade Federal de São Paulo – UNIFESP; Centro de Estudos da Voz – CEV – São Paulo (SP), Brazi
(2) Sindicato dos Professores de São Paulo – SINPRO-SP – São Paulo (SP), Brazil. Conlict of interests: nothing to declare.
Eficiency and cutoff values of the Voice Activity and
Participation Proile for nonteachers and teachers
Eiciência e valores de corte do Peril de Participação e
Atividades Vocais para não professores e professores
ABSTRACT
Purpose: To identify the eficiency characteristics and cutoff values of the dimensions of the Voice Activity and Participation Proile (VAPP) protocol, which discriminates the dysphonic and vocally healthy individuals; to verify if the cutoff values remain the same for a sample of teachers. Methods: Eficiency characteristics and cutoff values of VAPP data from 171 subjects were analyzed by receiver-operating characteristic (ROC) curve: 90 teachers (60 dysphonic and 30 vocally healthy individuals, with a similar mean age, p=0.418) and 81 nonteachers (48 dysphonic and 33 vocally healthy individuals, with a similar mean age, p=0.934). Results: The area under the ROC curve (AUC) and the cutoff values of the total score of VAPP for discriminating the individuals with and without dysphonia are different for the nonteachers and teachers. The nonteachers presented AUC=0.986 (p<0.001) and 4.5 points of cutoff of the total score of VAPP (sensitivity=95.8%; speciicity=90.9%); the teachers presented AUC=0.872 (p<0.001) and 14.6 points of cutoff of the total score of VAPP (sensitivity=91.7%, speciicity=75.9%). Conclusion: The cutoff values of VAPP are different for the nonteachers and teachers, being higher for the teachers but with greater sensitivity and speciicity for the nonteachers, and can be used to screen large populations with the risk of voice disorders.
RESUMO
INTRODUCTION
Communication takes on an increasingly important role in the professional market for individuals who depend on it as their main working tool. The voice is one of the essential aspects in the communication process, and its use can be dif-ferent according to the profession, the amount of use, and form of emission(1,2). In addition to the organic factor, the voice also features individual content, with the expression of emotional characteristics, revealing an individual’s personality and iden-tifying them, insofar as it relects their personal self-image and self-esteem(3). Among the professionals who use their voice, we can include teachers, receptionists, singers, secretaries, telemarketers, lawyers, ministers, and health professionals. For all of them, vocal alterations may represent a professional limitation, which can cause leaves from work, reduced income and productivity, and even the need to change profession(2).
Teachers often teach in poor conditions, for many hours a day, for a large number of students and in unfavorable environ-mental conditions. These factors, coupled with the lack of vocal training, collaborate with the high prevalence of vocal signs and symptoms and voice alterations in these professionals(4,5).
Research shows that over 50% of teachers experience voices problems in the course of their active professional life(6,7). A Brazilian study showed that teachers, when compared with the general population, show more vocal symptoms, per-ceive vocal alterations related to work, with professional limita-tions(5). For the teachers, the voice is a constitutive component of their identity as a professional and of the teacher’s impact on the students and the educational process(8,9).
Dysphonia may occur as a result of an interaction be-tween hereditary, individual, behavioral, lifestyle, and oc-cupational factors, such as background noise, environments with restricted acoustics, unclean workplaces, and stress(10,11). Because oral communication is also an instrument for social and affective relationships and leisure options, dysphonia can still cause psychological dificulties and considerable emotional, social, and functional restrictions, also affecting the individual’s quality of life(12-14).
Self-assessment instruments have been used to discrimi-nate patients or group them, predict individual results, and evaluate the effectiveness of therapy, in addition to helping the professionals to prioritize issues in the intervention pro-cess(15-17). The self-assessment of vocal alterations and the analysis of the results of a given treatment are used to verify the effectiveness of an intervention and develop directive procedures for clinical practice in health care(18). Quality-of-life protocols are important tools for assessing the impact of a particular disease. Such instruments preferably should have proven validity, reliability, and sensitivity(17).
Studies have shown that the Voice Activity and Participation Proile (VAPP)(19) is an interesting tool to assess how much a voice problem restricts and limits social and professional vocal activities and the results of a voice treatment(20-22). In addition, the VAPP provides additional information that is not included in other protocols(17). However, in the validation of the VAPP for Brazilian Portuguese(19), a cutoff score that separates dysphonic
individuals from the vocally healthy individuals has not been set. In addition, it is not known so far whether the cutoff values of this protocol are the same for certain professional groups, such as teachers, considering the particularities of dysphonia in this occupational category.
Studies state that the teacher has a greater vocal burden, not only subject to the prolonged use of the voice but also involving factors that represent additional burden, such as background noise, speaking for a long time without the proper use of voice ampliiers, and psychosocial factors(11). Teachers, when compared with the nonteachers, reported a higher frequency of complaints of vocal and physical discomforts(10). Similarly, the teachers refer perceiving that a voice problem negatively affects the future of their career, with over 20% of the teachers reporting sick leave for voice disorders, with professional and economic negative effects, while none of the other profes-sionals said to have needed to be excused from work for voice problems(10).
Thus, it is not known if the values of the VAPP scores would be the same as those found in the general population. The veriication of this aspect is important, so that this protocol can also be used in the vocal screening of the teachers, in addi-tion to its usual form of clinical applicaaddi-tion and the screening of dysphonic individuals in general, making it useful for the analysis of speciic populations.
Thus, the purpose of this study is to identify eficiency characteristics and cutoff values of the dimensions of the VAPP protocol, which discriminates dysphonic and vocally healthy individuals and verify if the cutoff values remain the same for a sample of teachers.
METHODS
The study was approved by the Ethics Committee of Universidade Federal de São Paulo – CEP – UNIFESP un-der protocol no. 0789/10, and all the participants signed an Informed Consent – IC.
alterations to any degree, regardless of the causative nature, except for individuals with acute dysphonia by inlammatory/ infectious processes and/or upper airway problems. Dysphonic and vocally healthy nonteachers were recruited by telephone or in person from the general population. Their workplaces are mainly hospitals, clinics, and public and/or private companies from various segments.
The VAPP(19) is a self-assessment instrument consisting of 28 questions divided into ive dimensions: self-perceived sever-ity of voice problem, effect on job, effect on daily communica-tion, effect on social communicacommunica-tion, and effect on emotion. A visual analog scale measures the values for each dimension, with values ranging from 0 to 100 mm. The maximum total score of the protocol is 280 points: 40 points for effects on work, 120 points for effects on daily communication, 40 points for effects on social communication, and 70 points for effects on emotion. In addition, the VAPP has two additional scores: the Activity Limitation Score (ALS) and the Participation Restriction Score (PRS). The ALS is the sum of the responses to the questions 2, 4, 6, 8, 10, 12, 14, 16, 18, and 20, and the PRP is the sum of the responses of questions 3, 5, 7, 9, 11, 13, 15, 17, 19, and 21. Both the ALS and PRS additional scores range from 0 to 100 points each.
The ROC curve indicates the different cutoff values of a test or scale, according to their levels of sensitivity and speciicity(23). The areas under the curve represent the in-strument’s power to properly classify healthy and affected individuals. A test that is completely unable to discriminate the ill from healthy subjects would have an area under the curve (AUC) of 0.5; the better a test’s capacity for discrimi-nation between these two groups is, the closer to 1.0 the area under the ROC curve will be(23). Sensitivity shows the test’s accuracy in identifying positive patients, and speciicity demonstrates its accuracy in correctly classifying the nega-tive patients(23). This technique allows the establishment of the cutoff point, optimizing the sensitivity and speciicity of a diagnostic test(23).
RESULTS
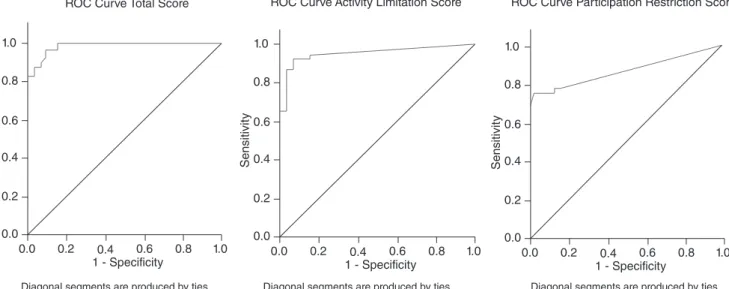
The values of AUC and the cutoff values of the total score of the VAPP were not different for the teachers and nonteachers. For the total score of the VAPP, the nonteach-ers presented AUC=0.986 (p<0.001) and a cutoff value of 4.5 (sensitivity=95.8%, specificity=90.9%); for the two additional scores, they presented AUC=0.949 (p<0.001) and a cutoff value of 2.05 (sensitivity=91.7%, specific-ity=93.9%) for ALS and AUC=0.864 (p<0.001) and a cutoff value of 1.90 (sensitivity=75.0%, specificity=97.0%) for PRS (Tables 1 and 2; Figure 1).
For the total score of VAPP, teachers presented AUC=0.872 (p<0.001) and cutoff value of 14.6 (sensitivity=91.7%, speciicity=75.9%); for two additional scores, they presented AUC=0.864 (p<0.001) and cutoff value of 1.65 (sensitivity 96.7%, speciicity=73.3%) for ALS and AUC=0.722 (p=0.001) and cutoff value of 1.35 (sensitivity = 61.7%, specific-ity=83.3%) for PRS (Table 3 and 4; Figure 2).
DISCUSSION
The identiication of eficiency of the cutoff values of the instrument as a whole and the cutoff values for maximum sensitivity and speciicity are important for allowing the use of these protocols as screening tools for large populations, for research data at different centers, for public services, and as a criterion for managing waiting lists and the evaluation of emergencies in health care(24). The quality of discrimination of an instrument depends on its eficiency value.
In this study, we conducted an assessment of the eficiency of the VAPP protocol, the identiication of cutoff values of its total score and additional scores, ALS and PRS, and its capac-ity, as a screening instrument, to separate dysphonic and vo-cally healthy individuals and teachers with and without vocal
Table 2. Sensitivity and specificity of the ROC curve for the cutoff values for the total and additional scores of the Voice Activity and Participation Profile protocol in the nonteachers
*Cutoff values – Analysis of the ROC curve.
Dimensions of the Voice Activity and Participation Profile protocol
Score Sensitivity (%)
Specificity (%)
Total score
-1.00 100.0 0.0
– – –
3.25 95.8 87.9 4.50* 95.8 90.9 5.50 93.8 90.9
– – –
245.20 0.0 100.0
Activity Limitation Score
-1.00 100.0 0.0
– – –
1.80 91.7 90.9 2.05* 91.7 93.9 2.30 89.6 93.9
– – –
87.60 0.0 100.0
Participation Restriction Score
-1.00 100.0 0.0
– – –
1.40 75.0 93.9 1.90* 75.0 97.0 2.15 66.7 100.0
– – –
81.40 0.0 100.0 Table 1. Areas under the ROC curve for the total and additional scores of the Voice Activity and Participation Profile protocol in the nonteachers
*Significant values (p≤0.05); ROC curve: values for the areas under the curve.
Total Score and Dimensions of the Voice Activity and Participation Profile protocol
Area under the curve p-value
Lower Limit
Upper Limit
Total 0.986 <0.001* 0.000 1.000 Activity Limitation Score 0.949 <0.001* 0.899 0.998 Participation Restriction
problems, seen as these professionals show a high prevalence of voice disorders related to professional use and may have different scores from the general population owing to their occupational characteristics(4,5).
The study indicates that, for the total score of the VAPP, the nonteachers presented AUC=0.986 (p<0.001) and a 4.5 cutoff value (sensitivity=95.8%, speciicity=90.9), and the teachers presented, for the total score of the VAPP, AUC=0.872 (p<0.001) and a cutoff value of 14.6 (sensitivity=91.7%, speci-icity=75.9%). It is noteworthy that the score that separates the teachers with and without vocal disorders is three times greater than the one that separates the dysphonic and vocally healthy nonteachers. Probably, owing to excessive vocal use at work, the teachers, even without voice problems, perceive a greater impact on their participation in vocal activities than the vocally healthy nonteachers(25,26). Another interesting fact is that the protocol’s eficiency was higher for the nonteachers, which may indicate that the VAPP(19) is a protocol that was developed to identify dysphonia in general, and when used for a speciic population, such as teachers, it would be interesting to associ-ate it with the use of other instruments, for each questionnaire provides information through a different point of view, although complementary(17).
Regarding the protocol’s additional scores, ALS and PRS, the cutoff values were closer between the nonteachers and teachers, which shows that the dysphonic individuals in general refer limitations and restrictions on the vocal activities, regard-less of their professions(19,22).
The VAPP proved to be a good instrument for perform-ing vocal screenperform-ing in large populations, especially in the
Table 3. Areas under the ROC curve for the total and additional scores of the Voice Activity and Participation Profile protocol in teachers
*Significant values (p≤0.05) – ROC curve: values for the areas under the curve
Total Score and Dimensions of the Voice Activity and Participation Profile protocol
Area under the curve p-value
Lower Limit
Upper Limit
Total 0.872 <0.001* 0.784 0.960 Activity Limitation Score 0.864 <0.001* 0.772 0.956 Participation Restriction
Score 0.722 0.001* 0.617 0.826
Table 4. Sensitivity and specificity of the ROC curve for the cutoff values for the total and additional scores of the Voice Activity and Participation Profile protocol in the teachers
*Cutoff values – Analysis of the ROC curve.
Dimensions of the Voice Activity and Participation Profile protocol
Score Sensitivity(%) Specificity(%)
Total score
-1.00 100.0 0.0
– – –
13.10 91.7 72.4 14.60* 91.7 75.9 15.75 90.0 75.9
– – –
235.40 0.0 100.0
Activity Limitation Score
-1.00 100.0 0.0
– – –
1.55 98.3 70.0 1.65* 96.7 73.3 1.75 93.3 73.3
– – –
26.90 0.0 100.0
Participation Restriction Score
-1.00 100.0 0.0
– – –
1.10 65.0 73.3 1.35* 61.7 83.3 1.50 58.3 83.3
– – –
26.90 0.0 100.0 Figure 1. Areas under the ROC curve for the total and additional scores of the Voice Activity and Participation Profile protocol in the nonteachers
1.0
0.8
0.6
0.4
0.2
0.0
1.0
Sensitivit
y
1 - Specificity 0.8 0.6 0.4 0.2 0.0
ROC Curve Total Score
Diagonal segments are produced by ties Diagonal segments are produced by ties Diagonal segments are produced by ties
1.0
0.8
0.6
0.4
0.2
0.0
1.0
Sensitivit
y
1 - Specificity 0.8 0.6 0.4 0.2 0.0
1.0
0.8
0.6
0.4
0.2
0.0
1.0
Sensitivit
y
1 - Specificity 0.8 0.6 0.4 0.2 0.0
nonteachers, whose AUC values were above 0.85. However, the fact that its eficiency in teachers was good, and not great, shows that it helps to map the perception of this type of pro-fessional, but not with maximum accuracy. However, owing to its unique characteristics(17), it is suggested that, at least in the case of teachers, it be used to assist in mapping voice impact but in conjunction with other protocols with higher eficiency, such as VHI or VoiSS, which are perfect classiiers, proven excellent in the discrimination of individuals with and without voice problems(27).
There are publications on the cutoff values of other self-assessment protocols on the impact of dysphonia, such as the Voice Handicap Index (VHI)(23,28), the Screening Index for Voice Disorder (SIVD)(29) (specific protocol for self-assessment of teachers) and the Brazilian validation of the Voice Symptom Scale (VoiSS)(30), demonstrating the importance of a normative value in a vocal self-assessment tool for identifying individuals with vocal problems or individuals at risk for dysphonia that require monitoring or intervention. This study contributes to the understand-ing of the impact that a voice problem has in the life of dysphonic individuals in general, specifically teachers. These data can help in the screening of large populations.
CONCLUSION
The cutoff values for the VAPP are different for the nonteachers and teachers, being higher for the latter. However, it shows a higher sensitivity and specificity for the nonteachers and can be used for screening large popula-tions at risk for voice disorders, with increased accuracy if used in conjunction with complementary assessment tools, such as other protocols, perceptual, auditory and/or acoustic analysis of the voice.
*FZ was responsible for the data collection, tabulation, and analysis and drafting of the manuscript; FM was responsible for the collection, tabulation and analysis of data, and drafting of the manuscript; ACTV was responsible for the collection, tabulation and analysis of data and drafting of the manuscript; MB was the advisor, responsible for data analysis and inal revision of the manuscript.
REFERENCES
1. Jones K, Sigmon J, Hock L, Nelson E, Sullivan M, Ogren F. Prevalence and risk factors for voice problems among telemarketers. Arch Otolaryngol Head Neck Surg. 2002;128(5):571-7.
2. Fortes FSG, Imamura R, Tsuji DH, Sennes LU. Peris dos proissionais da voz com queixas vocais atendidos em um centro terciário de saúde. Rev Bras Otorrinolaringol. 2007;73(1):27-31.
3. Park K, Behlau M. Perda da voz em professores e não professores. Rev Soc Bras Fonoaudiol. 2009;14(3):463-9.
4. Roy N, Merrill RM, Thibeaults S, Parsa R, Gray SD, Smith EM. Prevalence of voice disorders in teachers and the general population. J Speech Lang Hear Res. 2004;47(2):281-93.
5. Behlau M, Zambon F, Guerrieri AC, Roy N. Epidemiology of voice disorders in teachers and nonteachers in Brazil: prevalence and adverse effects. J Voice. 2012;26(5):665.e9-18.
6. Freitas SV. Disfonia em professoras do Primeiro Ciclo do Ensino Básico: prevalência e factores de risco. Arq Med. 2006;20(5-6):143-52. 7. Dragone MLOS. Programa de saúde vocal para educadores: ações e
resultados. Rev CEFAC. 2011;13(6):1133-43.
8. Behlau M, Hogikyan ND, Gasparini G. Quality of life and voice: study of a Brazilian population using the voice-related quality of life measure. Folia Phoniatr Logop. 2007;59(6):286-96.
9. Grillo MH, Penteado RZ. Impacto vocal na qualidade de vida de professore(a)s do ensino fundamental. Pró-Fono R Atual Cient. 2005;17(3):321-3.
10. Smith E, Gray SD, Dove H, Kirchner L, Heras H. Frequency and effects of teachers’ voice problems. J Voice. 1997;11(1):81-7.
11. Vilkman E. Voice problems at work: A challenge for occupational safety and health arrangement. Folia Phoniatr Logop. 2000;52(1-3):120-5.
Figure 2. Areas under the ROC curve for the total and additional scores of the Voice Activity and Participation Profile protocol in teachers 1.0
0.8
0.6
0.4
0.2
0.0
1.0
Sensitivit
y
1 - Specificity 0.8 0.6 0.4 0.2 0.0
ROC Curve Total Score
Diagonal segments are produced by ties Diagonal segments are produced by ties Diagonal segments are produced by ties
1.0
0.8
0.6
0.4
0.2
0.0
1.0
Sensitivit
y
1 - Specificity 0.8 0.6 0.4 0.2 0.0
1.0
0.8
0.6
0.4
0.2
0.0
1.0
Sensitivit
y
1 - Specificity 0.8 0.6 0.4 0.2 0.0 ROC Curve
Activity Limitation Score
12. Behlau M, Madazio G, Feijó D, Pontes P. Avaliação de voz. In: Behlau M, organizador. Voz: O livro do Especialista, volume 1. Rio de Janeiro: Revinter; 2001. p. 85-245.
13. Vieira MM. Voz e relação educativa. Poro: Edições Afrontamento; 1996. 14. Hogikyan ND, Sethuraman G. Validation of an instrument to measure
voice-related quality of life (V-RQOL). J Voice. 1999;13(4):557-69. 15. Berlim MT, Fleck MP. “Quality of life”: a brand new concept for research
and practice in psychiatry. Rev Bras Psiquiatr. 2003;25(4):249-52. 16. Higginson IJ, Carr AJ. Measuring quality of life: Using quality of life
measures in the clinical setting. BMJ. 2001;322(7297):1297-300. 17. Tutya AS, Zambon F, Oliveira G, Behlau M. Comparação dos escores dos
protocolos QVV, IDV e PPAV em professores. Rev Soc Bras Fonoaudiol. 2011;16(3):273-81.
18. Behlau M, Oliveira G, Santos L de M, Ricarte A. Validation in Brazil of self-assessment protocols for dysphonia impact. Pró-Fono R Atual Cient. 2009;21(4):326-32.
19. Ricarte A, Oliveira G, Behlau M, Ricarte A. Validation of the Voice Activity and Participation Proile protocol in Brazil. CoDAS. 2013;25(3):242-9. 20. Bassi IB, Assunção AA, de Medeiros AM, de Menezes LN, Teixeira LC,
Côrtes Gama AC. Quality of life, self-perceived dysphonia, and diagnosed dysphonia through clinical tests in teachers. J Voice. 2011;25(2):192-201. 21. Dragone ML. Voice activity and participation profile presenting
coordinates for readjustment of preventive action of educators. Folia Phoniatr Logop. 2011;63(1):49-54.
22. Zambon F, Ferraz P, Oliveira G, Behlau M. Voice rehabilitation effect on teachers’ voice-related life activities and perceptual analysis. Logopaedie en Phoniatrie. 2011;24:155-160.
23. Martinez EZ, Louzada-Neto F, Pereira BB. A curva ROC para testes diagnósticos. Cad Saude Colet. 2003;11(1):7-31.
24. Gräßel E, Hoppe U, Rosanowski F. Grading of the Voice Handicap Index. HNO. 2008;56(12):1221-8.
25. Kankare E, Liu D, Laukkanen AM, Geneid A. EGG and acoustic analyses of different voice samples: comparison between perceptual evaluation and voice activity and participation proile. Folia Phoniatr Logop. 2013;65(2):98-104. 26. Zambon F, Moreti F, Behlau M. Coping strategies in teachers with vocal
complaint. J Voice. 2014:28(3):341-8.
27. Behlau M, Madazio G, Moreti F, Oliveira G, Alves dos Santos LM, Paulinelli BR, Couto Junior EB. Eficiency and Cutoff Values of Self-assessment Instruments on the Impact of a Voice Problem. J Voice. 2015 in press. 28. Niebudek-Bogusz E, Kuzańska A, Woznicka E, Sliwinska-Kowalska M.
Assessment of the voice handicap index as a screening tool in dysphonic patients. Folia Phoniatr Logop. 2011;63(5):269-72.
29. Ghirardi AC, Ferreira LP, Giannini SP, Latorre M do R. Screening index for voice disorder (SIVD): development and validation. J Voice. 2013;27(2):195-200.