1
This is the version accepted for publication (post-print version) of the paper:
Cândido, Carlos J.F., Luís M.S. Coelho and Rúben M.T. Peixinho (2016) The financial impact of a withdrawn ISO 9001 Certificate, International Journal of Operations & Production Management, 36(1), 23-41.
HTML: http://www.emeraldinsight.com/doi/10.1108/IJOPM-11-2014-0540 DOI : http://dx.doi.org/10.1108/IJOPM-11-2014-0540
This article is © Emerald Group Publishing and permission has been granted for this version to appear here (https://sapientia.ualg.pt/). Emerald does not grant permission for this article to be further copied/distributed or hosted elsewhere without the express permission from Emerald Group Publishing Limited.
The Financial Impact of a Withdrawn ISO 9001 Certificate
Abstract
Purpose – The purpose of this paper is to assess to what extent the loss of the ISO 9001 certification affects the decertified firms’ financial performance.
Design/methodology/approach – Using standard event-study methods, this paper matches a sample of 143 Portuguese companies that lost their ISO 9001 certification with similar non-event counterpart firms (according to return-on-assets and size) and compares the performance of these two groups of firms using financial data collected from the AMADEUS database.
Findings – Results show no statistical significant differences in the financial performance (as measured by return-on-assets, return-on-sales, and sales growth) between companies that lost their ISO 9001 certification and their matched firms. Although the literature suggests that certification improves firms’ performance and that the benefits of certification may last over long periods of time, this paper’s results suggest that, after decertification, companies do not exhibit over or underperformance in their operations vis-à-vis comparable firms that do not undergo the same event.
Originality/value – As far as the authors are aware, this is the first study assessing the impact of ISO 9001 certificate withdrawal on the decertified firms’ financial performance.
Keywords: ISO 9000, ISO 9001, certificate withdrawal, loss of certificate, decertification, financial impact, event study.
2
1. Introduction
ISO 9001 is a coherent set of standards developed in 1987 by the International Organization for Standardization (ISO) with the purpose of facilitating international trade (Marquardt, 1999). The principles of ISO 9001 were derived from Total Quality Management, a broader and more demanding quality philosophy than ISO 9001. The less demanding principles and standards of ISO 9001 allowed it to become an easier starting point (Gotzamani and Tsiotras, 2001; Najmi and Kehoe, 2001) for companies that want to develop a standard (undifferentiated) quality system (Conti, 2004; Boiral, 2011). These characteristics of ISO 9001 also contributed to make it the most popular quality management system in the world (Viadiu et al., 2006). Indeed, ISO 9001 standards can be used as guidelines by organizations of any size, in any industry, and in any country (Yung, 1997; Marquardt, 1999; Boiral, 2011). Organizations may choose to simply follow the standards, without any formal external supervision, or they may choose to have their quality system audited by an independent agency and, by doing so, they may become ISO registered companies (Boiral, 2011). Many organizations choose to have their quality systems registered, because ‘of the perception that an independent confirmation of conformity adds value’ (ISO, 2012). In fact, most of the studies evaluating the impact of ISO 9001 conclude that certification has a significant effect on performance (e.g., Chow-Chua et al., 2003; Tzelepis et al., 2006; Chatzoglou et al., 2015). Similarly, the majority of studies suggest that certification can be a source of competitive advantage, with only a limited number of studies concluding the opposite (e.g., Conti, 2004; Casadesús and Karapetrovic, 2005).
Extant research on ISO 9001 has also addressed other themes, such as motivations for ISO certification, advantages and disadvantages of certification, net benefits, success factors, barriers to implementation, management practices, and, recently, maintenance of ISO 9001
3
certification (for a short summary of the previous research see, for instance, Wahid and Corner, 2009).
The topic of ISO 9001 certification withdrawal, however, remains to be explored. This gap in the literature might be surprising given that it has already been considered as an interesting research topic (McGuire and Dilts, 2008), and because certification withdrawal is a phenomenon of increasing importance. In fact, in the period 2006–2011, the average annual growth rate in the number of decertified firms was 25%, and the average number of new decertified companies was 60 thousand per year (ISO, 2014). Hence, this paper starts filing in an important gap in the literature as it investigates the impact of ISO 9001 certificate withdrawal on firms’ financial performance.
The current study uses a sample of all Portuguese companies that lost their ISO 9001 certification in 2008. Portugal is an interesting European country to study because it has experienced a fast growth in the number of ISO 9001 certified companies in the late 1990’s and in the beginning of the 21th century. Yet, in recent years, the number of ISO 9001 certified firms in Portugal has plummeted (ISO, 2014). Using standard event study methodology, this paper investigates whether Portuguese decertified companies exhibit abnormal financial performance (as measured by return-on-assets, return-on-sales and sales growth) when compared to similar non-event firms.
This paper is organized as follows. Section 2 reviews previous literature on the financial impact of ISO 9001 and develops the research hypothesis. Section 3 summarizes the data used in this study and explains the research methodology. Sections 4 and 5 present the results and the relevant robustness tests. Section 6 discusses the results and concludes the paper.
4
2. Literature Review
2.1 Previous studies on ISO 9001 and the financial impact of certification
The vast majority of studies on ISO 9001 are related to the impact of certification. Karapetrovic et al. (2010), for instance, identified more than one hundred studies in operations and quality management journals addressing this issue. Other research topics on ISO 9001 include the motivations for ISO 9001 certification, the success factors for the implementation of ISO 9001, and the management practices adopted during the implementation of ISO 9001. Typically, these papers cover the period before and surrounding the certification process and ignore the post-event period. One of the exceptions is the study of Wahid and Corner (2009), which addresses the problem of ISO 9001 maintenance and quote only two studies on the same topic. Studies ‘do not generally address what happens after … organizations have obtained their certification’ (Wahid and Corner, 2009). As a result, this paper contributes to understand what happens in the post-certification period by investigating whether the ISO 9001 certificate withdrawal impacts on decertified firms’ financial performance.
In order to uncover previous studies on certification withdrawal, a search was conducted in the EBSCO Host Research databases using several distinct keywords. Such search revealed the nonexistence of studies on this particular subject. Therefore, this paper reviews the literature on the financial impact of ISO 9001 and draws the research hypothesis from that literature. Table 1 presents a summary of these studies together with their main results and conclusions.
______________Table 1 Here_____________
Some of the samples employed in the studies of Table 1 are rather small (e.g., Beirão and Cabral, 2002; Pantouvakis and Dimas, 2010) but most samples are of a reasonable size,
5
i.e., more than a hundred companies and, in some cases, more than a thousand companies. Several studies (e.g., Terziovski et al., 1997; Corbett et al., 2005; Naveh and Marcus, 2005, 2007; McGuire and Dilts, 2008) have considered at least one control group of noncertified companies, allowing for a better assessment of the impact of the certification. In most cases, sample firms operate in different industries, including manufacturing and service industries. Only few exceptions focus exclusively on specific industries, such as the USA motor carrier industry (Naveh and Marcus, 2007), the European port authorities (Pantouvakis and Dimas, 2010) or the automotive supplier industry (Benner and Veloso, 2008). In general, the studies are nationwide, but some samples are composed by firms from more than one country (Terziovski et al., 1997; Simmons and White, 1999; Rajan and Tamimi, 2003; Naveh and Marcus, 2004, 2005; Feng et al., 2008; Pantouvakis and Dimas, 2010). Countries where nationwide studies were conducted are: USA (11), Greece (6), Canada (4), Spain (4), Australia (3), New Zealand (2), Singapore (2), Brazil (1), Colombia (1), Denmark (1), Holland (1), Malaysia (1), Pakistan (1), and Portugal (1).
The methodological approach used in most of these studies is based on the comparison between the performance of certified and noncertified companies. In many cases, the comparison is made between these two groups of firms (e.g., Terziovski et al., 1997; Simmons and White, 1999; Häversjö, 2000; Singels et al., 2001), whereas in several other studies, certified firms are matched with firms sharing similar characteristics in terms of assets, return on assets and/or other criteria (e.g., Lima et al., 2000; Corbett et al., 2005; Naveh and Marcus, 2007; McGuire and Dilts, 2008). Comparison between groups is typically done using descriptives (e.g., Häversjö, 2000; Casadesús et al., 2001), parametric and nonparametric tests (e.g., Simmons and White, 1999; Lima et al., 2000, Heras et al., 2002a, 2002b), data envelopment analysis (Pantouvakis and Dimas, 2010), factor analysis (e.g., Singels, et al., 2001), regression analysis (e.g., Naveh and Marcus, 2005), and, in several
6
cases, event studies (e.g., Naveh and Marcus, 2005; Corbett et al., 2005, McGuire and Dilts, 2008). Studies that do not compare certified and noncertified companies adopt other statistical methodologies, such as regression analysis (e.g., Naveh and Marcus, 2004; Psomas et al., 2013), cluster analysis (e.g., Casadesús et al., 2001), discriminant analysis (e.g., Gómez et al., 2013) and factor analysis (e.g., Psomas et al., 2013). Most papers use financial data (e.g., Naveh and Marcus, 2005) but some rely only on surveys based on Likert scales of the perception of the financial impact of ISO 9001 (e.g., Naveh and Marcus, 2004; Psomas et al., 2013).
The large majority of studies in Table 1 conclude that ISO 9001 certification has a positive and significant impact on firms’ financial performance (Simmons and White, 1999; Chow-Chua et al., 2003; Mokhtar et al., 2005; Naveh and Marcus, 2007; Nair and Prajogo, 2009; Pantouvakis and Dimas, 2010; Gómez et al., 2013; Psomas et al., 2013; Fatima, 2014; Psomas and Kafetzopoulos, 2014; Chatzoglou et al., 2015) and on firms’ stock prices (Docking and Dowen, 1999; Beirão and Cabral, 2002; Nicolau and Sellers, 2002; Corbett et al., 2005; Sharma, 2005; McGuire and Dilts, 2008). Despite the fact that some of the longitudinal studies have found supporting evidence in favor of causality between ISO 9001 certification and financial performance (e.g., Corbett et al., 2005; Benner and Veloso, 2008), other studies note that the positive correlation between these two variables does not mean causality between them (see Heras et al., 2002b; Dick et al., 2008).
Some other studies have noted, additionally, that the success of an ISO 9001 implementation cannot be ascertained by simply comparing certified with noncertified companies, because there are many internal and external factors influencing this issue. Success of implementation is, in this view, contingent on several variables, such as organizational culture, internalization of ISO practices, top management support, desire to go beyond the minimal requirements of the standard, and number of certified competitors in the
7
same industry, among other factors (Terziovski et al., 1997; Naveh and Marcus, 2004, 2005; Briscoe et al., 2005; Boiral and Roy, 2007; Benner and Veloso, 2008; Feng et al., 2008; Nair and Prajogo, 2009; Cândido and Santos, 2011, 2015; Prajogo, 2011). Nevertheless, these studies assume that ISO has a favorable impact on performance, with only the impact level depending on the internal and external contextual aspects of the organization.
In summary, there is a vast number of studies addressing the impact of ISO 9001 on firms’ performance. However, the impact of a certificate withdrawal on firms’ financial performance remains unknown.
2.2. Hypothesis definition
A thorough analysis of the studies identified in the context of this research revealed three basic pillars that are crucial to define the research hypothesis explored in this paper. The first pillar is the idea that ISO 9001 may impact positively on firms’ financial performance. Although causality has not been proven, the quality management theory and most of the empirical studies support this view. For instance, Corbett et al. (2005) found that ‘ISO 9000 certification was indeed followed by significant abnormal improvements in financial performance’ and that ‘in light of the magnitude of the effects, it seems likely that factors other than ISO 9000 certification contributed, but given the design of the study, these findings do indicate that the preparations for the first ISO 9000 certification also contributed to superior performance’. Terziovski et al. (1997) and Feng et al. (2008) – in two studies where no significant differences are found between certified and non certified companies – also conclude that ISO 9001 can contribute to organizational performance if it is well planed, well implemented and a climate of change is created in the organization.
The second pillar is the finding that the impact of ISO 9001 on the financial performance lasts long or accrues over time. Some studies (e.g. Häversjö, 2000; Heras et al.,
8
2002a; Corbett et al., 2005; and Benner and Veloso, 2008) suggest that the impact of ISO 9001 certification on firms’ performance can endure for years after the award of the ISO 9001 certificate. Heras et al. (2002a) hypothesize that ‘the implementation of any type of tool, system, or program related to quality tends to pay off in the long, rather than the short run’. Existing empirical studies corroborate this hypothesis. For example, Häversjö (2000) concluded that ‘ISO [companies] seem to achieve a positive effect from their quality management systems in the first two years after registration’. In addition, Corbett et al. (2005) concluded that the long-term effects of ISO 9001 certification are strong given that ‘cumulative improvements… appear to be strong and lasting, as all the longer-term [statistical] tests … show significant abnormal improvement in ROA… The magnitude of the longer-term effects is considerable, in the order of 1-4 percentage points.’ Other studies corroborate the idea that the ISO certification financial benefits tend to endure (e.g., Tsekouras et al., 2002), although some researchers conclude that such effects dissipate quickly over time (e.g., Wayhan et al., 2002).
The last pillar supporting the research hypothesis of this study is that certification is not a requirement as companies can adopt the standards and benefit from them without being registered. According to ISO (2012) ‘Certification is not a requirement of the standards themselves, which can be implemented without certification for the benefits that they help user organizations to achieve for themselves and for their customers’. This position adopted by the International Organization for Standardization has found support in the literature (e.g. Karapetrovic et al., 2010), which sustains an even ampler perspective. Whereas ISO (2012) suggests that the benefits of ISO 9001 are higher when the company seeks formal registration, Karapetrovic et al. (2010) admits that there can be no difference in the degree of benefits achieved by registered adopters of the standards and non registered adopters of the standards.
9
company may continue to reap some of the benefits of its previous certification and avoid a significant impact on its financial performance following the decertification event. This is a reasonable assumption as the benefits of certification seem to last over long periods (or accrue over time) and that the benefits of the ISO 9001 standards do not depend entirely upon a formal registration. Thus, drawing on the abovementioned theoretical pillars, this paper hypothesizes that firms’ financial performance is not significantly affected after ceasing to be registered with an official certification entity. In accordance, this paper formulates the following hypothesis:
Hypothesis H0: Firms that were ISO 9001 certified and lost their certificate exhibit no
abnormal operating performance in the post-event period (as measured by return-on-assets, return-on-sales and sales growth) when compared with similar firms that do not undergo the same event.
Hypothesis HA: Firms that were ISO 9001 certified and lost their certificate exhibit
abnormal operating performance in the post-event period (as measured by return-on-assets, return-on-sales and sales growth) when compared with similar firms that do not undergo the same event.
If H0 is not rejected, it may be concluded that the performance of companies that lost
their ISO 9001 certification is not significantly different from the performance of similar non-event firms. Rejection of H0 would suggest that certification withdrawal has a significant
impact on decertified firms’ financial performance. If this is the case, it also would suggest a significant impact on firms’ competitive advantage as abnormal performance is the single most important result of a sustainable competitive advantage (Porter, 1991; Barney and Clark, 2007).
10
3. Methodology
3.1. Data and summary statistics
This paper tests the impact of an ISO 9001 certification withdrawal on firms’ financial performance using a sample of 143 Portuguese firms. As described in Table 2, the sample was collected from an initial list of 318 Portuguese firms that lost their ISO certification in 2008 using data from the Institute of Portuguese Accreditation and Certification. From this initial list of firms, the final sample excludes 2 firms that cannot be found on the AMADEUS database and other 173 firms with insufficient accounting data to conduct this study.
______________Table 2 Here_____________
The final sample encompasses 143 firms that compete in seven major sectors, defined here according to each firm’s two-digit SIC code. Most (66 or 46% of total) are manufacturing firms (SIC Code 20-39), with wholesale (SIC Code 50-51) and retail firms (SIC Code 52-59) accounting for 18% and 9% of the total firms, respectively. The construction (SIC Code 15-17) and services (SIC Code 70-89) sectors are also important in the sample, as they respectively represent 12% and 10% of the total firms. Finally, the remaining 4% of firms operate in the transportation (SIC Code 40-49) and mining (SIC Code 10-14) sectors.
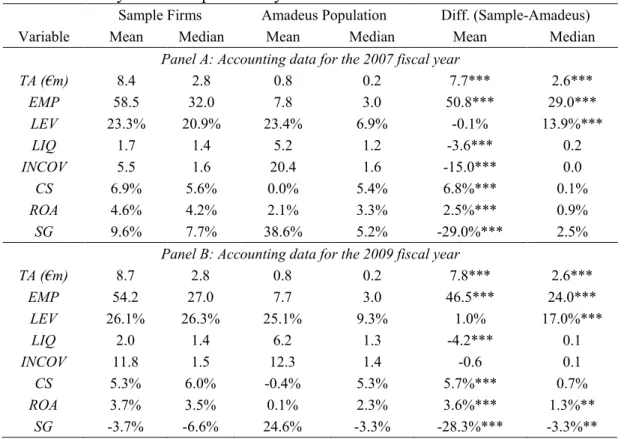
Table 3 presents additional statistics for the sample firms in the years 2007 and 2009 (i.e., in the year leading up to the loss of the ISO certification and the year that follows). For comparison reasons, parallel statistics for the population of Portuguese firms available on the AMADEUS database are also presented.1 To remove the influence of extreme outliers, all variables are winsorized at the first and the 99th percentiles.
1
Not all AMADEUS firms have data available to compute all the variables in Table 3. Yet, on average, 227,656 firms are considered when computing the statistics for the AMADEUS population presented in Table 3.
11
Panel A of Table 3 summarizes the results for the 2007 fiscal-year. As can be seen, in the year leading up to the event year, sample firms are significantly larger (as measured by the book value of assets and the number of employees) than the population of Portuguese firms present in the AMADEUS database, according to both the t-test (p<0.01) and the Wilcoxon-Mann-Whitney test (p<0.01). Results for the remaining variables are somewhat less clear. In fact, Panel A of Table 3 suggests that, on average, the sample firms are less liquid (as measured by the ratio of current assets to current liabilities), more exposed to the risk of failure (as measured by the interest coverage ratio), generating more cash (according to the cash-flow proxy), more profitable (in terms of return on assets) and growing at a much slower pace (as measured by the growth in sales) than their population counterparts. Yet, median results suggest otherwise (in particular, most tests for median differences are not significant even at the 10% level), which highlights that some extreme observations persist even after winsorizing the data.
______________Table 3 Here_____________
Panel B of Table 3 presents parallel evidence for the 2009 fiscal year-end. Results are very similar to those discussed for the year 2007 but with two important differences. In fact, Panel B suggests that, in the year following the decertification, the sample firms are more profitable than their population peers (mean difference in ROA is 3.6%, p<0.01; median difference in ROA is 1.3%, p<0.05), but are growing at a much slower pace (mean difference in sales growth is -28.3%, p<0.01; median difference in sales growth is -3.3%, p<0.05).
In a nutshell, the sample firms of this study are considerably larger before and after losing their ISO certification vis-à-vis the population firms. Furthermore, there is evidence that, only in the year following the decertification, such firms are more profitable (as measured by ROA), and growing at a slower rate (as measured by sales) in comparison to the
12
population of Portuguese firms.
3.2. Event study methodology
This paper now turns to more powerful tests to explore whether the loss of certification affects the operating performance of the sample firms. To that purpose, it draws heavily on the seminal paper of Barber and Lyon (1996), which emphasizes that the main idea of an event study is to compare the actual accounting-based performance of firms experiencing some well-defined event (i.e., the loss of ISO 9001 certification) with the performance that could be reasonably expected if no such event occurred. This study defines 2008 as the event-year (henceforth denoted as event-year t), since it corresponds to the event-year when the sample firms lose their certification. The paper then tracks the abnormal financial performance of the sample firms over a three-year period (i.e. from year t+1 through to year t+3).
A crucial issue in any event study is the measurement of abnormal performance. The early literature employs earnings-based measures as proxies for the firms’ operating performance (e.g., Healy and Palepu, 1988 and 1990; Asquith, Healy and Palepu, 1989). Yet, Barber and Lyon (1996) favor using operating income to that purpose as earnings figures can be clouded by special items, tax considerations or the accounting for minority interests. As such, in line with Barber and Lyon (1996), return-on-assets (ROA) is employed as the main operating performance measure in this study, with ROA defined as the ratio of earnings before interest and taxes (EBIT) to the average of beginning- and ending-period year book value of total assets.
To ensure the robustness of the results, this paper uses two additional measures of operating performance: a) Return-on-sales (ROS), defined as the ratio of EBIT to total sales; and b) the rate of growth in sales, defined as (Sales t − Sales t−1)/ Sales t−1. ROS expresses the profit margin that is produced per unit of sales and has the advantage of being immune to
13
problems of ‘historic cost’ since it is constructed solely with figures from the income statement. The disadvantage of ROS is that it does not directly measure the productivity of assets. As for the rate of growth in sales, this important measure helps us to understand whether the loss of certification impacts on a firm’s market share, as suggested by Corbett et al. (2005).
One of the most challenging aspects when testing the long-run impacts of an event on firms’ operating performance is specifying a firm’s predicted performance in the absence of the event. The previous literature has dealt with this issue by using a control group of firms that exhibits similar levels of risk but does not experience the event. Barber and Lyon (1996) examine various models of the expected operating performance, and conclude that the only model that yields well-specified test statistics in all situations they consider is a change model that matches sample firms on both size and pre-event performance. In particular, the expected performance of sample firm i in any period t+l using period t as the base period is given by:
i t l,
i t,
i t l, i t,
E P P PI PI (1)
where, P is the actual performance of firm i in time t and i t, PI is the performance of the i t,
control group in year t.
Control firms are matched on size and pre-event performance as follows. For each sample firm i, this study identifies all firms in the AMADEUS database that have a book value of assets in year t-2 that lies between 70% and 130% of that of the sample firm’s book value of assets in the same year.2 All firms that do not have a ROA that lies in the 90% to 110% interval of the ROA of sample firm i are then excluded from the pool of potential match candidates. Finally, match candidates that do not have enough data to conduct the current
2
One sample firm does not have a valid match candidate when employing this size requirement. The alternative 50% to 200% interval size rule is used in this case.
14
study over the three post-event years are deleted as Barber and Lyon (1996, p. 377) recommend holding the matching firm portfolio constant over time.3 Following Barber and Lyon (1996, p. 369), medians are used as proxy for the performance of the control group in year t.
The abnormal performance of sample firm i in any period t+l using period t as the base period is estimated as follows:
, , ,
i t l i t l i t l
AP P E P (2)
where Pi t l, is the actual performance of firm i in time t+l, and E P
i t l,
is given by equation (1).The event study then consists of testing whether the abnormal performance is significantly different from zero. There are several possibilities for implementing this test, with Barber and Lyon (1996) showing that the nonparametric Wilcoxon signed-rank test is always more powerful than its t-test parametric counterpart in all the situations they consider. Thus, the Wilcoxon signed-rank test is the main metric employed in this study for detecting the abnormal operating performance of the sample firms. For completeness, parallel results using t-tests are also reported.4
4. Results
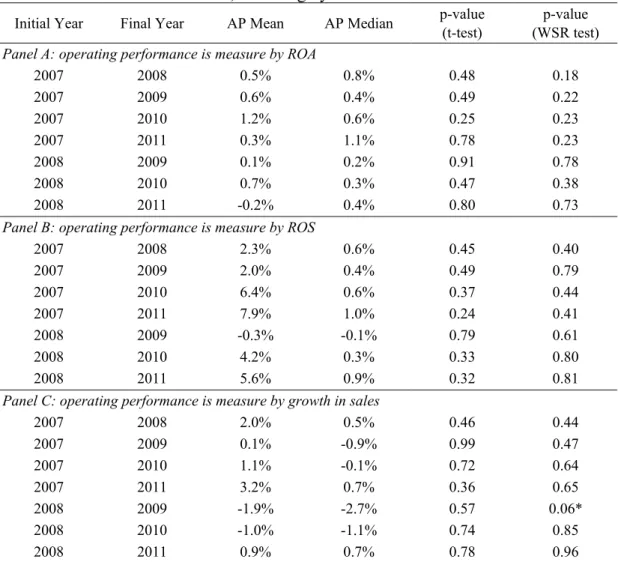
Table 4 summarizes the results of the main test. In Panel A, ROA is employed as the performance measure and its dynamics is tracked over a number of periods. To give an example, when ‘Initial Year’ is 2007 and ‘Final Year’ is 2008 (i.e. the first row of Panel A of Table 4), the abnormal performance is computed for the sample firms in 2008 when the base
3
The matching procedure yields individual control portfolios that have between 1 and 583 matched firms.
4
The Shapiro-Wilk test always rejected the hypothesis that abnormal performance is normally distributed with
15
year is 2007. As can be seen, the mean (median) abnormal performance value computed for such period is 0.5% (0.8%). These results suggest that the actual performance of the sample firms (as measured by ROA) is marginally higher than that one should expect in the period under scrutiny. Yet, the reported abnormal performance is not statistically significant at conventional levels as the p-value of the Wilcoxon signed-rank test (i.e., this paper’s main statistical test) and the t-test for this period is always higher than 10%. As such, the statistical evidence suggests that in the period that immediately precedes the loss of ISO certification, the sample firms do not exhibit an especially high or low performance as compared to their expected performance. Expanding the analysis to the remaining entries of Panel A of Table 4 is important since it sheds light on what happens once the sample firms lose their certification. As can be seen, none of the Wilcoxon signed-rank tests (or the parametric t-tests) are significant at the 10% level in the post-event periods.
______________Table 4 Here_____________
Panel B of Table 4 summarizes the results when using the ROS measure. None of the Wilcoxon signed-rank tests (or the parametric t-tests) are again significant at conventional levels. Hence, the conclusion using ROS as measure of performance is very similar to that of ROA. Panel C of Table 4 presents the results for growth in sales. In general, the same conclusions as above apply. The main difference is that one of the Wilcoxon signed-rank tests is now marginally significant (when ‘Initial Year’ is 2008 and ‘Final Year’ is 2009). Despite such variation in results, the bulk of the evidence suggests that the sample firms do not experience abnormally high or low growth in sales both in the year leading up to the loss of the certification or in the post-event periods.
Together, these results suggest that the main hypothesis of this paper cannot be rejected, i.e., that, post-event, Portuguese firms that lose their ISO 9001 certification in 2008 do not
16
experience a significant abnormal performance (as measured by ROA, ROS or rate of growth in sales) when compared to companies sharing similar size and pre-event performance. Such conclusion holds for the short- and more longer-term event periods that are considered, and does not depend on the base year that is employed to conduct the study. 5
5. Robustness tests
The main results presented on Section 4 are computed using the methodological choices that Barber and Lyon (1996) show yield well-specified test statistics in all situations they consider. Yet, it is important to verify to what extent the previous findings are robust to methodological changes related to the selection of the control firms.
In the first robustness test, control firms are matched on industry and pre-event ROA. This is because Barber and Lyon (1996, p.383) show that change models of expected operating performance that control for industry (2-digit SIC code) and pre-event performance (as measured by ROA) yield well-specified tests in samples of larger firms. This alternative matching process is important in this paper as this study’s sample firms are significantly larger than their match counterparts (see Table 3).6 The actual test proceeds as follows. First, an initial pool of match candidates is identified for each sample firm i, all of which must have the same 2-digit SIC code of the sample firm two years before the event year. All firms that do not have ROA that lies in the 90% to 110% interval of the ROA of sample firm i are then delete. Match candidates are again required to have full accounting data on AMADEUS; thus, in the last step, control firms that do not comply with such data requirement are eliminated.
5
In nontabulated results, this paper also considers an alternative five years post-event period. Doing so reduces the workable sample to 67 firms (i.e., a loss of 53%), which negatively affects the power of the statistical tests. Yet, even in this setting, this paper’s main conclusion still holds. In particular, out of the 198 t- and Wilcoxon signed-rank tests, only 22 are significant at the 1%, 5% or 10% level. These results are available from the second author.
6
Considering models of abnormal performance that match control firms on lagged ROA and 2-digit SIC code, lagged ROA and 4-digit SIC code or lagged ROA and 2-digit SIC code and size yields essentially the same result. These are available on request from the second author.
17
Following Barber and Lyon (1996, p. 369), medians are used to proxy for the performance of the control group in year t.
Table 5 summarizes the results of this first robustness test. As can be seen, ROA, ROS and growth in sales are again employed as performance measures, and the same event-periods as in Section 4 are used. Moving on to the actual results, the main finding is that the evidence in Table 5 is very similar to the results previously discussed. In particular, none of the Wilcoxon signed-rank tests or t-test employed to study the statistical significance of the abnormal performance of the sample firms is significant at conventional levels. As such, this paper concludes that using a different way to define the control firms does not alter the nature of its main results. In fact, the sample firms do not seem to exhibit any abnormal performance relative to their industry and pre-event performance peers. Such conclusion holds for both the event-period leading up to the loss of the ISO certification, and to all post-event periods explored in this study.
______________Table 5 Here_____________
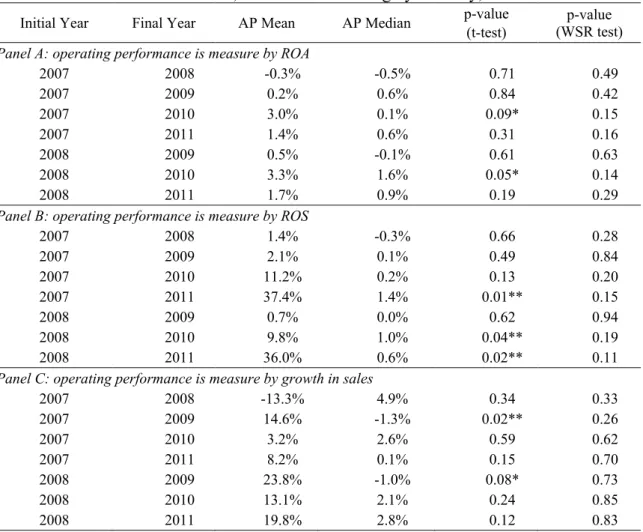
An alternative robustness test that draws on the work of Corbett et al. (2005) is now presented. This is an important paper as it investigates the abnormal performance of firms following their ISO 9001 certification, i.e., the exact opposite event that the current paper considers. Importantly, Corbett et al. (2005) do not use a portfolio of matched firms as Barber and Lyon (1996) do, but rely on one-to-one matching to compute their main results. Given the similarities, this paper also uses the alternative matching procedure presented by Corbett et al. (2005) to assess the robustness of its initial findings.
In this test, equation (1) is still used to specify the expected performance of the sample firms but now a single control firm is employed to determine the control group’s performance. In particular, for each sample firm i, the control group is now the firm in the
18
same industry (2-Digit SIC Code) that is ‘closest’ to the event firm in terms of book value of assets and ROA. Following Corbett et al. (2005), the book value of assets and ROA are transformed into z-scores by subtracting the industry mean and dividing by the industry standard deviation. This is done using data available on AMADEUS two years before the event year. ‘Closest’ firm is then defined as the firm with the smallest Euclidean distance in the two-dimensional space of z-scores to the sample firm. Moreover, in line with Corbett et al. (2005), the ROA of the control firm must lie between 90% and 110% of its sample firms’ ROA and its book value of assets must lie between 50% and 200% of the sample firm’s assets.7 In addition, match candidates are required to have all the necessary data on AMADEUS; if not, they are deleted from the pool of potential match candidate.
______________Table 6 Here_____________
Table 6 summarizes the results of this robustness test. In line with the previous tests, ROA, ROS and growth in sales are employed as performance measures and the same event-periods as above are considered. Table 6 shows that none of the Wilcoxon signed-rank tests are significant even at the 10% level. This constitutes additional evidence to support that the main research hypothesis of this study cannot be rejected. Parallel parametric results are, however, somewhat different. In particular, some of the t-test are now significant at the 5% or 10% level for ROA, ROS and growth in sales. Yet, such results should be interpreted with caution since, as previously mentioned (see footnote 4), the Shapiro-Wilk tests always reject the hypothesis that abnormal performance is normally distributed.
6. Discussion and conclusion
Previous studies suggest that, in general, there is a positive and significant impact of ISO
7
A valid match candidate cannot be found for three sample firms using this size requirement. For these particular firms, the size interval is expanded until at least one valid match candidate is found.
19
9001 certification on the financial performance of firms, and that such benefits are likely to persist or accrue for several years (Corbett et al., 2005; Heras et al., 2002a). However, despite ISO 9001 having become the most popular quality management system in the world, the number of decertified firms has increased considerably in recent years. Yet, to the best of the authors’ knowledge, no study has addressed the consequences of an ISO 9001 certificate withdrawal. This paper starts shedding light on this issue by exploring the abnormal financial performance of 143 Portuguese firms that lost their ISO 9001 certification in 2008. Results show that decertified firms do not perform differently from their matched counterparts in the post-event period. Therefore, this paper reveals that, contrary to certification, ISO 9001 decertification does not lead to any significant financial abnormal performance.
This paper’s findings contribute to the ISO 9001 literature, and have important implications for practice. On the one hand, the absence of abnormal performance following an ISO 9001 certificate withdrawal suggests that companies that spend their resources in order to get certified may end up making changes that are internalized, with such changes continuing to benefit the firm even when the certification is lost. On the other hand, failure to find evidence of abnormal performance in the post-decertification period suggests that companies may stop spending resources to make ISO related changes, which questions the idea that the benefits of ISO 9001 certification are likely to accrue for several years. Together, the results of this paper indicate that the potential benefits of a certification process persist following a certification withdrawal as firms may have internalized such benefits, but do not support the view that certification benefits accrue in the post-decertification period.
The results of this paper also contribute to discuss the competitive advantage of ISO 9001 certification since they suggest that decertification has no impact on firms’ previous level of competitive advantage. The resource based theory offers an interesting explanation to such result as it postulates that competitive advantage can only be achieved through
20
possession and use of resources that are valuable, rare, inimitable, and conveniently managed (Barney and Clark, 2007). If ISO 9001 registration is perceived as a resource, it can be argued that such registration is a valuable, rare and a somewhat difficult resource to imitate. Therefore, this quality management system is likely to contribute decisively to cost reduction, performance improvement, and differentiation (e.g., Feo and Barnard, 2004) in the post-certification period. In this view, the ISO 9001 post-certification may constitute a source of competitive advantage that, when properly internalized during the certification process, is expected to persist as a competitive advantage following a certificate withdrawal, although it does not accrue in the post-decertification period.
A comprehensive understanding on the links between ISO 9001, internalization, and competitive advantage, however, can only be achieved if one explores the reasons leading up to the certification and decertification of the firms. As Briscoe et al. (2005) suggest, there are many reasons why firms want to be ISO registered. For instance, some firms want to be registered because they perceive a quality benefit. Yet, others may want to achieve a preferred supplier status, or simply want to fulfill their costumer expectations. Complying with regulations and requirements is another reason to seek ISO certification. Decertification may also be due to different reasons. For instance, companies may decide not to renew their certification because they believe that they have already internalized its benefits. Similarly, voluntary decertification may occur if the firm considers that certification is expensive or simply perceives that its benefits are lower than its costs. Another example of voluntary decertification occurs when firms anticipate that their certificate will not be renewed. Decertification may also be involuntary when the certification body considers that the company no longer fulfills with the standards to be certified. The reasons for the ISO 9001 certification/decertification should, in principle, affect the firm’s financial performance in the years following certification withdrawal. Unfortunately, this paper cannot explore this issue
21
as the Institute of Portuguese Accreditation and Certification does not keep a record of such data. Further research, however, may explore this topic and help to understand the impact of certification/decertification motivations on the financial impact of certification withdrawal.
The conclusions and implications of this paper must be read with caution as they are drawn from a small sample of Portuguese firms that lost their ISO 9001 certification in 2008. This is a particular setting to explore this paper’s main research question since Portugal, Ireland, Greece and, to some extent, Spain and Italy, faced severe economic distress at that time. The excessive external and fiscal deficits in Portugal led to an intervention by the International Monetary Fund, the European Union, and the European Central Bank in the spring of 2011. Although this paper’s methodology explicitly accounts for this issue, as both sample and control firms experienced identical environmental conditions, further research could help understand to what extent this paper’s findings hold in different macroeconomic settings. This paper’s results are, however, clearly relevant to all firms operating in small open economies experiencing harsh macroeconomic conditions. In fact, Portugal is a full member of the European Union, the European Economic and Monetary Union, and the Schengen Area. Therefore, Portuguese firms must deal on a daily basis with their European competitors, without the Portuguese Government being able to implement any limitations on the free movement of goods, money, and people. Moreover, managers of firms operating out of countries with better macroeconomic conditions can also benefit from this paper’s results. In fact, globalization has intensified competition worldwide and, as a result, such managers are bound to compete at some stage with firms based at countries experiencing levels of economic hardship similar to those faced by Portugal in 2008.
Acknowledgments
22
References
Asquith, P., Healy. P. and Palepu, K. (1989). Earnings and stock splits. The Accounting
Review, 64(3), 387-403.
Barber, B. and Lyon, J. (1996). Detecting abnormal operating performance: The empirical power and specification of test statistics. Journal of Financial Economics, 41(3), 359-399.
Barney, J.B. and Clark, D.N. (2007). Resource-Based Theory. Oxford: Oxford University. Beirão, G. and Cabral, J.A.S. (2002). The reaction of the Portuguese stock market to ISO
9000 certification. Total Quality Management, 13(4) 465-474.
Benner, M.J. and Veloso, F.M. (2008). ISO 9000 practices and financial performance: A technology coherence perspective. Journal of Operations Management, 26(5), 611-629. Boiral, O. (2011). Managing with ISO Systems: Lessons from practice. Long Range
Planning, 44(3), 197-220.
Boiral, O. and Roy, M.J. (2007). ISO 9000: integration rationales and organizational impacts.
International Journal of Operations & Production Management, 27(2), 226-247.
Briscoe, J.A.; Fawcett, S.E.; Todd, R.H. (2005). The Implementation and Impact of ISO 9000 among Small Manufacturing Enterprise. Journal of Small Business Management, 43(3), 309-330.
Cândido, C.J.F. and Santos, S.P. (2011). Is TQM more difficult to implement than other transformational strategies? Total Quality Management & Business Excellence, 22(11), 1139-1164.
Cândido, C.J.F. and Santos, S.P. (2015). Strategy implementation: What is the failure rate?
Journal of Management & Organization, 21(2), 237-262.
Casadesús, M., Giménez, G. and Heras, I. (2001). Benefits of ISO 9000 implementation in Spanish industry. European Business Review, 3(6), 327–335.
Casadesús, M., Karapetrovic, S. (2005). Has ISO 9000 lost some of its lustre? A longitudinal impact study. International Journal of Operations & Production Management, 25(6), 580-596.
23
on firms’ financial performance. International Journal of Operations & Production
Management, 35(1), 145-174.
Chow-Chua, C., Goh, M. and Wan, T.B. (2003). Does ISO 9000 certification improve business performance? International Journal of Quality & Reliability Management, 20(8), 936-953.
Conti, T. (2004). How to conceptually harmonize ISO 9000 certification, levels of excellence recognition and real improvement. Total Quality Management, 15(5/6), 665-677.
Corbett, C.J., Montes-Sancho, M.J. and Kirsch, D.A. (2005). The financial impact of ISO 9000 Certification in the United States: An empirical analysis. Management Science, 51(7), 1046-1059.
Dick, G.P.M., Heras, I. and Casadesús, M. (2008). Shedding light on causation between ISO 9001 and improved business performance. International Journal of Operations &
Production Management, 28(7-8), 687-708.
Docking, D.S. and Dowen, R.J. (1999). Market interpretation of ISO 9000 registration. The
Journal of Financial Research, XXII(2) 147-160.
Fatima, M. (2014). Impact of ISO 9000 on business performance in Pakistan: Implications for quality in developing countries. Quality Management Journal, 21(1), 16-24.
Feng, M., Terziovski, M. and Samson, D. (2008). Relationship of ISO 9001:2000 quality system certification with operational and business performance: A survey in Australia and New Zealand based manufacturing and service companies. Journal of Manufacturing
Technology Management, 19(1), 22–37.
Feo, J. and Barnard, W. (2004). Six Sigma Breakthrough and Beyond. New York: McGraw Hill.
Gómez, J.M., Fontalvo, T.J. and Vergara, J.C. (2013). Incidencia de la certificación ISO 9001 en los indicadores de productividad y utilidad financiera de empresas de la zona industrial de Mamonal en Cartagena. Estudios Gerenciales, 29(126), 99-109.
Gotzamani, K.D. and Tsiotras, G.D. (2001). An empirical study of the ISO 9000 standards' contribution towards total quality management. International Journal of Operations &
Production Management, 21(9-10), 1326-1342.
24
Managerial Auditing Journal, 15(1/2), 47–52.
Healy, P. and Palepu, K. (1988). Earnings information conveyed by dividend initiations and omissions. Journal of Financial Economics, 21(2), 149-176
Healy, P. and Palepu, K. (1990). Earnings and risk changes surrounding primary stock offers.
Journal of Accounting Research, 28(1), 25-48.
Heras, I., Casadesús, M. and Dick, G.P.M. (2002a). ISO 9000 certification and the bottom line: a comparative study of the profitability of Basque region companies. Managerial
Auditing Journal, 17(1/2), 72-78.
Heras, I., Dick, G.P.M., and Casadesús, M. (2002b). ISO 9000 registration’s impact on sales and profitability: A longitudinal analysis of performance before and after accreditation.
International Journal of Quality & Reliability Management, 19(6), 774–791.
Ismyrlis, V. and Moschidis, O. (2015). The effects of ISO 9001 certification on the performance of Greek companies: A multidimensional statistical analysis. The TQM
Journal, 27(1), 150-162.
ISO (2012). The ISO Survey of Management System Standard Certifications – 2011:
Executive Summary. Genève: ISO Central Secretariat.
ISO (2014). The ISO survey of Management System Standard Certifications – 2013:
Executive Summary. Genève: ISO Central Secretariat.
Karapetrovic, S., Casadesús, M. and Saizarbitoria, I.H. (2010). What happened to the ISO 9000 lustre? An eight-year study. Total Quality Management, 21(3), 245-267.
Lagodimos, A.G., Dervitsiotis, K.N., and Kirkagaslis, S.E. (2005). The penetration of ISO 9000 certification in Greek industries. Total Quality Management & Business Excellence, 16(4), 505–527.
Lima, M.A.M., Resende, M. and Hasenclever, L. (2000). Quality certification and performance of Brazilian firms: An empirical study. International Journal of Production
Economics, 66(2), 143–147.
Marquardt, D.W. (1999). The ISO 9000 family of international standards. In Juran, J.M. and Godfrey, A.B. (Eds.). Juran’s Quality Handbook. New York: McGraw-Hill International Edition, pp. 11.1–11.27.
25
firms’ performance: A vision from the market. Total Quality Management and Business
Excellence, 14(10), 1179-1191.
McGuire, S.J. and Dilts, D.M. (2008). The financial impact of standard stringency: An event study of successive generations of the ISO 9000 standard. International Journal of
Production Economics, 113(1), 3-22.
Mokhtar, M.Z., Karbhari, Y. and Naser, K. (2005). Company financial performance and ISO 9000 registration: Evidence from Malaysia. Asia Pacific Business Review, 11(3), 349-367.
Nair, A. and Prajogo, D. (2009). Internalisation of ISO 9000 standards: The antecedent role of functionalist and institutionalist drivers and performance implications. International
Journal of Production Research, 47(16), 4545-4568.
Najmi, M. and Kehoe, D.F. (2001). The role of performance measurement systems in promoting quality development beyond ISO 9000. International Journal of Operations &
Production Management, 21(1-2), 159-172.
Naveh, E. and Marcus, A.A. (2004). When does the ISO 9000 quality assurance standard lead to performance improvement? Assimilation and going beyond. IEEE Transactions on
Engineering Management, 51(3), 352-363.
Naveh, E. and Marcus, A. (2005). Achieving competitive advantage through implementing a replicable management standard: Installing and using ISO 9000. Journal of Operations
Management, 24(1), 1-26.
Naveh, E. and Marcus, A.A. (2007). Financial performance, ISO 9000 standard and safe driving practices effects in accident rate in the U.S motor carrier industry. Accident
Analysis and Prevention, 39(4), 731-742.
Nicolau, J.L. and Sellers, R. (2002). The stock market’s reaction to quality certification: Empirical evidence from Spain. European Journal of Operational Research, 142(3), 632– 641.
Pantouvakis, A. and Dimas, A. (2010). Does ISO 9000 series certification matter for the financial performance of ports? Some preliminary findings from Europe. Maritime Policy
& Management, 37(5), 505-522.
26
12(SI), 95-117.
Prajogo, D.I. (2011). The roles of firms’ motives in affecting the outcomes of ISO 9000 adoption. International Journal of Operations & Production Management, 31(1), 78-100. Psomas, E., Pantouvakis, A. and Kafetzopoulos, D. (2013). The impact of ISO 9001
effectiveness on the performance of service companies. Managing Service Quality, 23(2), 149-164.
Psomas, E. and Kafetzopoulos, D. (2014). Performance measures of ISO 9001 certified and non-certified manufacturing companies. Benchmarking: An International Journal, 21(5), 756 - 774.
Rajan, M. and Tamimi, N. (2003). Payoff to ISO 9000 Registration. The Journal of
Investing, 12(1), 1-7.
Sharma, D.S. (2005). The association between ISO 9000 certification and financial performance. The International Journal of Accounting, 40(2), 151-172.
Simmons, B.L. and White, M.A. (1999). The relationship between ISO 9000 and business performance: Does registration really matter? Journal of Managerial Issues, 11(3), 330-344.
Singels, J., Ruël, G. and van de Water, H. (2001). ISO 9000 series certification and performance. International Journal of Quality & Reliability Management, 18(1), 62-75. Terlaak, A. and King, A.A. (2006). The effect of certification with the ISO 9000 quality management
standard: A signaling approach. Journal of Economic Behavior & Organization, 60(4), 579-602. Terziovski, M., Samson, D. and Dow, D. (1997). The business value of quality management
systems certification: Evidence from Australia and New Zealand. Journal of Operations
Management, 15(1), 1-18.
Tsekouras. K., Dimara, E. and Skuras, D. (2002). Adoption of a quality assurance scheme and its effect on firm performance: A study of Greek firms implementing ISO 9000. Total
Quality Management, 13(6), 827-841.
Tzelepis, D., Tsekouras, K., Skuras, D. and Dimara, E. (2006). The effects of ISO 9001 on firms’ productive efficiency. International Journal of Operations & Production
Management, 26(10), 1146-1165.
27
international diffusion model. International Journal of Operations & Production
Management, 26(2), 141-165.
Wahid, R.A. and Corner, J. (2009). Critical success factors and problems in ISO 9000 maintenance. International Journal of Quality & Reliability Management, 26(9), 881-893.
Wayhan, V.B., Kirche, E.T., and Khumawala, B.M. (2002). ISO 9000 certification: The financial performance implications. Total Quality Management, 13(2), 217–231.
Yung, W.K.C. (1997). The values of TQM in the revised ISO 9000 quality system.
Table 1. Research on the financial impact of ISO 9000
Study Results/conclusion
Terziovski et al. (1997) ISO 9000 is not significantly related to performance.
Docking and Dowen (1999) Increase in stock value and stockholders wealth, but only in the case of the smaller firms.
Simmons and White (1999) ISO companies are more profitable (ROA).
Häversjö (2000) Two years after registration the difference in rates of return between certified and non-certified firms is higher than it was before registration.
Lima et al. (2000) No difference found in performance.
Casadesús et al. (2001) 64% of the certified companies reported a considerable increase in ROI. Singels et al. (2001) Non-certified companies involved with other quality initiatives exhibited higher
performances.
Beirão and Cabral (2002) Financial performance improved after certification.
Heras et al. (2002a; 2002b) Profitable firms are more likely to seek ISO 9000 certification, but ISO certified firms do not become more profitable.
Nicolau and Sellers (2002) The market reacts positively to the award of ISO 9000 certificates. Tsekouras et al. (2002) No significant effect of ISO 9000 registration.
Wayhan et al. (2002) Limited impact on financial performance and the impact ‘dissipated quickly over time’.
Chow-Chua et al (2003) Certified firms perform significantly better than uncertified firms. Martínez-Costa and
Martínez-Lorente (2003)
Positive abnormal returns but most were not significant. Rajan and Tamimi (2003) The ISO 9000 portfolio outperformed the S&P 500 index. Naveh and Marcus (2004) ISO 9000 has a financial impact on business performance.
Naveh and Marcus (2005) The hierarchical regression corroborated the conclusion from Naveh and Marcus (2004). The event study did not.
Corbett et al. (2005) Significant abnormal improvement in financial performance.
Lagodimos et al. (2005) Significant differences in ROA between certified and non certified companies found only in the commerce industry.
Sharma (2005) Financial performance of certified firms was significantly greater than that of non-certified firms.
Mokhtar et al. (2005) ISO 9000 companies performed better than non-ISO 9000 companies. Terlaak and King (2006) There was no significant effect of ISO 9000 on operational performance. Naveh and Marcus (2007) Significant improvement in financial performance after certification.
Benner and Veloso (2008) ISO 9000 has a positive and significant effect on ROA and on Tobin’s q, but not on ROS.
Feng et al. (2008) Significant relationship between certification and business performance (at 10% significance level).
McGuire and Dilts (2008) The market reaction to ISO 9001:2000 is statistically significant and higher than the reaction to ISO 9001:1994 and to ISO 9002:1994.
Nair and Prajogo (2009) Internalization of ISO 9000 standards was positively associated with business performance.
Pantouvakis and Dimas (2010)
‘ISO certified ports are more efficient financially than their noncertified competitors’.
Gómez et al. (2013) ISO 9000 certification has a positive effect on productivity and profitability. Psomas et al. (2013) ISO 9001:2008 has a significant impact on performance.
Fatima (2014) There is an association between ISO 9000 certification and financial performance in large and medium companies, but not in small firms.
Psomas and Kafetzopoulos (2014)
‘ISO 9001 certified companies significantly outperform the non-certified with regard to ... financial performance’.
Chatzoglou et al. (2015) ISO 9000 is highly associated with improvements in overall financial performance.
Ismyrlis and Moschidis (2015)
The least important benefits were business results such as profits, costs and market share.
Table 2: Defining the sample
Frequency
Cases identified in IPAC’s database 318
Cases not found on AMADEUS 2
Cases with insufficient data on AMADEUS 173
Table 3: Summary statistics: pre-event year
Sample Firms Amadeus Population Diff. (Sample-Amadeus) Variable Mean Median Mean Median Mean Median
Panel A: Accounting data for the 2007 fiscal year
TA (€m) 8.4 2.8 0.8 0.2 7.7*** 2.6*** EMP 58.5 32.0 7.8 3.0 50.8*** 29.0*** LEV 23.3% 20.9% 23.4% 6.9% -0.1% 13.9%*** LIQ 1.7 1.4 5.2 1.2 -3.6*** 0.2 INCOV 5.5 1.6 20.4 1.6 -15.0*** 0.0 CS 6.9% 5.6% 0.0% 5.4% 6.8%*** 0.1% ROA 4.6% 4.2% 2.1% 3.3% 2.5%*** 0.9% SG 9.6% 7.7% 38.6% 5.2% -29.0%*** 2.5%
Panel B: Accounting data for the 2009 fiscal year
TA (€m) 8.7 2.8 0.8 0.2 7.8*** 2.6*** EMP 54.2 27.0 7.7 3.0 46.5*** 24.0*** LEV 26.1% 26.3% 25.1% 9.3% 1.0% 17.0%*** LIQ 2.0 1.4 6.2 1.3 -4.2*** 0.1 INCOV 11.8 1.5 12.3 1.4 -0.6 0.1 CS 5.3% 6.0% -0.4% 5.3% 5.7%*** 0.7% ROA 3.7% 3.5% 0.1% 2.3% 3.6%*** 1.3%** SG -3.7% -6.6% 24.6% -3.3% -28.3%*** -3.3%**
Notes: *** significant at the 1%, ** significant at the 5%, * significant at the 10% level. TA: total assets in €m. EMP: number of employees. LEV: leverage proxy (total debt/total assets). LIQ: liquidity proxy (current assets/current liabilities). INCOV: bankruptcy risk proxy (interest expense/EBIT). CS: cash-flow proxy (cash-flow/ average of beginning- and ending-period book value of total assets). ROA: return on assets (EBIT/average of beginning- and ending-period book value of total assets). SG: growth proxy ((sales in current year/sales previous year) – 1).
Table 4: Abnormal Performance, matching by SIZE and ROA
Initial Year Final Year AP Mean AP Median p-value (t-test)
p-value (WSR test)
Panel A: operating performance is measure by ROA
2007 2008 0.5% 0.8% 0.48 0.18 2007 2009 0.6% 0.4% 0.49 0.22 2007 2010 1.2% 0.6% 0.25 0.23 2007 2011 0.3% 1.1% 0.78 0.23 2008 2009 0.1% 0.2% 0.91 0.78 2008 2010 0.7% 0.3% 0.47 0.38 2008 2011 -0.2% 0.4% 0.80 0.73
Panel B: operating performance is measure by ROS
2007 2008 2.3% 0.6% 0.45 0.40 2007 2009 2.0% 0.4% 0.49 0.79 2007 2010 6.4% 0.6% 0.37 0.44 2007 2011 7.9% 1.0% 0.24 0.41 2008 2009 -0.3% -0.1% 0.79 0.61 2008 2010 4.2% 0.3% 0.33 0.80 2008 2011 5.6% 0.9% 0.32 0.81
Panel C: operating performance is measure by growth in sales
2007 2008 2.0% 0.5% 0.46 0.44 2007 2009 0.1% -0.9% 0.99 0.47 2007 2010 1.1% -0.1% 0.72 0.64 2007 2011 3.2% 0.7% 0.36 0.65 2008 2009 -1.9% -2.7% 0.57 0.06* 2008 2010 -1.0% -1.1% 0.74 0.85 2008 2011 0.9% 0.7% 0.78 0.96
Table 5: Abnormal Performance, matching by Industry and ROA
Initial Year Final Year AP Mean AP Median p-value (t-test)
p-value (WSR test)
Panel A: operating performance is measure by ROA
2007 2008 0.5% 0.8% 0.45 0.14 2007 2009 0.8% 0.8% 0.31 0.17 2007 2010 1.5% 0.8% 0.13 0.12 2007 2011 0.9% 1.5% 0.36 0.17 2008 2009 0.3% 0.8% 0.69 0.48 2008 2010 1.0% 0.6% 0.30 0.20 2008 2011 0.3% 0.9% 0.73 0.37
Panel B: operating performance is measure by ROS
2007 2008 2.2% 0.5% 0.46 0.47 2007 2009 2.3% 0.2% 0.43 0.73 2007 2010 6.6% 0.6% 0.35 0.25 2007 2011 8.2% 1.3% 0.22 0.18 2008 2009 0.1% 0.2% 0.92 0.80 2008 2010 4.4% 0.7% 0.31 0.63 2008 2011 5.9% 1.1% 0.29 0.50
Panel C: operating performance is measure by growth in sales
2007 2008 1.6% 0.0% 0.54 0.61 2007 2009 1.1% -2.4% 0.76 0.54 2007 2010 1.0% 2.1% 0.72 0.76 2007 2011 3.9% 3.5% 0.26 0.54 2008 2009 -0.4% -2.1% 0.91 0.15 2008 2010 -0.6% -0.2% 0.83 0.75 2008 2011 2.1% 0.5% 0.52 0.65
Table 6: Abnormal Performance, one-to-one matching by Industry, assets and ROA
Initial Year Final Year AP Mean AP Median p-value (t-test)
p-value (WSR test)
Panel A: operating performance is measure by ROA
2007 2008 -0.3% -0.5% 0.71 0.49 2007 2009 0.2% 0.6% 0.84 0.42 2007 2010 3.0% 0.1% 0.09* 0.15 2007 2011 1.4% 0.6% 0.31 0.16 2008 2009 0.5% -0.1% 0.61 0.63 2008 2010 3.3% 1.6% 0.05* 0.14 2008 2011 1.7% 0.9% 0.19 0.29
Panel B: operating performance is measure by ROS
2007 2008 1.4% -0.3% 0.66 0.28 2007 2009 2.1% 0.1% 0.49 0.84 2007 2010 11.2% 0.2% 0.13 0.20 2007 2011 37.4% 1.4% 0.01** 0.15 2008 2009 0.7% 0.0% 0.62 0.94 2008 2010 9.8% 1.0% 0.04** 0.19 2008 2011 36.0% 0.6% 0.02** 0.11
Panel C: operating performance is measure by growth in sales
2007 2008 -13.3% 4.9% 0.34 0.33 2007 2009 14.6% -1.3% 0.02** 0.26 2007 2010 3.2% 2.6% 0.59 0.62 2007 2011 8.2% 0.1% 0.15 0.70 2008 2009 23.8% -1.0% 0.08* 0.73 2008 2010 13.1% 2.1% 0.24 0.85 2008 2011 19.8% 2.8% 0.12 0.83