Determinants of Household Debt
Levels
Trabalho Final na modalidade de Dissertação apresentado à Universidade Católica Portuguesa
para obtenção do grau de mestre em (Finanças)
por
Carlos Filipe Lopes Rodrigues
sob orientação deProf. Dr. Ricardo Cunha
Escola de Economia e Gestão, Universidade Católica Portuguesa Fevereiro 2014
Acknowledgments
Resumo
O objectivo desta tese centra-se na compreensão da importância da habitação como garantia para os empréstimos por este titulados, permitindo o acesso ao consumo de um agregado familiar, bem como uma análise aos factores que determinam os níveis de utilização dos vários tipos de dívida que as famílias podem incorrer para financiar a aquisição de activos. O crédito total das famílias está dividido em crédito com garantias (hipotecárias) e sem garantias hipotecárias (empréstimos pessoais, empréstimos de carro, descobertos, os saldos de cartão de crédito e outras dívidas). Com maior detalhe, o modelo desenvolvido tenta capturar em que forma as variáveis tais como idade, renda, tamanho, educação e tangibilidade influenciam o crédito à habitação e o crédito ao consumidor. Verificou-se que as variáveis implícitas no modelo variam de acordo com os diferentes tipos de crédito considerado.
Palavras-chave: endividamento dos agregados familiares, modelos de ciclo
Abstract
The aim of this thesis focuses on understanding the importance of housing as a provider of collateral for loans, enabling household consumption, as well as an analysis of the factors determining the proportion of the different types of debt in the financing of household assets. Household total debt is split into secured (mortgages) and unsecured debt (personal loans, car loans, overdrafts, credit card balances and other debt). In higher detail the developed model tries to capture in what way variables such as age, income, size, education, and tangibility influence housing and consumer debt. It is found that the determinants vary according to the different type of debt considered.
Keywords: household debt, life cycle models, housing, mortgage debt, consumer debt
Index
Acknowledgments ... iii Resumo ... v Abstract ... vi Index ... vii Index of Figures ... xIndex of Tables ... xii
Introdution ... 1
1. Data and main statistics ... 9
1.1 Household balance sheet ... 10
2. Household leverage... 18
2.1 Leverage model ... 21
2.1.1 House Leverage model ... 23
2.1.1.1 Estimation Results ... 25
2.1.2 Consumer Leverage model ... 30
2.1.2.1 Consumer leverage testing model... 34
2.1.2.2 Estimation Results ... 37
2.1.3 Total Leverage model ... 41
2.1.3.1 Estimation Results ... 43
3. Conclusion ... 48
References ... 52
Index of Figures
Fig. 1: Evolution of Average Dutch Household Portefolios ... iii
Fig. 2: Evolution of Average Dutch Household Assets ... 13
Fig. 3: Evolution of Household Liabilities ... vi
Index of Tables
Table 1: Household Balance Sheet Structure ... iii
Table 2: Household Balance Sheet ... 11
Table 3: Factors correlated with House Leverage ... vi
Table 4: Factors correlated with Consumer Leverage ... 38
Table 5: Factors correlated with Leverage ... 44
Table 6: Factors correlated with House Credit ... 59
Table 7: Factors correlated with Consumer Credit ... 60
Introduction
There is little literature and available information regarding the financial choices of households. Households are seen not as economic units in isolation but as economic units generators of wealth, holding assets and liabilities. Although there is not a structured system of accounts for households as it exists for companies, a balance sheet of the household can be created, in which are represented all sources of household assets and liabilities, as well as net wealth. Households consider various economic factors while making their borrowing decisions. To understand how households make those credit choices, one needs to identify the economic factors that influence household borrowing and in which way these affect the household’s decision. This thesis aims to study the household borrowing behavior as well as how housing enables household consumption by granting capacity for collateralization.
There is much heterogeneity in relation to the various types of debt that comprise a household balance sheet, depending on the maturity and degree of collateralization.
We show that besides using Leverage (measured as the ratio of total debt to total assets) in order to capture household debt choices, it is important as well to differentiate between secured debt (mortgages) and unsecured debt (personal loans, car loans overdrafts, credit card balances and other debt). On one hand we have House Leverage defined as the ratio between mortgages and total assets (secured debt) and on the other hand Consumer Leverage defined as the ratio between consumer credit and total assets (unsecured debt) in order to capture the way in which the various determinants affect different types of debt.
Analyzing the Dutch households during the period of 2004 to 2008 was observed that their leverage level has strongly increased, mainly by increasing debt levels to finance house purchases. Due to the highly leveraged position of Dutch households, any given fluctuation in asset prices would have a large impact on consumption and wealth levels. Housing is one of the main assets of a household portfolio, and although being an illiquid asset, allows the access to consumption benefits and financial returns. Since the purchase of a house is the largest asset bought by a household, this transaction is mainly achieved through borrowing. With the availability of credit to households, substantial welfare gains are achieved, as credit enables consumption possibilities that otherwise were not feasible. Dynan and Kohn (2007) assert that a wealth effect associated with an increase in house prices will increase borrowing and
consumption, and that an increase in house prices can lead to higher expenditures in relation to income, mainly due to the need for households to borrow larger amounts of money to make a purchase and to maintain the same housing services. They also found that an increase in house prices results in a different composition of the household’s investment portfolio and may lead to an increase in debt holding. However, Weller (2007) studied the debt growth in recent years using the Survey of Consumer Finances and found that the increase in debt was at first due to real estate investment and not on consumption spending.
The purchase of durable goods such as a house was made possible for households by the access to credit loans which take the house as collateral. Having a leveraged position, households incur into risks that can come from the variation on the market value of the asset, interest rate fluctuations or a drop in household income.
Household financial resources are scarce and normally in the early stages of life, households have no financial assets or income to support the consumption of the various assets needed, incurring in credit to ease the payment over the life cycle, being reimbursed on the basis of the household’s future income.
There are many published studies that address the theme of the household but always in the perspective of household portfolio choices or in the perspective of financial institutions regarding the granting of credit.
Alessie, Hochguertel and van Soest (2000) analyze the composition and portfolio diversification of the Dutch households regarding age, birth and education level. Chetty and Szeidl (2010) studied the change in the portfolio of households with housing investment. Some authors suggest that investment in real assets is a complex decision, in which an investor also acts as a consumer. Since in most cases the increase in consumption of housing can only be attained by investing in housing, this restriction will distort the investor's portfolio choices leading to an over-investment in housing (Brueckner, 1997). Flavin and Yamashita (2002) in their portfolio composition over the life cycle theory show that young households due to consumption demand for housing incur into highly leveraged positions. According to Ortalo-Magné and Rady (2001) and Lustig and van Nieuwerburg (2004) housing grants collateral that is used to facilitate borrowing, enabling household consumption. An increase in house prices may lead to an increase in consumption, not because of a wealth effect, but because it allows leverage constrained homeowners to smooth consumption over the life cycle. When a drop in house prices is observed, households are lean to keep owning, rather than to sell, because housing provides a positive financial return on average in the long run (Genesove and Myer, 1997).
Campbell and Cocco (2005) observed that rising house prices may stimulate consumption by increasing households’ perceived wealth, or by relaxing borrowing constraints.
On the other hand, consumer credit is often neglected in the analysis of the household financial balance sheet, but recent literature finds that it is intertwining with household leverage. Pelizzon and Weber (2005) compare houses to long-term bonds that are used to hedge housing and non-housing consumption. Maki (2000) found out that consumer credit grows with future positive income prospect and it only starts to fall when households are not too optimistic and realize that debt levels are too high. Households with high debt service burdens are more sensitive to decreases in their income, reflecting it in their consumption level. Also, an interest rate shock can lead to larger repayments. Normally, the total amount required for the payments on consumer debt are higher than those of mortgage debt mainly due to the shorter maturities on the consumer debt.
Many studies have focused on the household portfolio composition through a cross-country analysis, noting that only a fraction of all available assets (financial and non-financial), are held by households. Some of the determinants pointed out for the absence of household portfolio diversification relating to short selling constraints (King and Leap 1998), tax rules (Porteba 1999) and transaction costs (King and Leap 1987).
Regarding credit lending, there is a wide range of literature, covering all perspectives on the point of view of the credit decision-making and credit scoring of individuals by financial institutions, but little or nothing portrays the choices and decisions in the perspective of households.
The aim of this thesis is to understand the determinants of the different types of debt from the household point of view. Household total debt can be divided into secured (mortgaged debt) and unsecured debt (personal loans, car loans overdrafts, credit card balances and other debt), but bearing in mind that
the determinants vary according to the different types of debt considered1.
Characteristics of households such as family size, age, level of education, income, influence the amount of debt incurred by households, whether guaranteed or not guaranteed, though their effects may not be the same for each debt type.
A simple, but very important question is: Why do consumers borrow? The reason consumers borrow relates to the need of smoothing their consumption and investment over the life cycle. Nearly all consumer theory is based on the life cycle assumption (e.g., Ando & Modigliani 1963, Friedman 1957), which considers how consumers allocate their time, money and effort in terms of borrowing, savings and consumption and how they make their life cycle choices.
1The difference between secured and non-secured debt arises from the fact that mortgages are considered securitized (as real estate serves as collateral), while other forms of debt, which range from bank loans and car loans to credit cards, are not securitized.
From the consumer's current income, a life cycle model predicts that people consume their life time income smoothly, either through access to credit, based on expected future income in the early stages of the life cycle, or through consumption of savings in retirement which are, accumulated during their working lives. According to Ando & Modigliani’s (1963) life cycle model, consumers maximize lifetime utility, by evening out their household income stream through borrowing to finance consumption in periods where actual income is lower than expected future income or through saving.
In recent times, consumer credit has been playing an increasingly decisive role in household financial planning. In a scenario where the household’s permanent level of income decreases and the assets are either not available or inaccessible for usage, households, in order to maintain the same level of consumption, incur in credit taking as an important vehicle that enables them to maintain the level of consumption that is consistent with permanent income.
This study focuses on the factors determining the different types of debt, and in particular on the role of housing as a provider of collateral for debt. Thus, a model was developed in order to check on how the determinants such as income, education, urbanization, age, tangibility and size, affect each type of debt held by households, considering that they can have different effects on the
level of secured (mortgages) and unsecured debt (personal loans, car loans overdrafts, credit card balances and other debt).
The outline of this thesis is as follows. Chapter 1 starts with a description of the data and methodology. In chapter 2 are presented the econometric models, where housing and consumer leverage determinants are identified, tested, as well as the discussion of the results obtained and their implications. A brief conclusion is conducted in chapter 3.
Chapter 1
1. Data and main statistics
For this study we used a dataset collected through an Internet survey, the DNB Household Survey. This survey is conducted by CentERdata, a department of The Center Research at Tilburg University. This dataset has been collected since 1993 from a panel of around 2.000 households in the Netherlands, members of the CentERpanel, which are a representative of the Netherlands population.
The information obtained in this survey is broad and comprises housing, mortgages, assets, debt, health, income, work, and pensions, economic behavior and psychological aspects of the Dutch Household.
The data used in our study reflects a period between 1992 and 2008 focusing on the economic and demographic variables such as income, debt, assets, age, degree of education and mortgages.
1.1
Household Balance Sheet
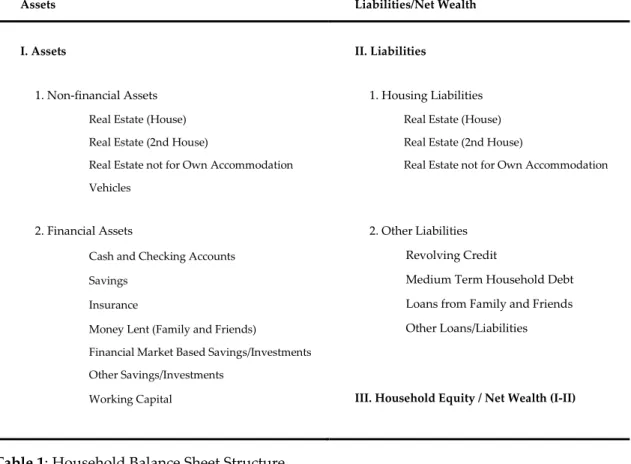
The Household Financial Balance Sheet data used is derived from de DNB Household Survey, which provides a fully integrated balance sheet of the Dutch Households. Table 1 exemplifies the structure of the household balance sheet. Table 2 presents the stocks of assets and liabilities of households in our sample for the years 2004 to 2008.
Assets Liabilities/Net Wealth
I. Assets II. Liabilities
1. Non-financial Assets 1. Housing Liabilities
Real Estate (House) Real Estate (House) Real Estate (2nd House) Real Estate (2nd House)
Real Estate not for Own Accommodation Real Estate not for Own Accommodation Vehicles
2. Financial Assets 2. Other Liabilities
Cash and Checking Accounts Revolving Credit
Savings Medium Term Household Debt
Insurance Loans from Family and Friends
Money Lent (Family and Friends) Other Loans/Liabilities
Financial Market Based Savings/Investments Other Savings/Investments
Working Capital III. Household Equity / Net Wealth (I-II)
Household assets can be characterized as financial or non-financial assets. Financial assets include cash, checking accounts, savings, equity and insurance. Non-Financial Assets are mainly housing assets and vehicles. Table 1: Household Balance Sheet Structure
Household Liabilities comprise mortgage loans (housing liabilities) and personal loans (other liabilities).
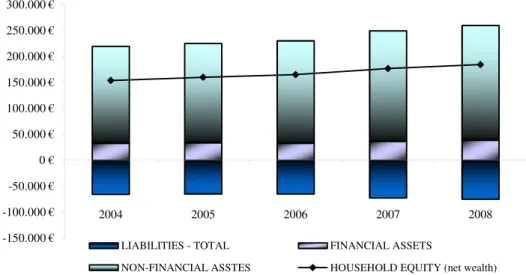
In recent years, it is observed that increases in household financial and non-financial assets are accompanied by a strong growth in household debt (Figure 1). This increase in debt should be seen and placed into context given the fact that the household asset base increased more and offsets the higher debt levels. In the five years of the sample, Households Equity (net wealth) has grown by an average of 4 per cent annually.
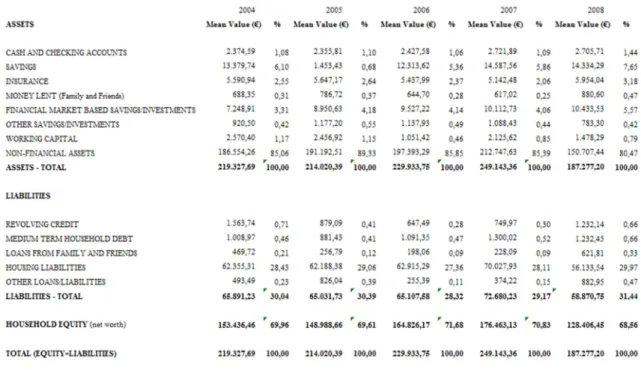
Table 2: Household Balance Sheet
The table presents the average values of all household observations in euros, and the average percentage of the different types of assets, liabilities and net worth to total assets for the period between 2004 and 2008.
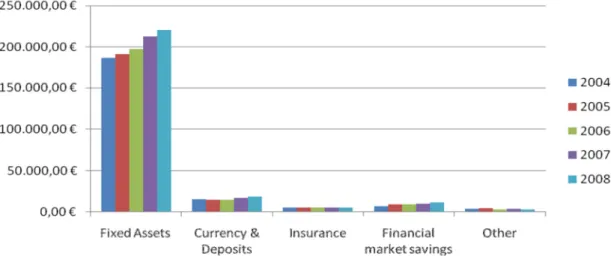
By analyzing the evolution of household assets in the last five years, we observe a positive trend of financial and non-financial assets, in which the house represents about 85 percent of total assets held by households, while bank deposits account for 7 percent. The value of both lines represents about 92 percent of the total assets of the household, having been shown a growth in recent years at an average of 4.5 percent. Insurance, Financial Market based Savings and Other Assets (money lent to family and friends, working capital and other investments) comprise a small portion of total assets, representing in aggregate about 7 percent of the assets held by households. These assets provide collateral to the liabilities incurred by households, representing on average 29 percent of total household assets.
-150.000 € -100.000 € -50.000 € 0 € 50.000 € 100.000 € 150.000 € 200.000 € 250.000 € 300.000 € 2004 2005 2006 2007 2008
LIABILITIES - TOTAL FINANCIAL ASSETS
NON-FINANCIAL ASSTES HOUSEHOLD EQUITY (net wealth)
Figure 1: Evolution of Average Dutch Household Portfolios Source: DNB Household Survey and author’s calculations Note: values in Euros
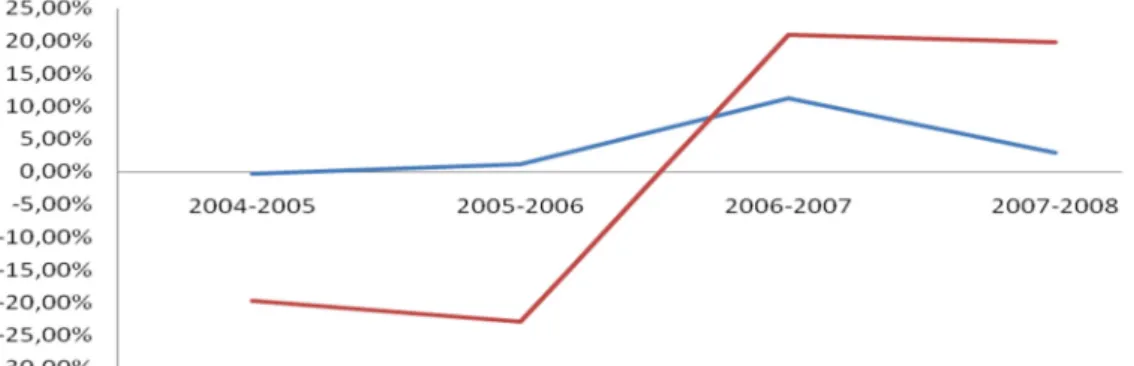
In what concerns Household Liabilities, generally these grew at a slower pace than Household Assets. During the period under review it was found that the growth in liabilities was due to the rapid growth of consumer credit in recent years, accompanied by the decrease in mortgage loans, reflecting household’s cautious expectations in incurring additional liabilities in a scenario of economic downturn. While personal loans accounted for an average of 5% of the total household liabilities during 2004-2008, its growth had strengthened from -19% in 2004 to 20% in 2008. The rapid growth in consumer credit relative to secured lending in recent years may in part be a result of higher credit constraints regarding housing liabilities. In addition, a significant proportion of the growth in consumer credit has come from credit cards. Surveys suggest that consumers are increasingly using credit cards for everyday transactions, and not just for purchases of durables.
Figure 2: Evolution of Average Dutch Household Assets Source: DNB Household Survey and author’s calculations Note: values in nominal terms
The balance sheet of the household is divided into three parts, assets, liabilities and net wealth, where net wealth (household equity) refers to the difference between assets and liabilities of the household for a certain period in time, revealing the wealth generated or spent by a family.
Regarding the 2008 average household balance sheet, we observe that a Dutch household presented an average amount of total assets of 259,537 Euros, as well as, in terms of total liabilities an average amount of 75,296 Euros, which lead in terms of net worth to an average amount of 184,240 Euros. By analysis of the values obtained, we found that on average the level of leverage of the household had a value of 29 percent, meaning that one third of household assets are financed by debt, constituting the remaining two thirds of assets net wealth (internal financing). In the household balance sheet, total assets are divided into financial (savings, bank deposits, assets, financial markets) and non-financial (real estate) assets, and that the non-financial assets alone have a
Figure 3: Evolution of Household Liabilities
Source: DNB Household Survey and author’s calculations Note: values in percentage in relation to Total Liabilities
weight of 85 per cent in total assets. In terms of financial assets, Dutch households seem to prefer savings accounts and financial market based savings, each representing a weight of 6 and 4 percent respectively in terms of total assets. Moreover, since real estate assets are the largest assets in the household balance sheet, the same is true on the liabilities side, where mortgages represent 96 per cent of the total liabilities.
However, when we use the database on the assumption of the life cycle we have a perspective on how households behave. As can be expected based on the theory of the life cycle, households incur into higher liabilities in their early stages in life in the form of mortgages, which are abated with age, whereas in terms of wealth there is an accumulation of savings and other financial assets until retirement age, period when households begin to consume wealth accumulated.
Figure 4: The distribution of wealth and liabilities through the life cycle Source: DNB Household Survey and author’s calculations
From the observed data we find that a household in the early stages of life presents an average weight in terms of leverage (total liabilities over total assets) amounting to 57%, beginning to rapidly decrease and reach a weight of only 30 percent in the range of 45-55 years, rising to almost a residual value of only 10 percent when they attain the full retirement (+65), which is in agreement with the theory of life cycle, since it is expected full payment of all debts in the last stage of the life cycle. On the other hand, we observed the opposite movement with respect to net wealth. In the early stages of life, households do not have enough wealth that allows them to make significant investment in assets such as purchasing a house and, it is expected that the accumulation of wealth increases as the household evolves over the life cycle stages. On average, Dutch households, in our sample initially have a net wealth with a weight of 43% in total assets, which increases over the life cycle stages, reaching a value of 90% when they reach the full retirement.
Another factor to note is that, as seen earlier, the degree of leverage will diminish over the life cycle, although the level of household debt reaches its peak in the age range of 45-55 years, a fact which will not result in increased leverage, since, in this age group is also where the household reaches its maximum level of income, thus diluting the effect of growth on the liabilities side.
If on the other hand, we analyze from the perspective of the household level of education, is expected that as the level of education increases the level of household credit, also increases as well as can be expected to increase the level of wealth. In the sample we find that for a household with a low level of education the burden of liability on assets is on average 18 percent with an average amount of € 18,421 and the net wealth represents an average weight of 92 percent with an amount of € 159,791. Whereas, analyzing by the side of a household with a university education level we see an increased level of debt, as well as net wealth generated, with a weight in total assets of 25 percent and 75 percent respectively for an amount of € 69,636 and € 265,504 in liabilities and net wealth.
Chapter 2
2. Household Leverage
Housing is a major investment for households and normally the most important asset of a household portfolio. Housing Leverage debt grants consumption and financial gains to households, allowing them to acquire a long term asset that without leverage households will not be able to acquire. Many are the factors that we expect to influence housing leverage like income inflows, the position of a household in the life cycle, the household’s wealth and the level of education.
The position of households in the life cycle influences the level of leverage. It is expected that younger families do not have sufficient savings to purchase durable goods such as a house, since they have only been in the labor market for a relatively short time, thus being more focused on their careers and to complete or improve their academic qualifications. As younger families do not have enough wealth and because each individual has a time horizon limited by nature it is expected that a large portion of its investments, including the
purchase of house, be performed at early stages of life leading young households to incur in high levels of leverage. As households progress through the life cycle, it is expected that their level of leverage decreases, on one hand by the increase in income and on the other hand by the decrease in the amount borrowed reflecting the repayments over time, until retirement stage is reached in which it is expected that the loan is fully liquidated. Age can hence be used as a proxy to reflect the stage of a household in the life cycle. Yilmazer and DeVaney (2005) find that age affects negatively household debt as the age of the head of the household increases.
Besides the position in the life cycle another factor influencing the level of leverage is income, since it is expected that households with higher income are more prone to own a house, as they can more easily cope with the necessary down-payment. Hence, it will also be expected that the household leverage is higher the greater is the household income since high-income households have laxer lending criteria by the financial institutions thus being estimated a positive correlation of income with leverage. High-income families are more likely to pay off their loans more quickly and thus become owners of the house. Assuming no credit constraints and an upward sloping income profile, you would expect individuals in early adulthood to have negative net asset holdings, as they borrow from their higher future incomes to fund increased consumption today. As individuals incomes rise over their lifetimes, they
should begin to save money, both to pay back their earlier debt and also in order to fund consumption in their retirement, and finally in retirement individuals should not save from their stock of assets, as they have very little or no income, and will want to maintain their previous consumption levels. According to Duca and Rosenthal (1993) debt limits increase with household income and wealth, but are relaxed for families with a good credit history, and households with higher income have an increased demand for debt given their elevated demand for consumer durables like housing. On the other hand Jappelli (1990) found significant evidence that higher income and more wealthy households were less likely to be credit constrained.
Another factor that can contribute to the level of leverage that a household incurs is related with their attitude towards home ownership and housing debt. It is expected that households with an aversion to credit to build up more savings before buying a home than households with higher propensity towards debt. Another factor to take into account is the ability to provide collateral of assets that households have, because the more goods and greater their value the greater their ability to be financed through debt. Households with more tangible assets usually have higher settlement values, so the higher the tangibility of assets the greater its ability to afford financial leverage, being expected a positive relation between leverage and asset tangibility. Cunha, Lambrecht and Pawlina (2006) observed that the level of leverage increases as
collateral potential increases, as households with higher fixed assets tend to have higher total asset values, and are expected to have higher levels of debt.
The leverage of a household may also be determined by other factors such as education level, number of children, family size and location of the house. The level of education of the individual can play an important factor in determining the degree of leverage as, it is expected that the higher the education the more likely to have higher incomes, higher financial proficiency, more job security and higher future income, allowing households the possibility of incurring in higher levels of debt, being expected a positive relationship with leverage.
Another determinant of leverage is the location of the house and it is expected to be higher in non-urban areas than in urbanized areas. This variable may function as a proxy for variation in house prices in relation to its location, which in turn may influence the level of household leverage, being expected that households to be pruner to buy a house in a lesser urbanized area, therefore incurring into higher levels of leverage.
2.1
Leverage Model
As previously noted it is not very common for households to be able to buy a house only through their own funds and savings. Usually most households rely on strategies such as bank financing in the form of mortgages
enabling them to purchase. These loans obey to certain rules under which there are established deadlines, fees, rates and the ability of households to carry out restructuring or refinancing. The level of leverage incurred by households will be changing over time, as it is determined by the initial amount, deadline, and its ability for repayment.
As identified above there are some variables that influence and determine the level of leverage of households and to test their significance the following econometric model was developed:
2
1 2 3 4 5
6 7 8
i i i i i i i
i i i i
Leverage Size Age Age Income Tangibility Education Children Urbanization
α
β
β
β
β
β
β
β
β
ε
= + + + + + +
+ + +
We consider three definitions of leverage, depending on the type of credit conceded, consumer credit, mortgaged debt and total debt. Leverage can hence assume: • Mortages HouseLeverage TotalAssets = • ConsumerCredit ConsumerLeverage TotalAssets = TotalDebt TotalLeverage TotalAssets =
2.1.1
House Leverage Model
To test the relationship between the level of household housing leverage and eight explanatory variables representing Age, Age², Tangibility, Size, Income, Education, Children and Urbanization we use regression analysis. These are the core variables of the model that include several control variables that indicate the household composition (number of children), characteristics of the household head (education) and the economic situation of the household.
2
1 2 3 4 5
6 7 8
i i i i i i i
i i i i
HouseLeverage Size Age Age Income Tangibility Education Children Urbanization
α
β
β
β
β
β
β
β
β
ε
= + + + + + +
+ + +
The dependent variable House Leverage can be defined as the ratio of household housing liabilities in total assets. The only households with positive values of leverage are those whose housing was acquired through credit. Thus, by definition leverage can only assume zero or positive values and so its distribution censored at zero.
The Income variable can be defined as the net income received by all members belonging to the household, and is considered an important tool to capture the ability of households to generate funds. Households with higher incomes can more easily access financing for the purchase of housing, but on
the other hand we can also observe that higher income enables household capacity for the repayment of the purchase of the house.
Education is a variable that takes the value 1 when we are in the presence of a household member with a university education or senior vocational education. Education is correlated with income stability, since it will be expected to be greater the higher their level of education. Banking institutions in their analysis and evaluation of credit to households include the level of education as an element of creditworthiness. Thus the level of education is a personal characteristic that allows access to credit and the debtor is characterized as a low risk investment the higher his education qualifications are.
Age and Age² are continuous variables that are introduced to capture household’s variations in behavior and to reflect the stage of a household in the life cycle. Age is defined as the age of the eldest member of the household. In order to capture the effect of family size was introduced the variable Children that can be characterized as the number of children in a household. This enables the understanding in what way housing leverage is defined by dimension of a household. The number of children that make up a household are a factor to take into account since they are a heavy financial burden that households have to bear and thus influence the levels of credit incurred by the household.
Size is measured by the logarithm of total assets and is an important variable that allows capturing the probability of households to default and is a proxy for total collateral. Thus, the higher the wealth of the household, the greater its ability to incur into credit loans, enabling households to issue debt at lower costs than households with less wealth, and therefore leading to a lower probability to file for personal bankruptcy.
Tangibility is an important driver of leverage and is measured as the ratio of fixed assets to total assets, being expected a positive relation with leverage. As in the theory of capital structure, the tangibility of assets is an important factor in determining the level of leverage of households. It is expected that the higher the value of assets greater the degree of leverage, since households with more assets will have greater access to credit due to their capability of collateralization.
Urbanization is a Dummy variable that assumes the value of 1 if the household lives in an area of low degree of urbanization. The introduction of this variable is intended to measure the sensibility of leverage to the house price in relation to its localization.
2.1.1.1 Estimation Results
The determinants of House Leverage were estimated using a Tobit model with the dependent variable, house leverage, censored at zero. The explanatory
variables used in the model consisted of Age, Age², Tangibility, Size, Income, Education, Children and Urbanization. Table 3 shows all sample results of the model for household House Leverage, and nearly all the coefficients have the expected signs and are statistically significant.
Model 1 Model 2 Model 3
Variable Sig. Sig. Sig.
Constant 2,1762 (0,085) 0,00% 2,1326 (0,085) 0,00% 2,1123 (0,085) 0,00% Size -0,0809 (0,006) 0,00% -0,0787 (0,006) 0,00% -0,0757 (0,006) 0,00% Age -0,0238 (0,002) 0,00% -0,0225 (0,002) 0,00% -0,0222 (0,002) 0,00% Age² 0,0001 (0,000) 0,00% 0,0001 (0,000) 0,00% 0,0001 (0,000) 0,00% Income 0,0018 (0,000) 0,00% 0,0018 (0,000) 0,00% 0,0018 (0,000) 0,00% Tangibility 0,0713 (0,023) 0,17% 0,0816 (0,023) 0,04% 0,091 (0,023) 0,01% Education 0,0104 (0,006) 5,86% 0,008 (0,006) 14,79% 0,0064 (0,006) 24,56% Children -0,0119 (0,002) 0,00% -0,0095 (0,002) 0,01% Urbanization -0,0538 (0,005) 0,00% R² 0,261 0,263 0,271
Table 3: Factors Correlated with House Leverage
The dependent variable is Housing Leverage can be defined as the ratio of household housing liabilities in total assets. Size is the logarithm of total assets. Age and Age² are continuous variables, where Age is defined as the age of the eldest member of the household. Income is the net income received by all members belonging to the household. Tangibility is the ratio of fixed assets to total assets. Education is a dummy variable of value 1 when we are in the presence of a household member with a university education or senior vocational. Children is the number of children in a household. Urbanization is a dummy variable that assumes the value of 1 if the household lives in an area of low degree of urbanization. Regression is estimated using maximum likelihood, and a censored regression model. Outputs reported are estimated coefficients, standard errors of coefficients (in parenthesis) and significance level.
The Income variable has a positive correlation with leverage being statistically significant for the estimated model, noting that as income increases the greater the leverage of households. This is consistent with what one would expect since households with higher incomes can more easily get access to debt to finance the purchase of a house by its ability to generate funds, but it may also show that households have different levels of costs depending on their income. Thus, households with higher incomes have higher consumption standards and are linked to greater access to credit will positively influence the levels of leverage. Bertaut & Starr-McCluer (2000) found a positive relation between income and debt, noting that as income increases the probability of owning a house also rises. A similar result was observed by King & Leape (1998), which found a positive relation of income with mortgages. Regarding the effect of income on the probability of debt, Cox & Jappelli (1993) obtained a positive sign but slightly significant.
Regarding the stage of the household in the life cycle, an important key variable introduced to gauge the level of leverage is Age. The signal obtained for this variable is negative and statistically significant, thus corroborating the theory of life cycle in which households have higher levels of leverage in the early stages of the life cycle decreasing as age increases. This may be explained by the fact that older households had more time for accumulating wealth and as well as for debt down payment. A similar result regarding age was obtained by
Cunha, Lambretch & Pawlina (2006) confirming of the existence of a process of wealth accumulation and debt repayment along the life cycle.
To control the capability for a household to collateralize their debts the variable Size was introduced in the model. Financial and non-financial assets have a negative and significant effect on the likelihood of holding a mortgage debt. Cunha, Lambretch & Pawlina (2006) attribute this negative relation not only to changes in the Dutch Tax System since only mortgage interests can be tax deductible, but also because the banking sector adopted a more conservative stance in granting credit to households, restricting credit lending to poorer households with less financial capacity, thus leading to a reduction of credit lending and therefore a decrease in leverage. The tangibility as expected reflects the effect of increasing leverage as collateral increases. This variable presents a positive sign and is statistically significant in explaining housing leverage. Flavin & Yamashita (2002) found that young households with large holdings of real estate relative to their net worth are highly leveraged and therefore forced into a situation of high portfolio risk (and return).
According to the hypothesis of the life cycle the level of education of the household is an important factor determining housing leverage, because households with higher levels of education usually have steeper yield curves and therefore are going to borrow more at younger ages. Although the variable Education presents the expected positive sign regarding leverage, it does not
pose any statistical significance. King & Leap (1998) according to their model, education is a significant variable only for mortgages, being a result of banks attributing greater importance to education as a proxy of the household income profile. Magri (2002) study showed that the level of education positively effects on the probability of debt.
The results confirm that Tangibility and income positively influence the performance of housing leverage by households and in addition other variables such as size, age, education and children have negatively affect. The regression model studied showed statistical power.
In order to capture the effect of family size was introduced the variable Children that presents a negative and statistically significant sign, being an important explanatory factor in determining the leverage housing. The size of the family influences the level of leverage of a household as expected, because as households enlarge, families may have to incur into higher levels of leverage in order to maintain their consumption levels. Duca & Rosenthal (1993) and Crook (2001) acknowledge household size and number of children as being a factor influencing the debt, noting that demand for debt increases as the household size increases.
Also included was a dummy variable on the degree of Urbanization, assuming the value of 1 if the household lives in an area of low urbanization, in order to capture the different preferences for leverage whether the household
lives in an area of greater or lesser urbanization and to capture the changes in house prices according to the degree of urbanization, which influence housing leverage choice by households. Urbanization presents a negative sign in accordance with what one would expect, being a statistically significant variable in explaining housing leverage, confirming that housing leverage decreases as the level of urbanization increases, being interpreted as the propensity of households to buy a house in lesser urbanized areas where prices are lower and houses are more affordable. Magri (2002) study shows that house location is an important coefficient determining the size of household debt, due to differential enforcement costs distribution a cross country.
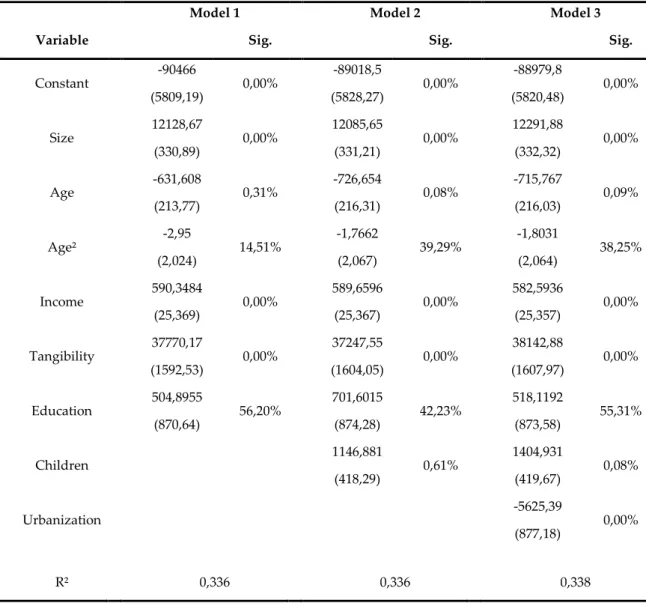
The robustness of the analysis is tested using the same model with dependent variable House Credit. Results can be seen in Appendix 1.
2.1.2
Consumer Leverage
Households consider various economic factors in their decision-making regarding borrowing decisions, and to better understand the variations in consumer credit, you must identify the factors that influence consumer borrowing and understand how they influence the decision-making by households. The allocation of different resources available for various types of consumption, as well as the creation of a well-structured household balance
sheet, are the key decisions that households have to make, considering as households resources the existing wealth, current income and future income.
One factor to consider, relates to the fact that the decision of contracting a loan may vary depending on the position of the household in the life cycle. Assuming that households have permanent income, they maximize their utility over lifetime through borrowing, creating patterns of consumption that allows them to settle smoothly over time. Since that the majority of the households in the early stages of the life cycle have little wealth accumulated and low income versus future income, they are more likely to finance current consumption with future income. As well as housing leverage, consumer credit depends on several other household characteristics like age, family size, income, number of children, and level of education. Regarding age consumer debt is more common for people in there thirties, forties and fifties, and is very low for the oldest age group. It’s expected that income grows along the life cycle leading households to incur in higher levels of credit while still young and falling as they become older. With the reduction of uncertainty regarding future income, households will tend to increase consumption by reducing the need to have saving reserves, and with higher future income it’s expected an increase of the propensity to consume, and thereby increase the access to credit. Using the Federal Reserve Board’s Survey of Consumer Finances, Bertaut & Haliassos (2005) found that younger households were likelier to have an outstanding
credit card balance than older households and that households with low-income were less likely to carry a credit card balance than higher low-income households.
Another factor that will influence the level of consumer debt is related to the level of household income, being expected that it relate positively with consumer leverage, since consumers will incur on more credit, the higher the expectations regarding future income. Middle-class individuals who do not have high current income, on average borrow to finance current consumption based on future expected stable income. The middle-class individuals who do not have high current yields, on average borrow to finance current consumption based on expected stable future income, while on the other hand, individuals with low incomes and precarious employment may be afraid to borrow or not being able to do so, while individuals with high incomes often have little need to borrow. Bertaut and Starr-McCluer (2000) found that income has a negative effect in terms of consumer debt.
Another factor that might influence the level of consumption and use of credit is related with demographic changes and levels of education, which can lead to significant increases in debt. An increase in the average academic qualifications leads to the enhancing of household debt, mainly because it is expected that income will increase significantly over the life cycle, and is therefore expected that younger households to borrow more than older
households. Household characteristics like education, number of children, race or marital status, according to Yilmazer & DeVaney (2005) study have a negative effect on household’s consumer debt.
The choices of consumption by households take into account various factors such as interest rates, expectations regarding the evolution of future income, as well as portfolio allocation, determined according to market rates of return, risk preferences and tax issues.
Rising house prices allowed the ability for homeowners to carry out with mortgage refinancing, leveraging their consumption needs, by the release of capital. This allowed consumers to spend at a rate equal to its income neglecting savings and increasing borrowing. If a positive change in pricing it’s observed, leverage may be a useful way to increase the cash flow of households taking the increase in asset value, instead of just relying on income from their work.
There are studies that refer that one of the reasons for poor economic growth may be related to an over-indebtedness of households, which means that households have used a large portion of future income, and as such, be less willing to consume. In this scenario, households would be more inclined to repay debt faster in an effort to smooth consumption.
2.1.2.1 Consumer Leverage Testing Model
The life cycle permanent income hypothesis is the main theory for understanding consumption and savings behavior. According to this hypothesis, consumers use borrowing to smooth consumption during the life cycle in order to maximize lifetime utility, borrowing to finance consumption in periods where actual income is lower than expected future income, very common in the early stages of the life cycle (Ando & Modigliani, 1963; Modigliani 1966; Friedman 1957). Consumer debt can be seen as a source of liquidity and consumption smoothing for households that lack adequate income and assets. Many are the factors that influence consumption borrowing by households including the future expected return as well with demographic factors (age, education, children, and family size) and life cycle stage.
The regression presented aims at examining the factors that can explain household Consumer Leverage. The effect of Size, Age, Age², Income, Tangibility, Education, Children and Urbanization on household consumption can only be determined through the estimation of a model where these variables are included. The objective of this analysis is to measure the impact of some social-demographic factors on household consumption debt, so the following econometric model was developed:
As consumers have different decision regarding borrowing, demographic aspects of households assume an important role in explaining consumer leverage. The variable Age was introduced to capture the position of the household in the life cycle and according to the permanent income hypothesis, consumers try to maximize their consumption utility through the access to credit in order to create a consumption pattern smoother than income. It’s then expected that households in their early stages of the life cycle to finance current consumption through future income, explained by low incomes and wealth accumulation. Studies conducted by Chan (1997), Crook et al. (1992) and Amine (1989) show that young and better-educated individuals are more likely to hold consumer debt. Bertaut and Starr-McCluer (2000) found that the probability of having consumer debt drops off considerably in the older age ranges, while in the younger age ranges the usage of consumer credit is not higher as would be expected from a life cycle perspective.
Another determinant regarding consumer leverage that was introduced in the model was household Income, being expected a positive relation with consumer leverage, since that the higher the expectations regarding future income the more likely consumers tend to incur on credit. Through the
2
1 2 3 4 5
6 7 8
i i i i i i i
i i i i
ConsumerLeverage Size Age Age Income Tangibility
Education Children Urbanization
α β β β β β
β β β ε
= + + + + + +
of positive future income growth households tend to increase consumption and to reduce their savings level. Fan, et al. (1993) also noted that households with higher expected future income are more likely to increase consumption than households with lower expected future income, leading them to conclude that future income growth must be linked directly to borrowing.
Some of the income related variables like Size, Tangibility and Education, can have an additional effect in consumer credit through their impact in the credit premium when associated with the risk of default. Being Education correlated with income, is expected that higher the education the higher the household income will be. Households with more education tend to have steeper life cycle income paths and as a result tend to borrow more in the younger stages in life. Del-Rio and Young (2006) found that unsecured borrowing is influenced by households expectations concerning their future income, noting that the higher the level of households qualifications the greater the expectations regarding future earnings, leading to a raise in unsecured borrowing. On the other hand, Choi and DeVaney (1995), Zhu and Meeks (1994) established a positive relationship regarding education and consumer debt. Lee and Kwon (2002), Castronova and Hagstrom (2004), Steidle (1994) and Bei (1993) have found the reverse relationship to hold.
In order to capture the sensibility of consumer leverage regarding variations in house prices in order to capture the wealth effect the dummy
variable of Urbanization was introduced. Any given change in house prices and the grater the leverage of a household balance sheet, will have a large effect on household wealth. Increase in house prices can increase debt by boosting consumption.
2.1.2.2
Estimation Results
An econometric model was developed to test the determinants that influence the household’s level of consumer leverage. In order to properly understand the determinants of consumer leverage, a Tobit regression with the dependent variable censored at zero was developed in which, as with the previous model, eight variables are introduced, including Age, Age², Tangibility, Size, Income, Education, Children and Urbanization.
Model 1 Model 2 Model 3
Variable Sig. Sig. Sig.
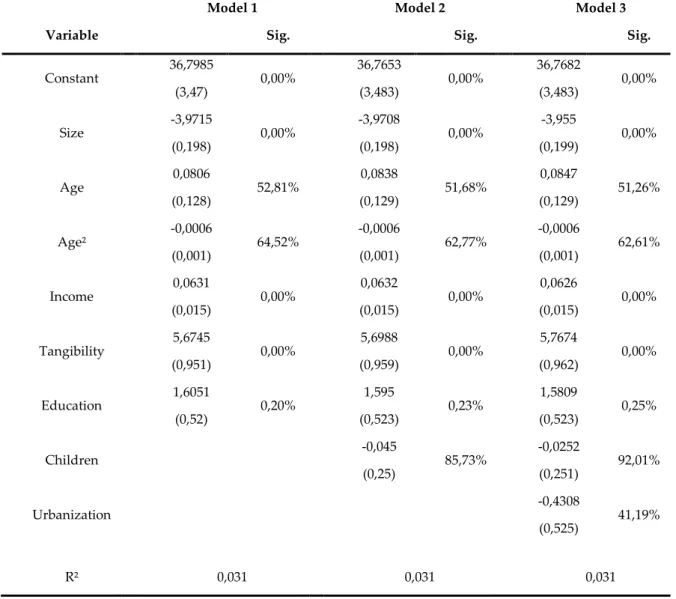
Constant 36,7985 (3,47) 0,00% 36,7653 (3,483) 0,00% 36,7682 (3,483) 0,00% Size -3,9715 (0,198) 0,00% -3,9708 (0,198) 0,00% -3,955 (0,199) 0,00% Age 0,0806 (0,128) 52,81% 0,0838 (0,129) 51,68% 0,0847 (0,129) 51,26% Age² -0,0006 (0,001) 64,52% -0,0006 (0,001) 62,77% -0,0006 (0,001) 62,61% Income 0,0631 (0,015) 0,00% 0,0632 (0,015) 0,00% 0,0626 (0,015) 0,00% Tangibility 5,6745 (0,951) 0,00% 5,6988 (0,959) 0,00% 5,7674 (0,962) 0,00% Education 1,6051 (0,52) 0,20% 1,595 (0,523) 0,23% 1,5809 (0,523) 0,25% Children -0,045 (0,25) 85,73% -0,0252 (0,251) 92,01% Urbanization -0,4308 (0,525) 41,19% R² 0,031 0,031 0,031
The Age variable was introduced in order to capture the position of the household in the life cycle, as well as to capture the existence of a tendency to smooth consumption over the life cycle. The results obtained regarding the age, although showing the positive sign as expected the values are not statistically Table 4: Factors Correlated with Consumer Leverage
The dependent variable is Consumer Leverage can be defined as the ratio of household consumer liabilities in total assets. Size is the logarithm of total assets. Age and Age² are continuous variables, where Age is defined as the age of the eldest member of the household. Income is the net income received by all members belonging to the household. Tangibility is the ratio of fixed assets to total assets. Education is a dummy variable of value 1 when we are in the presence of a household member with a university education or senior vocational. Children is the number of children in a household. Urbanization is a dummy variable that assumes the value of 1 if the household lives in an area of low degree of urbanization. Regression is estimated using maximum likelihood, and a censored regression model. Outputs reported are estimated coefficients, standard errors of coefficients (in parenthesis) and significance level.
significant. In the study conducted by Magri (2007) was found that young households with expectations of growing income have higher demand for debt, increasing with age reaching its peak around 30 years and then falling till retirement age. Moreover Bertaut & Starr-McCluer (2000) also noted that consumer debt decreased sharply in older individuals, whereas younger individuals did not presented the expected high levels of consumer debt.
One of the variables introduced in the model refers to household Income, showing a positive relationship with leverage in consumption, which is consistent with expectations and statistically significant. Income distribution affects the behavior of consumer debt. We found that households that have expectations about having a stable income in the future tend to incur into borrowing to finance current consumption. The results obtained by Del Rio & Young (2006) show that income is the main variable in explaining consumer credit, as income differences lead to different propensities to use consumer credit, confirming a strong positive relationship between the amount of unsecured debt and income.
The introduction of the variable Education allowed us to observe that the level of consumer leverage varies positively with the increasing level of education, as expected, because the higher the education level of household the more likely to have higher incomes. According to the study conducted by Del Rio & Young (2006) the level of educational qualification is an important factor
in determining the level of household debt, concluding that the higher the level of educational qualifications of individuals the greater the likelihood of debt in relation to individuals with lower educational qualifications. Also Magri (2007) identified education as an important factor that determines the likelihood of demanding a loan and its size, reflecting permanent income.
With regard to the variable Size, there is a negative but statistically significant relation with consumer leverage, which allows us to understand how the degree of collateralization influences consumer loans. This result may be explained by the fact that banks have tightened their criteria for lending, adopting a more conservative position regarding borrowing, restricting access to households with low incomes and little ability to provide collateral, thus leading to a reduction in the level of consumer leverage. Another explanation arises from the fact that household with larger asset holdings tend to incur less into consumer debt than households with little assets holdings mainly due to their grater need to finance current consumption. Banks et al. (2002) using the British Household Panel Study found that households with larger asset holdings have a lower propensity to be in debt and those with sizable assets are less likely to hold any assets. On the other hand Del Rio & Young (2006) observed empirically that those with financial assets have lower amounts of unsecured debt.
Another measure that enables us to gauge the ability of households to provide collateral is through the Tangibility variable, reflecting the effect of increasing leverage with increasing collateral, presenting the expected sign and being statistically significant. The higher the value of assets greater the degree of leverage, since households with more assets will have greater access to credit due to their capability of collateralization.
The robustness of our analysis is also tested using the same model with dependent variable Consumer Credit. Results can be seen in Appendix 2.
2.1.3 Total Leverage Model
As presented and studied previously regarding debt determinants that influence consumption and home purchase, a similar model was designed in order to study in what way the same variables influence the ratio of total debts on total assets (Total Leverage). The model developed includes eight explanatory variables Age, Age², Tangibility, Size, Income, Education, Children and Urbanization: 2 1 2 3 4 5 6 7 8 i i i i i i i i i i i
TotalLeverage Size Age Age Income Tangibility Education Children Urbanization
α
β
β
β
β
β
β
β
β
ε
= + + + + + +
+ + +
The ability of collateralization by households is an important factor in explaining the level of leverage, having been introduced in the model the
greater its ability to collateralization thus allowing the possibility of incurring debts, which allow households anticipate future consumption. Besides the size variable, another variable that allows us to assimilate the effects of collateralization level of leverage was achieved with the introduction of Tangibility.
With the introduction of Education into the model, we intend to observe in what extent the level of the household education affects leverage. Education is one of the factors that banks taken into account when assessing household credit risk, since households with higher education levels have access to a higher income and thus have greater accessibility to credit as well as more capability to meet their financial obligations. To study the effect that family size has on the level of leverage of households the determinant Children was introduced, since it will be expected that the larger the household the greater your propensity for incurring credit enabling households to maintain their consumption levels.
Another important variable introduced in our model and allows us to understand the stage in which households are in the life cycle and how it influences their debt choices is Age. It is expected that households that are in the early stages of the life cycle tend to finance current consumption based on future income.
The Income variable was introduced into the model in order to analyze their influence on the desired degree of leverage by households, as well as its ability to generate funds to enable it to finance access to consumption. It will be expected that households with higher incomes or expectations about future income may have easier access to credit, allowing consumption smoothing over the life cycle.
In order to understand in what way variations in house price depending on their location affect household leverage, the variable Urbanization was introduced allowing us to gauge the sensitivity of household location relative to incurred debt levels.
2.1.3.1 Estimation Results
As previously performed for house and consumer leverage an econometric model was developed for total leverage in order to observe in which way the same determinants affect household debt choice. The determinants of holding any type of debt were estimated using a Tobit regression with the dependent variable Total Leverage censored at zero, with the usage of eight explanatory variables consisting of Age, Age², Tangibility, Size, Income, Education, Children and Urbanization.
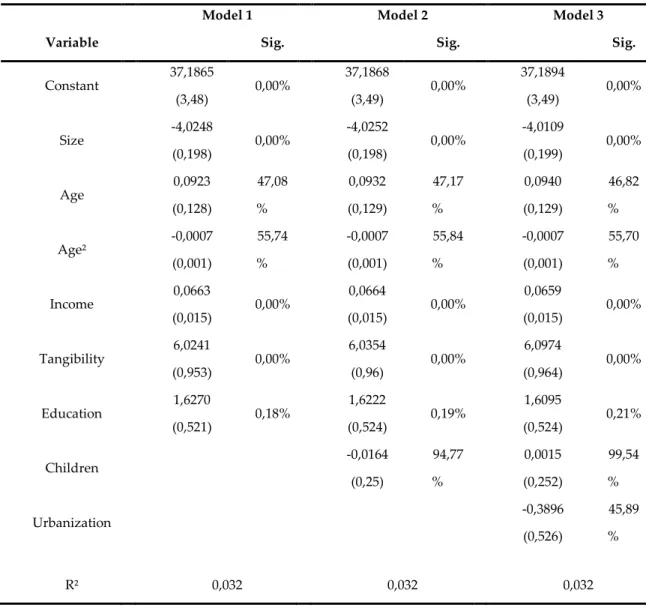
The variable Income is consistent with the expected positive sign and statistically significant indicating clearly that the level of leverage is directly related to the level of household income. This is in agreement with what would be expected, since the higher the household income greater the ease of access to credit, having household greater ability to generate funds as well as to provide
Model 1 Model 2 Model 3
Variable Sig. Sig. Sig.
Constant 37,1865 (3,48) 0,00% 37,1868 (3,49) 0,00% 37,1894 (3,49) 0,00% Size -4,0248 (0,198) 0,00% -4,0252 (0,198) 0,00% -4,0109 (0,199) 0,00% Age 0,0923 (0,128) 47,08 % 0,0932 (0,129) 47,17 % 0,0940 (0,129) 46,82 % Age² -0,0007 (0,001) 55,74 % -0,0007 (0,001) 55,84 % -0,0007 (0,001) 55,70 % Income 0,0663 (0,015) 0,00% 0,0664 (0,015) 0,00% 0,0659 (0,015) 0,00% Tangibility 6,0241 (0,953) 0,00% 6,0354 (0,96) 0,00% 6,0974 (0,964) 0,00% Education 1,6270 (0,521) 0,18% 1,6222 (0,524) 0,19% 1,6095 (0,524) 0,21% Children -0,0164 (0,25) 94,77 % 0,0015 (0,252) 99,54 % Urbanization -0,3896 (0,526) 45,89 % R² 0,032 0,032 0,032
Table 5: Factors Correlated with Leverage
The dependent variable is leverage and can be defined as the ratio of household liabilities in total assets. Size is the logarithm of total assets. Age and Age² are continuous variables, where Age is defined as the age of the eldest member of the household. Income is the net income received by all members belonging to the household. Tangibility is the ratio of fixed assets to total assets. Education is a dummy variable of value 1 when we are in the presence of a household member with a university education or senior vocational. Children is the number of children in a household. Urbanization is a dummy variable that assumes the value of 1 if the household lives in an area of low degree of urbanization. Regression is estimated using maximum likelihood, and a censored regression model. Outputs reported are estimated coefficients, standard errors of coefficients (in parenthesis) and significance level.
collateral. Magri (2002) also found that loan demand increases as household disposable income rises.
The Education variable has the expected sign and is statistically significant, indicating that the level of leverage increases with the level of education increases. The variable education is directly related to income since it is expected that the higher the level of education of the household the greater the expected returns. According to Fabbri and Padula (2004) households with better education are pruner to hold more debt, due to the fact that the better educated have a steeper income profile, which is typically associated with grater desired consumption and borrowing restrictions early in life.
Age has a non-significant positive correlation with leverage. This variable was introduced in order to capture the positioning of the household in the life cycle and to capture the existence of a tendency of smoothing consumption over the life-cycle. Yilmazer and DeVaney (2005) found that age is an important and significant determinant on the likelihood of holding debt as well as the amount of the installment loan. Also Magri (2002) observed that demanding for loans increase with age reaching a peak around 30 years.
The result concerning Urbanization indicate as predictable that households are pruner to high levels of leverage in non-urbanized than in urbanized areas reflecting house price variation according to location. The variable Urbanization is statistically significant and presents the expected
negative sign capturing the variances in price growth and regional differences on leverage. Kholer and Smith (2005) observed that there is an urban premium built into house prices reflecting benefits that cities can provide such as greater access to infrastructures and services. According to Magri (2002) residence is important for determining household debt size due to enforcement costs.
As expected the variable Size is statistically significant and has a negative sign. The introduction of the variable Size allows observing the capability of households to produce collateral to debt holding. The model shows that Size has a negative and significant influence on leverage. According to Banks et al. (2002) households with larger asset holdings are less predispose to incur into debt than households with smaller asset holdings. On the other hand Barnes & Young (2003) noted that household debt is triggered by the desire to acquire durable goods, leading to leverage increases, in terms of assets and debt.
With the aim of understanding the effects of asset liquidity on leverage, the variable Tangibility was introduced, presenting a positive sign and statistical significance. Cunha, Lambrecht and Pawlina (2008) also find evidence in their study that tangibility has a positive and significant effect on leverage.
In order to capture the effect of family size in household debt choice the variable Children was introduced. Although having the positive expected positive sign regarding leverage, the variable Children does not present statistical significance.