Universidade de Aveiro Ano 2009
Departamento de Biologia
Fabiana Marisa
Vieira das Neves
Dinâmica de Cianobacterias na lagoa da Vela em
2008
Universidade de Aveiro Ano 2009
Departamento de Biologia
Fabiana Marisa
Vieira das Neves
Dinâmica de Cianobacterias na lagoa da Vela em
2008
Cyanobacteria dynamics at Vela Lake during 2008
Dissertação apresentada à Universidade de Aveiro para cumprimento dos requisitos necessários à obtenção do grau de Mestre em Microbiologia, realizada sob a orientação científica do Doutor Mário Jorge Verde Pereira, Professor Auxiliar do Departamento de Biologia da Universidade de Aveiro
o júri
Presidente Prof. Doutor António Carlos Matias Correia
Professor catedrático do Departamento Biologia da Universidade Aveiro
Orientador Prof. Doutor Mário Jorge Verde Pereira
Professor auxiliar do Departamento Biologia da Universidade Aveiro
Arguente Prof. Doutor Ulisses Manuel de Miranda Azeiteiro
palavras-chave Cianobacterias, Eutrofização, Dinâmica do fitoplanctôn, Lagoas pouco profundas, Parâmetros ambientais.
resumo A lagoa da Vela, localizada no litoral Centro Português (Figueira da Foz), é uma lagoa superficial com características típicas de estado trófico avançado, utilizada para actividades recreativas e como fonte de água para a agricultura e pecuária. No presente estudo foi efectuada uma recolha anual (bimensal) de forma a compreender a variação sazonal dos parâmetros ambientais e fitoplâncton, e a influência dos primeiros na variação do fitoplâncton. Os parâmetros ambientais, como temperatura, pH, condutividade, oxigénio (% e dissolvido), nutrientes (nitratos, amónia, fósforo, sílica), clorofila a e sólidos totais, foram determinados também para, comparando com trabalhos anteriores sobre esta lagoa, compreender a evolução do estado trófico desta massa de água. O fitoplâncton foi dominado por Cianobactérias durante todo o período do estudo, com densidades entre 1,0x10⁵ (Fevereiro) e 1,0x10⁶ células/mL (Setembro). Este domínio foi acompanhado por valores baixos de oxigénio e nutrientes, e por valores elevados de pH, condutividade, clorofila a e sólidos totais. As espécies Aphanizomenon flos-aquae e Cilyndrospermopsis raciborskii foram registadas em Abril e, desde Junho até Dezembro. Este trabalho também demonstra, por comparação com outros trabalhos, que o fitoplâncton e as variações de nutrientes observadas são muito diferentes daqueles descritos anteriormente na lagoa da Vela. No período em estudo identificaram-se as classes de fitoplâncton Bacillariophyceae, Chlorophyceae, Cyanophyceae, Euglenophyceae and Cryptophyceae sendo que a classe dominante durante todo o ano foi a Cyanophyceae. Relativamente aos nutrientes, estes apresentavam valores muito baixos, especialmente fósforo, nitratos e amónia.
keywords Cyanobacteria, Eutrophication, Phytoplankton dynamics, Shallow lake, Environmental parameters.
abstract Vela Lake located in Portuguese littoral-centre (Figueira da Foz), is a shallow lake with typical characteristics of advanced trophic state used for recreational proposes and as a water source for agriculture and livestock. An annual sampling (bi-monthly) was carry out in the present study in order to understand the seasonal variation of environmental parameters and phytoplankton, and the influence of the first-one on the phytoplankton variation. Environmental parameters such as temperature, pH, conductivity, oxygen (% and dissolved), nutrients (nitrate, ammonium, soluble reactive phosphorus, silica), chlorophyll a and Total suspended solids, were determined also to, by comparing with previous works on this lake, comprehend the evolution of the trophic status of this water bodie. The phytoplankton composition was dominated by Cyanobacteria during all study period, with densities between 1.0x10⁵ (February) and 1.0x10⁶ cells/mL (September). This dominance was accompanied by lowest values of oxygen and nutrients, and by highest values of pH, conductivity, chlorophyll a, and Total suspended solids. The taxa Aphanizomenon flos-aquae and Cilyndrospermopsis raciborskii were recorded in April and since June do December. This work also demonstrates, by comparing with further works, that the phytoplankton and nutrients variations observed are very different than those described in Vela Lake. In the present study period were identified phytoplankton classes Bacillariophyceae, Chlorophyceae, Cyanophyceae, Euglenophyceae and Cryptophyceae and the ruling class throughout the year was the Cyanophyceae. For nutrients, these had very low levels, especially phosphorus, nitrates and ammonium.
I
Table of Contents
Table of Contents ... I List of Figures ... II List of Tables ... III
1. Introduction ... 4
1.1. Cyanobacterial blooms (enhancement factors, cyanotoxins, toxic species) ... 6
1.2. Blooms of cyanobacteria and phytoplankton seasonal succession at Vela Lake over the last decade ... 8
1.3. Objectives and structure of thesis ... 9
2. Material and Methods ... 12
2.1. Study area ... 14
2.2. Sampling Strategy ... 14
2.3. Environmental Parameters Analysis ... 15
2.4. Phytoplankton Enumeration ... 15
2.5. Statistical analysis ... 16
3. Results ... 18
3.1. Environmental parameters and chlorophyll a ... 20
3.2. Phytoplankton Composition ... 23
3.3. The Pearson Relationship and Canonical Correspondence Analysis .... 25
3.4. Historical environmental contextualization and 2008 atypical conditions 31 4. Discussion ... 34
4.1. Environmental parameters ... 36
4.2. Phytoplankton dynamics ... 38
5. General Conclusions... 42
II
List of Figures
Figure 1. Location of Vela Lake and sampling site. ... 14 Figure 2. Variation of physical and chemical characteristics of Vela Lake water during study period (from December 2007 to December 2008)... 22 Figure 3. Variation of total phytoplankton abundance during the studied period. . 24 Figure 4. Variation of the Cyanobacteria diversity and abundance during the study period. ... 24 Figure 5. Variation of the Chlorophyta diversity and abundance during the study period. ... 25 Figure 6. Variation of diatoms diversity and abundance during the study period. 25 Figure 7. Cluster analysis of 2008 samples according to the environmental parameters. ... 28 Figure 8. Principal Component Analysis ordination biplot of samples according to environmental parameters during the study period. ... 29 Figure 9. Canonical Correspondence Analysis triplot of the phytoplankton genera/species and samples according to the environmental parameters determined during the study period. ... 30
III
List of Tables
Table 1. Environmental data recorded during the one-year study period (from December 2007 to December 2008) in Vela Lake (0.0 - undetectable) ... 20 Table 2. Algal taxa recorded for Vela Lake during the study period (from December 2007 to December 2008) ... 23 Table 3. Pearson relationship between environmental parameters and phytoplankton abundances (*P<0.05; **P<0.01; ***P<0.001) ... 27 Table 4. Summary of canonical correspondence analysis ... 30
4
1. Introduction
6
1.1. Cyanobacterial blooms (enhancement factors, cyanotoxins,
toxic species)
Cyanobacteria or blue-green algae are prokaryotes and photosynthetic microorganisms (with chlorophyll a as their primary photosynthetic pigment) that can be found in freshwater, marine and terrestrial habitats with the ability to support extreme environments (Carneiro and Leite 2008). Usually cyanobacteria have microscopic dimensions but, depending on the environment conditions, can form massive blooms by dominating the phytoplankton with negative consequences in the water quality, the aquatic flora and fauna and public health, becoming a worldwide problem (Palus et al., 2007).
Eutrophication is commonly recognized as a consequence of human activities and depends on the organic matter availability hence being indirectly linked to the chlorophyll concentration, and on others factors such as nutrients availability, light intensity and temperature (Anderson et al., 2002; Gonçalves et al., 2005; Sigee 2005). The eutrophication of surface freshwater is increasing worldwide mainly due to the pressure of anthropogenic activities on aquatic systems which are related to nutrient inputs from agriculture, livestock production, urbanization, industry and effluents discharge that lead to community changes and a deterioration of water quality. The common symptoms of eutrophication include dense phytoplankton blooms (with cyanobacterial dominance), an increase of the turbidity and particulate matter of the water, and anoxia in the deeper parts of the lake. All this has had a considerable impact on drinking and recreation water quality (Codd 2000; Anderson et al., 2002; Havens et al., 2003; Sigee 2005; Schindler et al., 2008). Cyanobacterial blooms have been associated with high water temperature and column stability, high pH levels and low O2 and ratio Total
Nitrogen (TN): Total Phosphorus (TP) (Scheffer et al., 1997; Vasconcelos 1999; Vázquez et al., 2005). Timing and duration of the cyanobacterial bloom season depend largely on the climatic conditions of the region. Normally, in temperate zones, blooms of cyanobacteria are most prominent during the late summer and early autumn and may last for 2–4 months (van Apeldoorn et al., 2007). These blooms are responsible for a decrease in water transparency, preventing the light from reaching deeper water and, therefore, only species able to migrate in water
7 column like cyanobacteria can be successful in this environment (Vasconcelos 2006).
Over the last decades coastal regions throughout the world have experimented what appears to be an escalation in the incidence of blooms. This shows a common feature – cyanobacteria have the ability to cause harm either due to the production of toxins or due to accumulated biomass affecting co-occurring organism and altering food wed dynamics (Anderson et al., 2002). Some Cyanobacteria produce extremely potent toxins and, even at low densities, blooms can be very dangerous. These toxic secondary metabolites include potent hepatotoxins (microcystins, nodularin), neurotoxins (anatoxin-a, homoanatoxin), cytotoxins (cylindrospermopsins), dermatotoxins (lyngbyatoxin) and irritant toxins (lipopolysaccharides). These compounds can cause death not only in aquatic organisms that come in direct contact with them, but also in livestock, domestic animals and wildlife, waterfowl, and more rarely, in humans (Vasconcelos 2001b; Anderson et al., 2002; Mankiewicz et al., 2003; Dittmann and Wiegand 2006; Sotero-Santos et al., 2006; Vasconcelos 2006; Erdner et al., 2008).
Microcystis spp. have the ability to produce microcystin (MC) which is a hepatotoxin with at least 75 variants and, depending on the specific chemical structure, they can be highly toxic to animals and people (Mankiewicz et al., 2003; Carmichael and Li 2006) through oral consumption (drinking contaminated water or unintentional drinking during recreational use of the water bodies suffering from cyanobacterial biomass), inhalation (also during recreational use), consumption (food and food supplements) or haemodialysis (water improperly purified) (Jochimsen et al., 1998; Mankiewicz et al., 2003; Dittmann and Wiegand 2006; Hu et al., 2009). Once ingested, this toxin cannot be destroyed by digestion and is transported to the liver (Mankiewicz et al., 2003), causing hepatic failure and potential for promotion of tumour growth (Codd et al., 2005). MC production is influenced by environment factors such as nutrients, light, pH and temperature (van Apeldoornet al., 2007) and is produced by other freshwater genera such as Anabaena, Oscillatoria, Planktothirx, Nostoc, Anabaenopsis and terrestrial genus Haplosiphon (Carmichael and Li 2006; van Apeldoorn et al., 2007; Kurmayer and Christiansen 2009). In last year’s several Portuguese freshwater bodies used for recreational or drinking proposes have been found with hepatotoxic blooms of MC (Vasconcelos et al., 1996; Vasconcelos 2001a; Vasconcelos 2001b; Vasconcelos
8 and Perreira 2001, de Figueiredo et al., 2004c). At Vela Lake, toxic strains of Microcystis aeruginosa have been reported in 1993 (Vasconcelos 1993) and latter in June/July 2001 a bloom of the same species (de Figueiredo et al., 2006) was documented although its toxicity was unknown. In the present work this species was present during all the study period. Aphanizomenon flos-aquae has differentiated specialized cells for nitrogen fixation (heterocysts) which allow it to survive during nitrogen limitation (Dittmann and Wiegand 2006). This species can produce Saxitoxin, also known as Paralytic Shellfish Poison - PSP’s, which are alkaloid tricyclic compounds that could be either non-sulphated (saxitoxins and neosaxitoxins), single sulphated (gonyautoxins), or doubly sulphated (C-toxins). In Cyanobacteria, these toxins have been found in Aphanizomenon flos-aquae, Aphanizomenon sp., Aphanizomenon issatschenkoi, Anabaena circinalis, Planktothrix sp. and benthic Lyngbya wollei (van Apeldoorn et al., 2007; Herrero and Flores 2008; Kurmayer and Christiansen 2009).
1.2. Blooms of cyanobacteria and phytoplankton seasonal
succession at Vela Lake over the last decade
The shallow Vela Lake (Figueira da Foz, Portugal) has been considered eutrophic since 1960 (Nauwerck 1960). Since then many studies made on this lake achieved similar conclusions, describing high P and N levels and turbid water (Barros 1994; Gonçalves et al., 1996; Antunes et al., 2003; Abrantes et al., 2006; Vasconcelos 2006; de Figueiredo et al., 2007; Abrantes et al., 2008; Lopes et al., 2009).
In the last decade some studies have been made and published in order to observe this lake’s status, concerning the seasonal variation of phytoplankton and physicochemical parameters (Antunes et al., 2003; Abrantes et al., 2006; de Figueiredo et al., 2006; Lopes et al., 2009). These works showed a considerable increase of the eutrophication level of Vela Lake.
Some authors such as Antunes et al. (2003), Abrantes et al. (2006) and de Figueiredo et al. (2006) have described that phytoplankton seasonal succession in Vela Lake was highly correlated with temperature and nutrients. During the autumn-winter period (low temperatures and high N, SiO2 and P levels) the
9 spring (decrease in nutrients as P) and Cyanobacteria in the late spring and summer period (increase of light and temperature, and decrease of N and P concentrations). This dynamics has been documented by other authors in temperate lakes (Sigee 2005). During cyanobacterial dominance there are often observed blooms of potentially toxic cyanobacteria such as Microcystis aeruginosa and Aphanizomenon flos-aquae (Abrantes et al., 2006; de Figueiredo et al., 2006). Microcystis aeruginosa is able to produce hepatotoxins such as microcystins (MC) (de Figueiredo et al., 2004c). Vasconcelos and collaborators (1993) have reported toxic strains of Microcystis aeruginosa at Vela Lake. Aphanizomenon flos-aquae can produce neurotoxins such as saxitoxins, also known as paralytic shellfish poison - PSP’s (van Apeldoorn et al., 2007; Herrero and Flores 2008; Kurmayer and Christiansen 2009). This species was recorded in Vela Lake in May 2001 during a work of de Figueiredo and collaborators (2006) and Abrantes and collaborators (2006) and related with low nitrogen levels which made this species an advantageous competitor (due to nitrogen fixation ability) towards the other phytoplankton organisms.
1.3. Objectives and structure of thesis
This work intends to study the seasonal variation (from December 2007 to December 2008) of environmental parameters and phytoplankton assemblage at the shallow eutrophic Vela Lake (Figueira da Foz, Portugal). It also aims to explore the influence of environmental conditions on the seasonal variation of the phytoplankton, particularly on the development of cyanobacterial blooms. Additionally, it is made a comparison of the present data with a previous work (from 2001) (de Figueiredo et al., 2006), in order to comprehend the evolution of the lake trophic status, and investigate if conditions compatible with global warming may have had any effect on the differences found.
This dissertation works is composed by 6 sections. The first one is the introduction in which the importance of cyanobacterial blooms’ study is highlighted. The second section includes the description of material and methods where the study area, the sampling strategy, environmental parameters analysis, phytoplankton enumeration and statistical analysis are explained. The results obtained are presented in the third section and discussed in the fourth one. On the
10 fifth section there are made the general conclusions from this work. The sixth section shows all the references used to fundament this dissertation.
12
2. Material and Methods
14
2.1. Study area
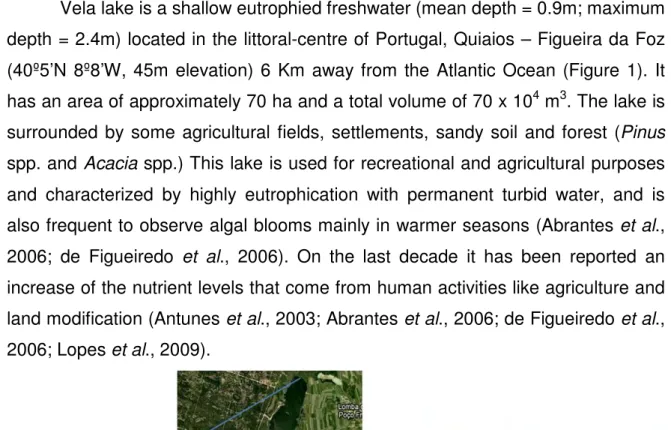
Vela lake is a shallow eutrophied freshwater (mean depth = 0.9m; maximum depth = 2.4m) located in the littoral-centre of Portugal, Quiaios – Figueira da Foz (40º5’N 8º8’W, 45m elevation) 6 Km away from the Atlantic Ocean (Figure 1). It has an area of approximately 70 ha and a total volume of 70 x 104 m3. The lake is surrounded by some agricultural fields, settlements, sandy soil and forest (Pinus spp. and Acacia spp.) This lake is used for recreational and agricultural purposes and characterized by highly eutrophication with permanent turbid water, and is also frequent to observe algal blooms mainly in warmer seasons (Abrantes et al., 2006; de Figueiredo et al., 2006). On the last decade it has been reported an increase of the nutrient levels that come from human activities like agriculture and land modification (Antunes et al., 2003; Abrantes et al., 2006; de Figueiredo et al., 2006; Lopes et al., 2009).
Figure 1. Location of Vela Lake and sampling site.
2.2. Sampling Strategy
Water samples were collected fortnightly just below the water surface, over a 1-year period (from December 2007 to December 2008), always in the same place (40º16’N 8º47’W – Figure 1) and by the same hour (around 12:00h). Samples were enumerated according to the sequential days of sampling. In each sampling day water samples were collected for determination of chemical parameters (phosphates, nitrates, ammonia, total suspend solids (TSS)) and Chlorophyll a – Chl a - (as an estimate of algal biomass) into a 1.5L plastic bottle
15 and transported in a refrigerated bag to the laboratory, in the dark at 4ºC. Water was also collected for DNA extraction and investigation of prokaryote dynamics through molecular approaches (data not included in the present dissertation).
2.3. Environmental Parameters Analysis
The following parameters were measured in the field using portable water testing meter (WTW Multiline P4): pH, water and air temperature, electrical conductivity and dissolved oxygen. In the laboratory, ammonia (NH4+-N) was
determinate through indophenol blue method according Rodier (2005), and nitrates (molecular absorption spectrophotometry method; NO3--N), soluble
reactive phosphorus – SRP (acid ascorbic method; PO43-), and silica
(molybdosilicate method; SiO2) were quantified according to methodologies
described by APHA (2005). For the determination of TSS, samples were filtered through preweighted filters (Whatman GF/C) and the solids were calculated according to the APHA (2005). For Chl a the water was filtered on glass fibre filters (Whatman GF/C) and extracted in 90% acetone in the dark, following APHA (2005).
2.4. Phytoplankton Enumeration
For phytoplankton analyses a 1L sample was preserved into a glass bottle with Lugol solution (1% v/v) for subsequent identification and enumeration. The quantitative measurements of phytoplankton were made using the sedimentation technique according the APHA (2005), counting at least 400 species in an inversion optical microscope (Utermöhl method), following Lund et al. (1958). The identification was performed using different references for Cyanobacteria (Bourrelly 1970; Komárek and Anagnostidis 1989), Chlorophyta (Bourrelly 1972; Komarék and Fott 1983), Bacillariophyceae (Bourrelly 1968; Germain 1981), Cryptophyceae (Bourrelly 1970) and Euglenophyceae (Bourrelly 1970).
16
2.5. Statistical analysis
The distribution of samples according to environmental parameters was assessed through Principal Component Analysis (PCA) (Pearson 1901) after environmental parameters data standardization (subtracting the mean from each observation and dividing by the corresponding standard deviation) and the data of phytoplankton community was logarithmically transformed. Dendrograms were
also created with the similarities calculated using the Pearson correlation coefficient (95% probability) and the PRIMER 6 software (Clarke and Gorley 2006). Pearson correlation coefficient was also used to assess significant correlations between environmental parameters and between phytoplankton considering their occurrence and relative densities. Canonical correspondence analysis (CCA) (ter Braak 1986) was performed to verify relationships between the distribution of the dominant genera/species and environmental variables.
18
3. Results
20
3.1. Environmental parameters and chlorophyll a
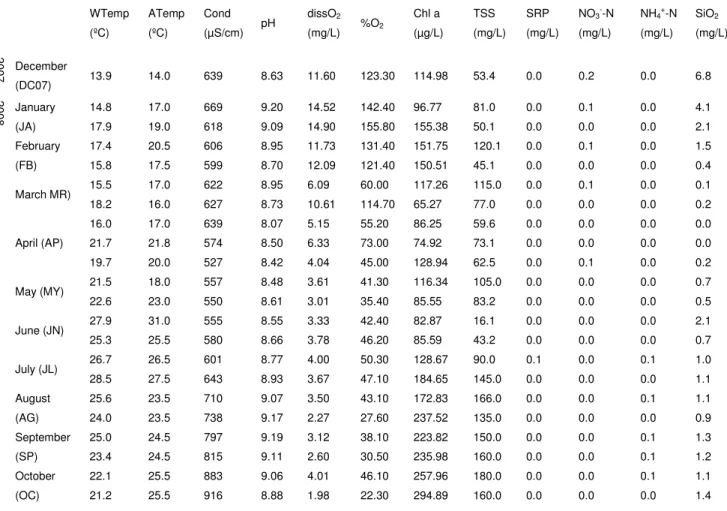
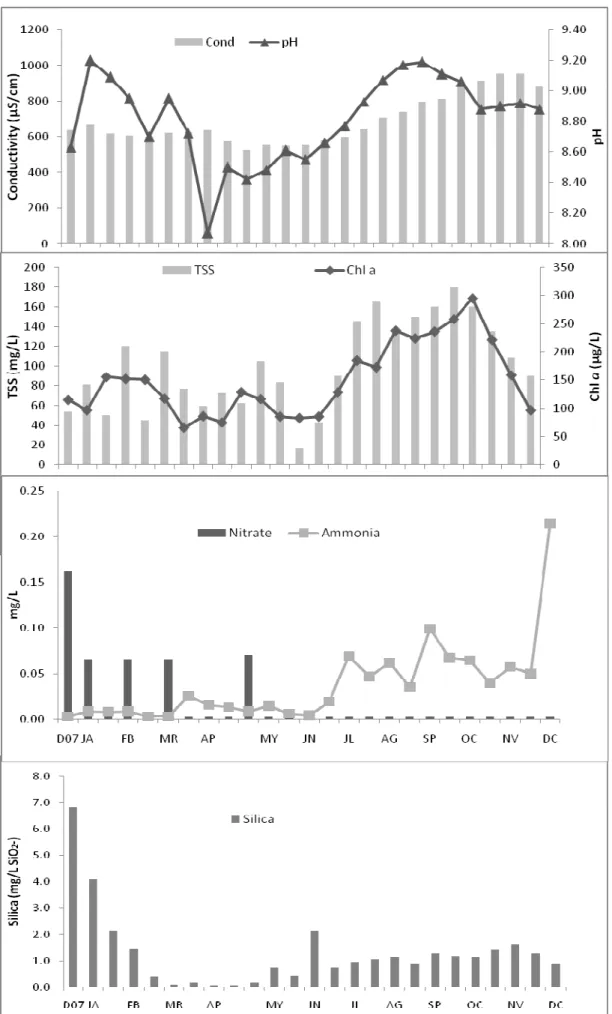
The environmental parameters were determined for each sample and are presented (with corresponding codes) in Table 1 and Figure 2. During the study period (December 2007 to December 2008) the water temperature (WTemp) ranged between 10ºC and 28.5ºC with lowest temperature registered in December 2008 and the highest in July (as observed for the air temperature (ATemp)). pH values were alkaline during all year, showing a minimum of 8.07 in April and a maximum of 9.20 in January. The conductivity levels (Cond) showed a minimum of 527 µS/cm (April) and had the highest levels between October and December 2008 (955 µS/cm – November). The levels for dissolved oxygen (dO2) ranged from
1.98 (in October) to 14.90 mg/L (January), and the oxygen saturation (%O2)
followed the same trend with a minimum of 22.30 % and a maximum of 155.80 % in the same months.
Table 1. Environmental data recorded during the one-year study period (from December 2007 to December 2008) in Vela Lake (0.0 - undetectable).
WTemp (ºC) ATemp (ºC) Cond (µS/cm) pH dissO2 (mg/L) %O2 Chl a (µg/L) TSS (mg/L) SRP (mg/L) NO3--N (mg/L) NH4+-N (mg/L) SiO2 (mg/L) 2 0 0 7 December (DC07) 13.9 14.0 639 8.63 11.60 123.30 114.98 53.4 0.0 0.2 0.0 6.8 2 0 0 8 January (JA) 14.8 17.0 669 9.20 14.52 142.40 96.77 81.0 0.0 0.1 0.0 4.1 17.9 19.0 618 9.09 14.90 155.80 155.38 50.1 0.0 0.0 0.0 2.1 February (FB) 17.4 20.5 606 8.95 11.73 131.40 151.75 120.1 0.0 0.1 0.0 1.5 15.8 17.5 599 8.70 12.09 121.40 150.51 45.1 0.0 0.0 0.0 0.4 March MR) 15.5 17.0 622 8.95 6.09 60.00 117.26 115.0 0.0 0.1 0.0 0.1 18.2 16.0 627 8.73 10.61 114.70 65.27 77.0 0.0 0.0 0.0 0.2 April (AP) 16.0 17.0 639 8.07 5.15 55.20 86.25 59.6 0.0 0.0 0.0 0.0 21.7 21.8 574 8.50 6.33 73.00 74.92 73.1 0.0 0.0 0.0 0.0 19.7 20.0 527 8.42 4.04 45.00 128.94 62.5 0.0 0.1 0.0 0.2 May (MY) 21.5 18.0 557 8.48 3.61 41.30 116.34 105.0 0.0 0.0 0.0 0.7 22.6 23.0 550 8.61 3.01 35.40 85.55 83.2 0.0 0.0 0.0 0.5 June (JN) 27.9 31.0 555 8.55 3.33 42.40 82.87 16.1 0.0 0.0 0.0 2.1 25.3 25.5 580 8.66 3.78 46.20 85.59 43.2 0.0 0.0 0.0 0.7 July (JL) 26.7 26.5 601 8.77 4.00 50.30 128.67 90.0 0.1 0.0 0.1 1.0 28.5 27.5 643 8.93 3.67 47.10 184.65 145.0 0.0 0.0 0.0 1.1 August (AG) 25.6 23.5 710 9.07 3.50 43.10 172.83 166.0 0.0 0.0 0.1 1.1 24.0 23.5 738 9.17 2.27 27.60 237.52 135.0 0.0 0.0 0.0 0.9 September (SP) 25.0 24.5 797 9.19 3.12 38.10 223.82 150.0 0.0 0.0 0.1 1.3 23.4 24.5 815 9.11 2.60 30.50 235.98 160.0 0.0 0.0 0.1 1.2 October (OC) 22.1 25.5 883 9.06 4.01 46.10 257.96 180.0 0.0 0.0 0.1 1.1 21.2 25.5 916 8.88 1.98 22.30 294.89 160.0 0.0 0.0 0.0 1.4
21 The nitrate (NO3-N) concentration remained below 0.1 mg/L with the exception of
December 2007 where 0.2 mg/L was detected, while ammonium (NH4-N) levels
ranged between 0 and 0.2 mg/L (December 2008). Soluble reactive phosphorus (SRP) concentration was undetectable (<0.1 mg/L) for most samples but showed a maximum of 0.1 mg/L in July. The silica (SiO2) concentration showed a maximum
in December 2007 (6.8 mg/L) and a minima between the end of February and April. Total suspended solids (TSS) showed a minimum value at June (16.1 mg/L) and maximum at October (180 mg/L) while chlorophyll a concentration ranged between 65.27 µg/L (in March) and 294.89 µg/L (in October).
November (NV) 14.9 17.0 955 8.90 2.40 24.00 221.24 135.0 0.0 0.0 0.1 1.6 17.4 19.0 952 8.92 2.34 25.10 158.47 108.0 0.0 0.0 0.1 1.3 December (DC) 10.0 8.5 639 8.88 2.62 24.20 96.63 90.0 0.0 0.0 0.2 0.9
22
Figure 2. Variation of physical and chemical characteristics of Vela Lake water during study period (from December 2007 to December 2008).
23
3.2. Phytoplankton Composition
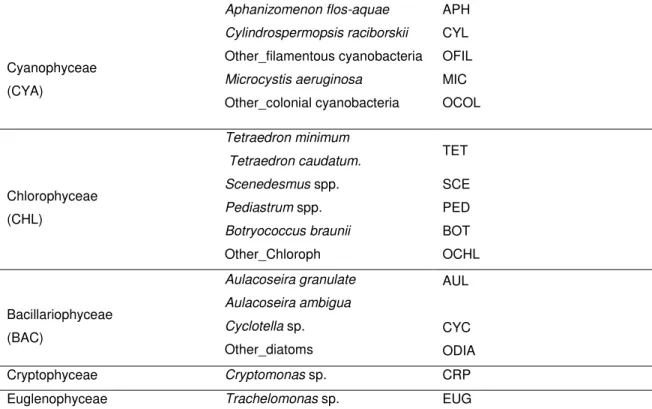
During the study period there were identified in Vela Lake the phytoplankton classes Bacillariophyceae, Chlorophyceae, Cyanophyceae, Euglenophyceae and Cryptophyceae. The genera recorded are presented in Table 2 and their annual variation in Figures 3 - 6.
Table 2. Algal taxa recorded for Vela Lake during the study period (from December 2007 to December 2008).
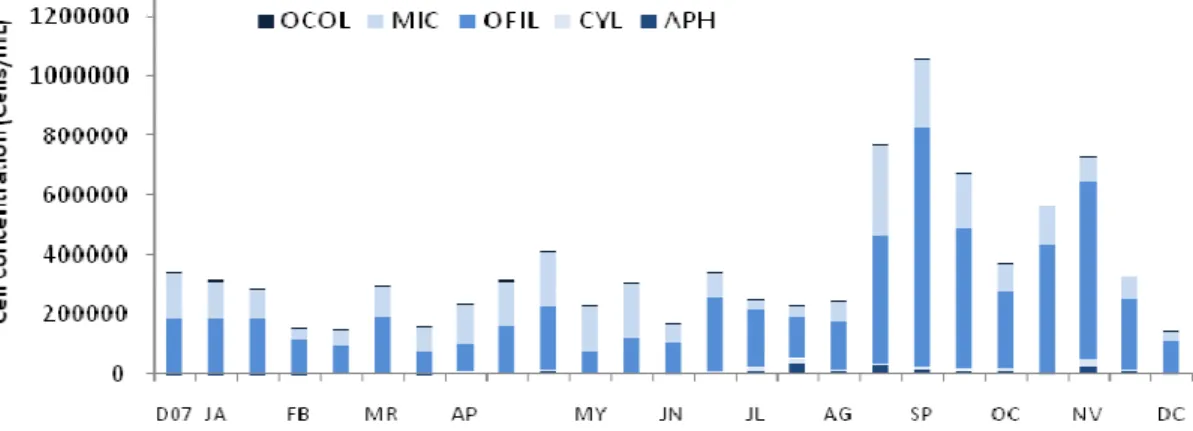
Cyanobacteria dominated the phytoplankton assemblage during all year with densities ranging from a minimum of 1.5x10⁵ cells/mL in February and a maximum between 7.7x10⁵ cells/mL in August and 7.3x10⁵ cells/mL in November (highest value quantified was 1.0x10⁶ cells/mL in September). This dominance period was accompanied by the lowest values for dO2 (1.38 – 4.01 mg/L), %O2
(22.3 – 41.1), nutrients (SRP and NO3-N – 0 mg/L; NH4-N ≈ 0 mg/L; and SiO2 - 0.9
– 1.6 mg/L). The highest values of pH (8.88 – 9.19), conductivity (738 – 955 µs/cm), Chl a (221.24 – 294.89 µg/L) and TSS (135 – 180 mg/L) were registered in this period while WTemp and ATemp ranges were 14.9 – 25.0ºC and 17.0 – 25.5ºC, respectively. In general, the filamentous forms of Cyanobacteria were the
Cyanophyceae (CYA) Aphanizomenon flos-aquae Cylindrospermopsis raciborskii Other_filamentous cyanobacteria Microcystis aeruginosa Other_colonial cyanobacteria APH CYL OFIL MIC OCOL Chlorophyceae (CHL) Tetraedron minimum Tetraedron caudatum. Scenedesmus spp. Pediastrum spp. Botryococcus braunii Other_Chloroph TET SCE PED BOT OCHL Bacillariophyceae (BAC) Aulacoseira granulate Aulacoseira ambigua Cyclotella sp. Other_diatoms AUL CYC ODIA Cryptophyceae Cryptomonas sp. CRP
24 most abundant, followed by the colonial form Microcystis spp. (Figure 4). In April and from June to December 2008 there were always present the taxa Aphanizomenon flos-aquae and Cylindrospermopsis raciborskii.
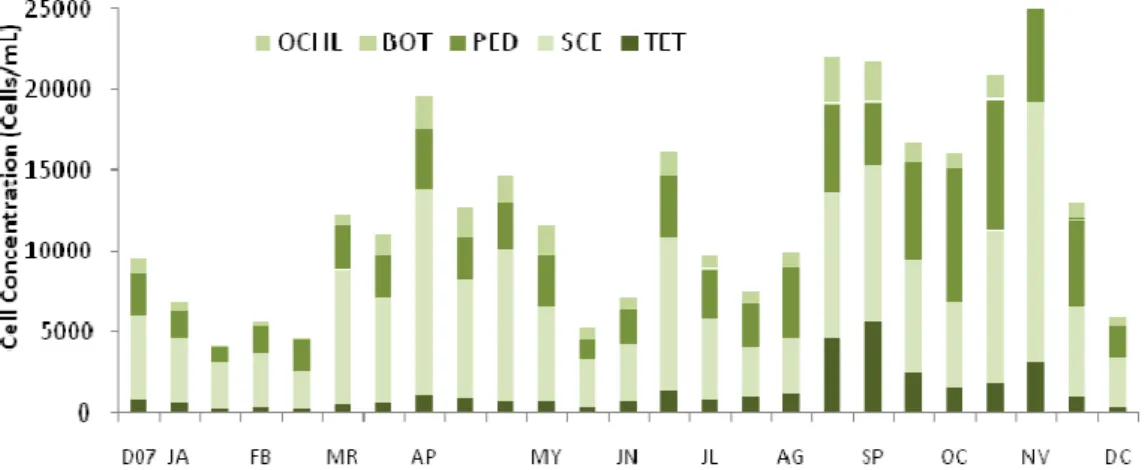
Relatively to the Chlorophytes and Diatoms their presence was stable and in low densities during all the study period (Figure 5 and 6) although there was verified a slight increase in their densities at the same time as the Cyanobacteria. The densities of Chlorophytes varied between 4.2x10³ (January) – 2.8x10⁴ cells/mL (November) with Scenedesmus spp. been the genera with highest densities. Diatoms varied between 36 (January) – 8.4x10² cells/mL (August). As said above, this increase was related to lower values of dO2, %O2 and nutrients,
and by the highest values of pH, conductivity, Chl a and TSS.
Figure 3. Variation of total phytoplankton abundance during the studied period.
25
Figure 5. Variation of the Chlorophyta diversity and abundance during the study period.
Figure 6. Variation of diatoms diversity and abundance during the study period.
3.3. The Pearson Relationship and Canonical Correspondence
Analysis
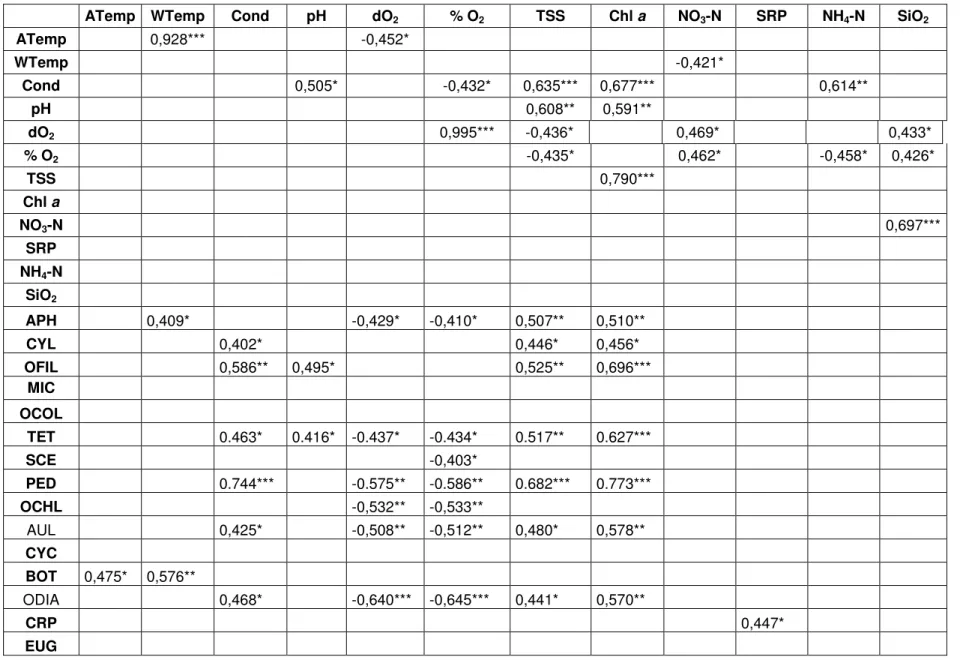
The Pearson correlation coefficient values (Table 3) revealed relationships between the recorded environmental parameters and phytoplankton abundance (n = 25). Water temperature was highly significantly positively correlated with air temperature (r = 0.93, P < 0.001), but showed significant negative correlations with dissolved oxygen (r = -0.45, P < 0.05) and nitrate (r = -0.42, P < 0.05) concentrations. The dissolved oxygen and oxygen saturation levels were also highly correlated (r = 1.0, P < 0.001) and both these parameters showed also positive correlations (P < 0.05) with nitrate (r = 0.47 and 0.46, respectively) and
26 silica (r = 0.43 for both) concentrations. In fact, silica and nitrate concentrations showed to be highly correlated as well (r = 0.70, P < 0.001). However, negative significant correlations (P < 0.05) were observed between dissolved oxygen / oxygen saturation levels and ammonium (r = -0.44 and -0.46, respectively) but also TSS (r = -0.44 for both). On the other hand, TSS had highly significant relationships with Chl a (r = 0.79, P < 0.001), conductivity (r = 0.64, P < 0.001) and pH (r = 0.61, P < 0.01). The pH also showed a significant correlation with Chl a (r = 0.59, P < 0.01) while conductivity had also positive correlations with Chl a (r = 0.68, P < 0.001), ammonium (r = 0.61, P < 0.01) and pH levels (r = 0.51, P < 0.05) but a negative correlation with oxygen saturation levels (r = -0.43, P < 0.05).
The Pearson correlation coefficient was also used to reveal relationships between the environmental parameters and the phytoplankton abundances (Table 3). Water temperature showed to be correlated with APH (r = 0.41, P < 0.05) and BOT (r = 0.58, P < 0.01). TSS have had a positive correlation with all filamentous forms of Cyanobacteria (APH (r = 0.51, P < 0.01), CYL (r = 0.4, P < 0.05) and OFIL (r = 0.53, P < 0.01)), the chlorophytes TET (r = 0.52, P < 0.01) and PED (r = 0.68, P < 0.001), and diatoms such as AUL (r = 0.48, P < 0.05). Chl a was also positively correlated with the development of filamentous cyanobacteria (APH (r = 0.5, P < 0.01); CYL (r = 0.46, P < 0.001); OFIL (r = 0.70, P < 0.05), as well as the same chlorophytes (TET (r = 0.63, P < 0.001) and PED (r = 0.77, P < 0.001)) and diatoms (AUL (r = 0.58, P < 0.01)) referred above. Conductivity showed positive correlations with the growth of CYL (r = 0.40, P < 0.05) and OFIL (r = 0.59, P < 0.01), TET (r = 0.46, P < 0.05), PED (r = 0.74, P < 0.001) and AUL (r = 0.43, P < 0.05). TET (r = 0.42, P < 0.05) and filamentous cyanobacteria (including Leptolyngbya sp. – data not shown) (OFIL (r = 0.50, P < 0.05)) showed to be correlated with pH. In general, Chlorophytes had negative correlations with %O2
(TET (r = -0.44, P < 0.05); SCE (r = -0.40, P < 0.05); PED (r = -0.59, P < 0.01) and OCHL (r = -0.53, P < 0.01)) and with dO2 (TET (r = 0.44, P < 0.05), PED (r =
27
Table 3. Pearson relationship between environmental parameters and phytoplankton abundances (*P<0.05; **P<0.01; ***P<0.001).
ATemp WTemp Cond pH dO2 % O2 TSS Chl a NO3-N SRP NH4-N SiO2
ATemp 0,928*** -0,452* WTemp -0,421* Cond 0,505* -0,432* 0,635*** 0,677*** 0,614** pH 0,608** 0,591** dO2 0,995*** -0,436* 0,469* 0,433* % O2 -0,435* 0,462* -0,458* 0,426* TSS 0,790*** Chl a NO3-N 0,697*** SRP NH4-N SiO2 APH 0,409* -0,429* -0,410* 0,507** 0,510** CYL 0,402* 0,446* 0,456* OFIL 0,586** 0,495* 0,525** 0,696*** MIC OCOL TET 0.463* 0.416* -0.437* -0.434* 0.517** 0.627*** SCE -0,403* PED 0.744*** -0.575** -0.586** 0.682*** 0.773*** OCHL -0,532** -0,533** AUL 0,425* -0,508** -0,512** 0,480* 0,578** CYC BOT 0,475* 0,576** ODIA 0,468* -0,640*** -0,645*** 0,441* 0,570** CRP 0,447* EUG
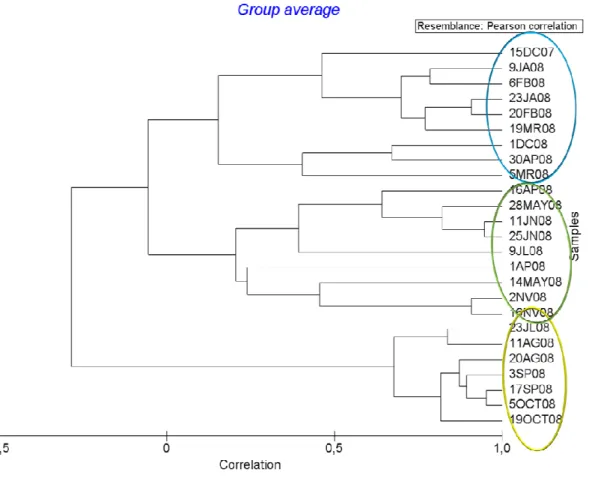
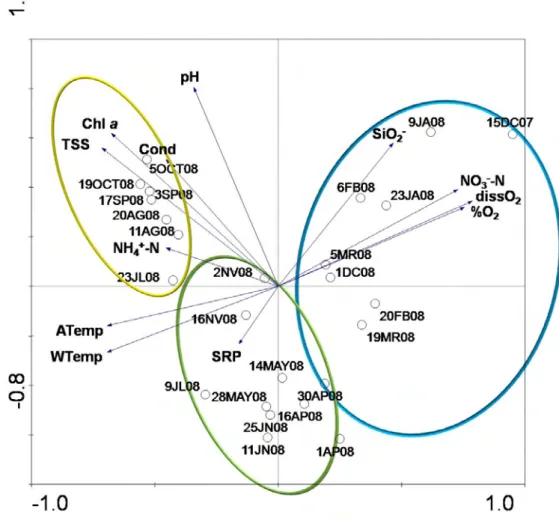
28 Cluster analysis according to environmental parameters (Figure 7) shows a clear seasonal separation of samples. Principal Component Analysis (Figure 8) also evidences the seasonal gradient from the dendrogram with the first axis generally defined by late summer and early autumn samples on the negative side and winter sample 15DC07 followed by the other winter samples on the positive side. This axis showed to be mainly defined by oxygen and nitrate levels but also water and air temperatures, and TSS and Chl a levels. The second axis was defined by samples 1AP08 and 11JN08 and the other spring and early summer samples on the negative side and the winter samples 15DC07 and 9JA08 on the positive side and was mostly related to pH. The first two axes of the PCA accounted for 53 % of the total variance of samples distribution (Table 4).
29
Figure 8. Principal Component Analysis ordination biplot of samples according to environmental parameters during the study period.
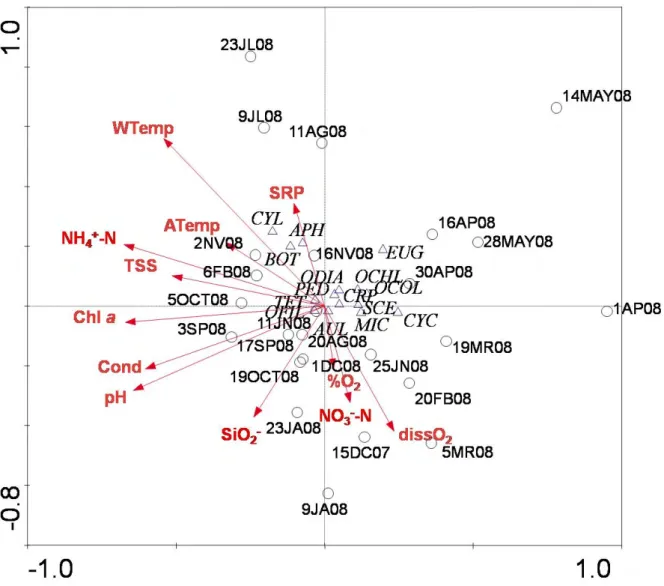
The results of CCA (Figure 9) adjustment of the phytoplankton genera and some species registered and the environmental parameters allows to conclude that the first axis is mainly defined by pH, NH4+-N, Chl a, conductivity and WTemp
levels; the positive side is defined by diatoms (CYC), Euglenophytes (EUG) and the spring samples whereas the negative side was defined by BOT and sample 3SP08. The second axis was related with water temperature, dissolved oxygen, SiO2, NO3—N and SRP. Cyanobacteria (CYL, APH) and summer samples define
the positive side and the negative side is defined by winter samples and, in spite of not having a clear segregation, diatoms CYC and AUL, and Cyanobacteria MIC and OFIL. The first two axes of the CCA accounted for 76 % of the total variance of samples and species distribution (Table 4).
30
Figure 9. Canonical Correspondence Analysis triplot of the phytoplankton genera/species and samples according to the environmental parameters determined during the study period.
Table 4. Summary of canonical correspondence analysis
Axis 1 Axis 2 Axis 3 Axis 4
Eigenvalues 0.049 0.019 0.011 0.005 Species-environment correlations 0.946 0.785 0.882 0.712 Cumulative percentage variance: of species data 38.1 53.3 61.7 65.3 of species-environment relation 54.2 75.8 87.7 92.8
31
3.4. Historical environmental contextualization and 2008 atypical
conditions
In order to assess potential environmental changes in 2008 which may have enhanced the development of C. raciborskii blooms, a comparison with environmental data having the same sampling periodicity was performed. These data are from 2000/2001 and have been published elsewhere (de Figueiredo et al., 2006).
Figure 10. Cluster analysis of 2001 and 2008 samples according to environmental parameters.
Sum of all eigenvalues 0.128
Sum of all canonical eigenvalues
0.090
32
Figure 11. Principal Component Analysis relating fortnight samples from 2001 and 2008 and their distribution according to environmental parameters.
Table 5: Summary of ordination analysis of samples using environmental parameters of the present work and the results from 2001 obtained and described by de Figueiredo et al. (2006).
The dendrogram (Figure 10) and PCA (Figure 11) relating fortnight samples from 2001 and 2008 showed a clear segregation of samples from both years, independently from season, as illustrated by the axis 1 of the PCA. The negative side of the first axis was defined by 2008 samples while the positive side was
Axis 1 Axis 2 Axis 3 Axis 4
Eigenvalues 0.516 0.201 0.117 0.057
Cumulative percentage variance
Of species data 51.6 71.7 83.4 89.1
33 defined by 2001 samples. This axis was mainly related to TSS, Chl a, conductivity and pH (higher in all 2008 samples). The second axis showed to be mainly related to typical seasonality in 2001 but not in 2008 where samples are mixed. This axis was defined by sample 1JL01 in the positive side while autumn samples 19OCT08 and 2NV08 along with winter sample 20DC00 defined its negative side. This axis was mainly related with dissolved oxygen, pH and conductivity. These first two axes showed to explain 72% of the total variability among samples (Table 5).
34
4.
Discussion
36
4.1. Environmental parameters
Vela Lake is considered a eutrophic lake with high P and N levels (Antunes et al., 2003). The external nutrient loading comes from freshwater systems and source inflow from surrounding catchment area (Sigee 2005). Nitrogen is an essential compound of living organisms and has a wide range forms such as nitrates (NO3-N) and ammonium (NH4-N). Relatively to these forms, while recent
studies (Antunes et al., 2003; Abrantes et al., 2006; de Figueiredo et al., 2006) recorded high nutrients concentrations during winter period (December to April). In the present work the concentrations for nitrates were very low (≤ 0.1 mg/L) or undetectable throughout the all study period. Phosphorus is another essential element present in all living systems, as a structure molecule, storage component and energy transformation (Sigee 2005). In this work, phosphorus is presented as SRP, and was undetectable during all year, except in July. This low availability is also due to the low inflow levels into Vela Lake. These nutrients concentrations and variations are not concordant with those described for eutrophic lakes (Anderson et al., 2002; Schindler et al., 2008) or either by de Figueiredo et al. (2006) for Vela Lake. According to Abrantes et al. (2008) the hydric regime of the Vela Lake is influenced 10% by rainfall, and the other 90% by fluxes (surface and subterraneous) discharges into the lake. The study year (from December 2007 to December 2008) was warmer and drier, with lower rainfall than usual, which can explain the low nutrients concentrations recorded.
Silicon is a common element in the Earth, presented mainly as silica (SiO2).
This compound has little biological significance for freshwater microorganism except for diatoms, as it is its major cell-wall constituent (Sigee 2005; Domis and Mooij 2007). During the study period, silica availability was high, except from February to April when concentrations became lower than 0.3 mg/L which is a limitation for diatoms growth as previously reported (Barros et al., 1993).
Temperature is one of the most important environmental parameter that determines the growth and survival of microorganisms (Sigee 2005; Paul 2008). Over the past century the global temperature has increased on average by 0.6ºC (Domis and Mooij 2007; Paul 2008). ATemp and WTemp values for Vela Lake were high and very close and the oscillation of the first one affects, as expected,
37 the second. This happens because this lake has no thermal stratification, low profundity and it is exposed to the influence of the wind. As expected, the highest temperatures were registered in July (summer period) and the lowest in December (winter period). High temperature environments result of solar and geothermal heating or/and human activity; it is often related to higher values for pH, oxygen concentration and hydrostatic pressure (Sigee 2005).
The present work has registered higher temperatures, pH and conductivity levels by comparing to previous studies made on this lake (de Figueiredo et al., 2006). The higher turbidity also observed as well as the higher pH values lead to dominance of Cyanobacteria in shallow eutrophic lakes (Reynolds et al., 2000; Kemka et al., 2006). The alkalinity of water results from photosynthetic and respiratory activities that cause a decrease in CO2 values and consequent
disruption in equilibrium and pH increase (Whitton and Potts 2000; López-Archilla et al., 2004; Sigee 2005). Vela Lake has been already characterized as alkaline (Fernandes 1999; de Figueiredo et al., 2006; Danielsen 2009), and this study can confirm that during the entire study period the pH values were higher than 8.
Conductivity is dependent on the ionic strength of the medium, so the conductivity will be greater the higher the concentration of ions. The highest values registered for conductivity (527 to 995 µS/cm) are due to the dry year with low rainfall. The lowest value was recorded during a rainfall period.
The dissolved oxygen is affected by organic matter degradation as well as photosynthetic and respiratory activities (Miranda et al., 2001). The values recorded during winter period (December07 to February08) were high (never below 10 mg/L). In the summer period it was verified a decrease in dissolved oxygen values due to the registered temperature increase. The same variation was recorded regarding oxygen saturation (%O2), due to the same situation.
Unlike this work, the values obtained in 2001 and detailed in the work of de Figueiredo et al. (2006), were higher in summer period and lower in winter period.
Chl a is a distinguishing constituent of phytoplankton and it is widely used as a convenient index of phytoplankton bloom (Whitton and Potts 2000). In this work it was high during all year with the highest concentrations (> 200 µg/L) from
38 August to November. These values were way above the ones recorded in 2000/1 (de Figueiredo et al., 2006) and consistent with bloom formation.
4.2. Phytoplankton dynamics
The studies made in Vela Lake (Antunes et al., 2003; Abrantes et al., 2006; de Figueiredo et al., 2006; Lopes et al., 2009) demonstrate seasonal phytoplankton dynamics where diatoms dominate during winter period under conditions of low temperatures and high nutrient levels. In early spring Chlorophytes dominate the phytoplankton and the cyanobacterial dominance is usually observed in summer until autumn period (highest temperatures and lowest nutrients availability). In the present work, the abundance of Chlorophytes and Diatoms was stable during all the study period but with higher concentrations at the same time and in accordance with the higher concentrations of cyanobacteria (August to November 2008). Relatively to Chlorophyta, it was the group with highest densities after cyanobacteria. In the work of de Figueiredo et al. (2006) this phytoplankton group was present in March and April with higher densities. Diatoms succession can be explained by silica availability. However, their densities were much lower by comparing to 2001 data (7.81 x 10⁴ until 1.32 x 10⁶) (de Figueiredo et al., 2006). During the study period when diatoms densities increase (February and June) silica levels decrease. This is in accordance to the findings of Domis 2007 (Domis and Mooij 2007). In this work, the growth of the chorophycean Botryococcus braunii and of the diatoms of the genus Aulacoseira were related to high water temperatures as previously recorded by de Figueiredo et al. (2006) at Vela Lake. High values for TSS, conductivity and Chl a were also related to an increase in the development of Tetraedron minimum and Tetraedron caudatum, and Pediastrum spp. as well as the Aulacoseira spp.. The growth of Tetraedron spp. showed to be also promoted by an increase in pH values.
In shallow lakes with no thermal stratification just like in Vela Lake, phytoplankton productivity shows little variation during the year, the main external factor productivity is rain and wind, which, in turn, exert influence on the nutrients (Ganf 1974). More, climate change may also cause quantitative changes in
39 phytoplankton community dynamics, shown as changes in phytoplankton species composition or changes in seasonal succession of phytoplankton groups (Domis and Mooij 2007; Paul 2008; Hu et al., 2009) by favouring cyanobacteria growth over diatoms and green algae’s development. This study is concordant with that, as it was verified a low succession dynamics and diversity of phytoplankton with predominance of cyanobacteria (filamentous forms) during all the study period when higher temperatures and lower rainfall were registered. Some authors (Scheffer et al., 1997; Dokulil and Teubner 2000) relate the dominance of filamentous cyanobacteria forms to shallow turbid lakes. Factors such as reduced transparency, decreased biodiversity, oxygen depletion, odour and taste compounds and toxins production are also associated to cyanobacterial dominance (Dokulil and Teubner 2000; Downing et al., 2001). In the present study, Cyanobacteria abundance was higher during summer period, as recorded by other authors (Dokulil and Teubner 2000; Domis and Mooij 2007; Paul 2008), achieving the highest densities between August and November when the lowest oxygen levels and nutrient and silica concentrations were recorded along with the highest values of pH, conductivity, Chl a and TSS as well as high temperatures. The filamentous forms of Cyanobacteria were the most abundant (including the taxa Aphanizomenon flos-aquae and Cylindrospermopsis raciborskii), followed by the colonial forms like Microcystis spp.. However, Scheffer and collaborators (1997) describe that when winter period is not too cold the dominance of these forms can even persist throughout the year such as observed for Vela Lake in 2008 (unlike reported in 2001 when this dominance of cyanobacteria (mainly of Aphanizomenon flos-aquae and Pseudanabaena sp.) was verified only from May until November).
The cyanobacteria dominance observed during the study period can be also explained by a combination of several factors that led them to survive under extreme conditions. They have properties such as gas vesicles (for migration in water column), low CO2/high pH optimum and excretion of toxic compounds that
inhibit the growth of algae. The ability of cyanobacteria (such as Microcystis spp.) to migrate vertically in the water column gives them competitive advantage by storaging internal phosphorus reserves, and therefore survive under limited
40 concentrations of this compound (Dokulil and Teubner 2000). Some species like Aphanizomenon flos-aquae and Cylindrospermopsis raciborskii are also able to fix nitrogen (Dokulil and Teubner 2000). This capability could be the explanation of the highest densities registered for these two species from June to December, were the nitrate values were undetectable. Danielsen 2009 made a compilation of the recorded alga flora in all studies made on Vela Lake and blooms of Cylindrospermopsis raciborskii have never been documented, although the occurrence of Microcystis aeruginosa and Aphanizomenon flos-aquae blooms are already well documented for Vela Lake (Abrantes et al., 2006; de Figueiredo et al., 2004a; de Figueiredo et al., 2004b; de Figueiredo et al., 2004c; de Figueiredo et al., 2006; de Figueiredo et al., 2009). These species have the ability to produce seriously dangerous toxins. Microcystis spp. can produce microcystin that have been reported in Portuguese freshwater bodies as Vela Lake (Vasconcelos et al., 1996; Vasconcelos 2001a; Vasconcelos 2001b; Vasconcelos and Perreira 2001, de Figueiredo et al., 2004c). Aphanizomenon flos-aquae is able to produce Saxitoxins, or PSP, that are neurotoxins that retard the movement of sodium ions through nerve cell membranes, and may block the flow of nerve impulses to cause the symptoms of PSP toxicity, which include paralysis and disorientation. Aphanizomenon flos-aquae was reported in Vela Lake in May 2001 (de Figueiredo et al., 2006) and related to low nitrogen levels. In the present work it was documented in April 2008 and from June to December 2008; its development was correlated with high values for water temperature, TSS and Chl a. The filamentous, nitrogen fixing, freshwater Cylindrospemopsis raciborskii was first recorded in Java, Indonesia and described as Anabaenopsis raciborskii (1912) and classified as a tropical species optimally growing at 25 °C. The genus Cylindrospermopsis, with C. raciborskii as type species, was only established in 1972 (Hawkins et al., 1985; Druart and Briand 2002; Vidal and Kruk 2008; Kokocinski et al., 2009). Since then, it has shown to be abundant in lakes and rivers in many tropical and subtropical areas, and is increasingly being recorded in temperate regions. It has been found in Australia, Europe, Japan, East and South-east Asia and USA (Falconer and Humpage 2006) but its occurrence has been also reported in cooler regions of the Northern Hemisphere (Neilan et al., 2003;
41 Falconer and Humpage 2006; Vidal and Kruk 2008). This demonstrates a high adaptability and competitive advantage which enabled its rapid expansion in different parts of the globe (Falconer and Humpage 2006). Its high competitiveness in eutrophic environments together with the ability to form blooms and produce toxins make this cyanobacterium the most studied one both in the ecological and public health fields. It has the ability to produce various toxins, such as Cylindrospermopsin (CYN) and saxitoxins (Falconer and Humpage 2006; van Apeldoorn et al., 2007; Fastner et al., 2007; Rucker et al., 2007; Kokocinski et al., 2009; Messineo et al., 2009). CYN is a tricyclic alkaloid that can also be produced by the species Umezakia natans, Aphanizomenon ovalisporum, Aphanizomenon flos-aquae and Aphanizomenon gracile, Anabaena bergii and Anabaena lapponica, Raphidiopsis curvata, Lyngbya wollei (Falconer and Humpage 2006; van Apeldoorn et al., 2007; Fastner et al., 2007; Rucker et al., 2007; Kokocinski et al., 2009; Messineo et al., 2009). CYN and its toxicity to the human population (with inhibition of protein synthesis and causing pathological symptoms in liver, kidneys, spleen, thymus, heart and skin) were first reported in 1979 in Palm Island (Australia) (Kokocinski et al., 2009; Messineo et al., 2009). In the present work, the development of C. raciborskii was significantly correlated with higher levels for conductivity, TSS and Chl a. In Portugal, this species had already been reported in several central and south lakes and reservoirs, showing lethal toxicity in mousse assays (Saker et al. 2003; Codd et al. 2005; Valério et al. 2005). Interestingly, by comparing to data from 2001, our results showed a clear segregation of samples from 2008 suggesting particular environmental conditions at the lake may enhance C. raciborskii growth. These are mainly related to higher levels of TSS, Chl a, conductivity and pH; nutrient concentrations remained very low throughout the year. More, in 2008 there was not a typical seasonality in environmental parameters (as recorded in 2001- de Figueiredo et al. 2006) which may also explain the persistence of this species throughout the study period.
42
5.
General Conclusions
44 The year of 2008 was characterized as a warm and dry year by comparing to the previous data which resulted in higher concentrations of total suspended solids and chlorophyll a. The nutrient levels were undetectable during most of the study period, probably due to the low precipitation levels. The present study allowed us to conclude that, under these conditions, the seasonal succession of phytoplankton community was less coherent with those described from previous works made on this and other eutrophic lakes. Nutrients unavailability can be responsible for the decrease of algal diversity, leaving cyanobacteria as the most competitive phytoplankton group and enhancing the formation of blooms. The high temperatures, generally above 14ºC, also favoured cyanobacterial dominance (particularly by Aphanizomenon flos-aquae) but also showed to be related to an increase in densities of chlorophycean such as Botryococcus spp. and of the diatoms of the genus Aulacoseira. High values for TSS, conductivity and Chl a showed to enhance the development of the cyanobacteria (Aphanizomenon flos-aquae and Cylindrospemopsis raciborskii) but also Aulacoseira spp. and chlorophycean Tetraedron spp. and Pediastrum spp.. The growth of Tetraedron spp. showed to be also promoted by an increase in pH values.
It is known that cyanobacterial abundance can increase during warmer years suggesting that global warming may lead to long term effects on phytoplankton community. This study showed significant environmental differences among 2001 and 2008 samples and, in 2008, there were recorded increased values for Chl a, TSS, pH and conductivity which proved to be important factors behind the enhancement of the development of C. raciborskii blooms. Consequences of cyanobacterial blooms can be extremely severe, depending on the species involved. Further works should evaluate the presence of cyanotoxins at this lake and monitor them. It is also important to verify the responses of cyanobacteria to changing environmental patterns associated to global climate change.
46
6. References
48 Abrantes, N., Antunes, S. C., Pereira, M. J. & Gonçalves, F., 2006. Seasonal succession of cladocerans and phytoplankton and their interactions in a shallow eutrophic lake (Lake Vela, Portugal). Acta Oecologica 29: 54-64. Abrantes, N., Pereira, R., de Figueiredo, D. R., Marques, C. R., Pereira, M. J. &
Gonçalves, F., 2008. A whole sample toxicity assessment to evaluate the sub-lethal toxicity of water and sediment elutriattes from a lake exposed to diffuse pollution. Environmental Toxicology 24(3): 259-270.
Anderson, D. M., Glibert, P. M. & Burkholder, J. M., 2002. Harmful Algal Blooms and Eutrophication Nutrient Sources, Composition, and Consequences. Estuaries 25(4b): 704-726.
Antunes, S. C., Abrantes, N., Gonçalves, F., 2003. Seasonal Variation of the abiotic parameters and the cladoceran assemblage of Lake Vela: comparison with previous studies. Annales de Limnologie 39(3): 255-264. van Apeldoorn, M. E., van Egmond, H. P., Speijers, G. J. A. & Bakker, G. J. I.,
2007. Toxins of cyanobacteria. Molecular Nutrition & Food Research 51: 7-60.
APHA, 2005. Standard methods for the examination of water & wastewater. 21st ed. American Public Health Association, Washington D. C., 3328 pp.
Barros, P., Silveira, S., Ribeiro, R., Gonçalves, F., Vanconcelos, V. & Soares, A. M. V. M., 1993. Estrutura populacional fitoplanctónica nas lagoas das Braças, Vela e Mira (região centro-litoral) resultados preliminares. Boletim UCA 1: 1-18.
Barros, P., 1994. Implicações ecotoxicológicas de cianobactérias em cladóceros. M.Sc. thesis. University of Coimbra. Faculty of Sciences and Technology, Coimbra, 84 pp.
Bourrelly, P., 1968. Les Algues Déau Douce: Initiation à la Systématique. Tome II. N. Boubée & Cie. Paris, 438 pp.
Bourrelly, P., 1970. Les Algues D'Eau Douce. Initiation à la Systematique. Tome III. Ed. N. Boubée & Cie. Paris, 512 pp.
Bourrelly, P., 1972. Les Algues D'Eau Douce: Initiation à la Systématique Tome I. N. Boubée & Cie. Paris, 572 pp.
49 ter Braak, C. J. F., 1986. Canonical correspondence analysis: a new eigenvector
technique for multivariate direct gradient analysis. Ecology 67: 1167-1179. Carmichael, W. W. & Li, R., 2006. Cyanobacteria toxins in the Salton Sea. Saline
Systems 2: 5.
Carneiro, T. G. & Leite, F., 2008. Cianobactérias e as suas toxinas. Revista Analytica 32: 36-41.
Clarke, K. & Gorley, R., 2006. Primer v6: user manual/tutorial. Plymouth, Plymouth Marine Laboratory.
Codd, G. A., 2000. Cyanobacterial toxins, the perception of water quality, and the prioritisation of eutrophication control. Ecological Engineering 16: 51-60. Codd, G. A., Morrison, L. F., Metcalf, J. S., 2005. Cyanobacterial toxins: risk
management for health protection. Toxicology and Applied Pharmacology 203: 264-272.
Danielsen, R., 2009. Dissimilarities in the recent histories of two lakes in Portugal explained by local-scale environmental processes. Journal of Paleolimnology, 22 pp. In press. doi: 10.1007/s10933-099-9348-1
de Figueiredo, D. R., Azeiteiro, U. M., Gonçalves F. & Pereira, M. J., 2004a. Aphanizomenon flos-aquae grow under different nutrient concentrations and the effects of its exudates on growth of two green algae. Fresenius Environmental Bulletin 13(7): 657-664.
de Figueiredo, D. R., Antunes, S. C., Pereira, M. J. & Gonçalves, F., 2004b. Chronic effects of Aphanizomenon flos-aquae on the survival and reproduction of daphnids. Fresenius Environmental Bulletin 13(7): 665-670. de Figueiredo, D. R., Azeiteiro, U. M., Esteves, S. M., Gonçalves, F. & Pereira, M.
J., 2004c. Microcystin-producing blooms - a serious global public health issue. Ecotoxicology and Environmental Safety 59(2): 151-63.
de Figueiredo, D. R., Reboleira, A. S. S. P., Antunes, S.C., Abrantes N., Azeiteiro, U. M., Gonçalves, F. & Pereira, M. J., 2006. The effect of environmental parameters and cyanobacterial blooms on phytoplankton dynamics of a Portuguese temperate lake. Hydrobiologia 568: 145-157.
de Figueiredo, D. R., Pereira, M. J., Moura, A., Silva, L., Bárrios, S., Fonseca, F., Henriques, I. & Correira, A., 2007. Bacterial community composition over a
50 dry winter in meso - and eutrophic Portuguese water bodies. FEMS Microbial Ecology. 59: 638-650.
de Figueiredo, D. R., Alves, A., Pereira, M. J., Correia, A., 2009. Molecular characterization of bloom-forming Aphanizomenon strains isolated from Vela Lake (Western Central Portugal) Journal of Plankton Research: 14 pp. In press. doi: 10.1093/plankt/fbp111
Dittmann, E. & Wiegand, C., 2006. Cyanobacterial toxins - occurrence, biosynthesis and impact on human affairs. Molecular Nutrition & Food Research 50: 7-17.
Dokulil, M. T. & Teubner, K., 2000. Cyanobacterial dominance in lakes. Hydrobiologia 438: 1-12.
Domis, L. N. S. & Mooij W. M., 2007. Climate-induced shifts in an experimental phytoplankton community: a mechanistic approach. Hydrobiologia 584: 403-413.
Downing, J. A., Watson, S. B. & McCauley, E., 2001. Predicting cyanobacteria dominance in lakes. Canadian Journal of Fisheries and Aquatic Sciences 58: 1905-1908.
Druart, J. C. & Briand, J. R., 2002. First record of Cylindrospermopsis raciborskii (Woloszynska) Seenayya et Subba Raju (Cyanobacteria) in a lotie system in France. Annales de Limnologie 38(4): 339-342.
Erdner, D. L., Dyble, J., Parsons, M. L., Stevens, R. C., Hubbard, K. A., Wrabel, M. L., Moore, S. K., Lefebvre, K. A., Anderson, D. M., Bienfang, P., Bidigare, R. R., Parker, M. S., Moeller, P., Brand, L. E. & Trainer, V. L., 2008. Centers for Oceans and Human Health: a unified approach to the challenge of harfuml algal blooms. Environmental Health 7(2). In press. doi:10.1186/1476-069X-7-S2-S2
Falconer, I. R. & Humpage A. R., 2006. Cyanobacterial (Blue-Green algal) toxins in water supplies: Cylindrospermopsins. Environmental Toxicology 21(4): 299-304.
Fastner, J., Rücker, J., Stuken, A., Preussel, K., Nixdorf, B., Chorus, I., Kohler, A: & Wiedner, C., 2007. Occurrence of the cyanobacterial toxin
51 cylindrospermopsin in northeast Germany. Environmental Toxicology 22(1): 26-32.
Fernandes, M. J. S., 1999. Modelação e Simulação nas lagoas de Quiaios. Ph.D. thesis. University of Algarve, Faro.
Ganf, G. G., 1974. Diurnal mixing and the vertical distribution of phytoplankton in a shallow equatorial (Lake George, Uganda). Journal of Ecology 62: 611-629. Germain, H., 1981. Flore des diatomées. Diatomophycées d'éaux douces et
saumâtres du Massif Armoricain et des contrées voisines de l'Europe occidentale. Boubée Éditions. Paris.
Gonçalves, F., Ribeiro, R., Vasconcelos, V. & Soares, A. M. V. M., 1996. Anthropogenic influences on seasonal changes of nutrients, physical and chemical factors in three coastal freswater shallow lakes (Portugal). Limnetica 12(2): 47-52.
Gonçalves, A. M. M., de Figueiredo, D. R. & Pereira, M. J., 2005. A Low-Cost methodology for algal growth inhibition tests using three freshwater green algae. Fresenius Environmental Bulletin 14(12): 1192-1195.
Havens, K. E., James, R. T., East, T. L. & Smith, V. H., 2003. N:P ratio, light limitation, and cyanobacterial dominance in a sobtropical lake impacted by non-point source nutrient pollution. Environmental Pollution 122: 379-390. Hawkins, P. R., Runnegar, M. T. C., Jackson, A. R. & Falconer, I. R., 1985.
Severe hepatotoxicity caused by the tropical Cyanobacterium (Blue-Green Alga) Cylindrospermopsis raciborskii (Woloszynska) Seenaya ans Subba Raju isolated from a domestic water supply reservoir. Applied and Environmental Microbiology 50(5): 1292-1295.
Herrero, A. & Flores, E., 2008. The Cyanobacteria: Molecular Biology, Genomics and Evolution. Portland, Caister Academic Pres, 514 pp.
Hu, W., Connel, D., Mengersen, K., Tong, S., 2009. Weather variability, sunspots, and the blooms of cyanobacteria. EcoHealth 6(1): 71-78.
Jochimsen, E. M., Carmichael, W W., An, J., Cardo, D. M., Cookson, S. T., Holmes, C. E. M., Antunes, M. B., de Melo Filho, D. A., Lyra, T. M., Barreto, V. S. T., Azevedo, S. M. F. O. & Jarvis, W. R., 1998. Liver failure and death
52 after exposure to Microcystis at a hemodialysis center in Brazil. The New England Journal of Medicine 338(13): 873-878.
Kemka, N., Njiné, T., Togouet, S. H. Z., Menbohan, S. F., Nola, M., Monkiedje, A., Niyitegeka, D. & Compère, P., 2006. Eutrophication of lakes in urbanized areas: The case of Yaounde municipal Lake in Cameroon, Central Africa. Lake & Reservoirs: Research and Management 11: 47-55.
Kokocinski, M., Dziga, D., Spoof, L., Stefaniak, K., Jurczak, T., Mankiewicz-Boczek, J. & Meriluoto, J., 2009. First report of the cyanobacterial toxin cylindrospermopsin in the shallow, eutrophic lakes of western Poland. Chemosphere 74: 669-675.
Komárek, J. & Fott, B., 1983. Das phytoplankton des Süsswassers, Systematik und Biologie. 7. Teil, 1. Hälfte, Chlorophyceae (Grünalgen). Ordnung: Chlorococcales. Scweizerbart'sche Verlagsbuchhandlung, Stuttgart.
Komárek, J. & Anagnostidis, K., 1989. Modern approach to the classification system of cyanophytes - 4 - Nostocales. Archives of Hydrobiology (Supplement 82): 247-345.
Kurmayer, R. & Christiansen, G., 2009. The genetic basis of toxin production in Cyanobacteria. Freshwater Reviews 2: 31-50.
Lopes, A. R., Azeiteiro, U. M., Bessa, V. S., Pereira, C., Salvador, S., Almeida, A., Cunha, M. A. & Pereira, M. J., 2009. Spring pelagic communities of phytoplankton, cyanobacteria, associated heterotrophic bacteria and viruses in an eutrophic shallow temperate lake. Fresenius Environmental Bulletin 18(5b): 875-884.
López-Archilla, A. I., Moreira, D., López-García, P. & Guerrero, C., 2004. Phytoplankton diversity and cyanobacterial dominance in a hypertrophic shallow lake with biologically produced alkaline pH. Extremophiles 8: 109-115.
Lund, J. W. G., Kipling, C. & Le Cren, E. D., 1958. The inverted microscope method of estimating algal numbers and the statistical basis of estimations by counting. Hydrobiologia 11(2): 143-170.
53 Mankiewicz, J., Tarczynska, M., Walter, Z., & Zalewski, M., 2003. Natural toxins from cyanobacteria. Acta Biologica Cracoviensia (Series Botanica) 45(2): 9-20.
Messineo, V., Melchiorre, S., Di Corcia, A., Gallo, P., Bruno, M., 2009. Seasonal succession of Cylindrospermopsis raciborskii and Aphanizomenon ovalisporum blooms with cylindrospermopsin occurrence in the volcanic Lake Albano, Central Italy. Environmental Toxicology 1-10. doi 10.1002/tox.20469
Miranda, L. E., Hargreaves, J. A., Raborn, S. W., 2001. Predicting managing risk of unsuitable dissolved oxigen in a eutrophic lake. Hydrobiologia 457: 177-185.
Nauwerck, A., 1960. Zur Systematik und Okologie portugiesischer Planktonalgen. Boletim da Sociedade Broteriana Xi: 7-56.
Neilan, B. A., Saker, M. L., Fastner, J., Torokné, A., Burns, B. P., 2003. Phylogeography of the invasive cyanobacterium Cylindrospermopsis raciborskii. Molecular Ecology 12(1): 133-140.
Palus, J., Dziubaltowska, E., Stanczyck, M., Lewínska, D., Mankiewicz-Boczek, J., Izydorczyk, K., Bonislawska, A., Jurczak, T., Zalewski, M. & Wasowicz, W., 2007. Biomonitoring of cyanobacterial blooms in Polish water reservoir and the cytotocity and genotocity of selected cyanobacterial extracts. International Journal of Occupational Medicine and Environmental Health 20(1): 48-65.
Paul, V. J., 2008. Global warming and cyanobacterial harmful algal blooms.Cyanobacterial harmful algal blooms: State of science and research needs. Vol. 619. Ed. Hudnell, H. Kenneth, 950 pp.
Pearson, K., 1901. Principal Components Analysis. The London, Edinburgh and Dublin Philosophical Magazine and Journal 6(2): 566.
Reynolds, C. S., Reynolds, S. N., Munawar, I. F. & Munawar, M., 2000. The regulation of phytoplankton population dynamics in the world's largest lakes. Aquatic Ecosystem Health and Management 3: 1-21.
Rodier, J., 2005. L'analyse de L'Eau: Eaux naturelles, Eaux résiduaires, Eau de mer. 8ed, Dunoud, Paris, 1384 pp.