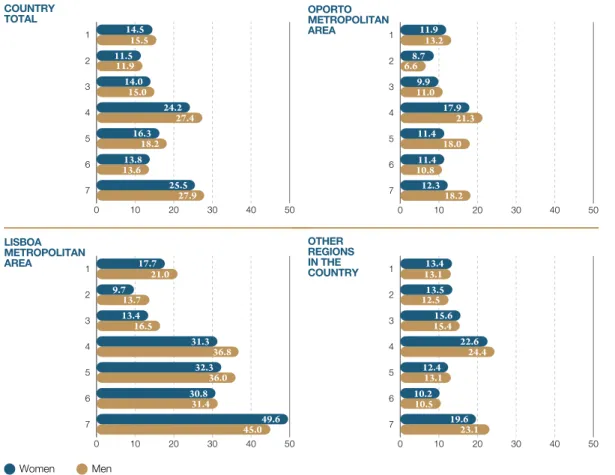
The Use of Time by Men and Women in Portugal
Texto
Imagem


Documentos relacionados
É ainda objetivo (3º) desta dissertação explanar e avaliar a abordagem socioeconómica da Colónia do Sacramento, com vista à compreensão da estrutura demográfica e
A análise dos dados permite concluir que tan- to os idosos ativos como os sedentários apresen- taram relatos de presença de dor equiparados em quantidade; contudo, entre os
O trabalho artístico realizado em contextos prisionais - os atores sociais em interação sobre o seu território (a instituição total) - as relações entre os grupos de reclusos e
22A 2001/01/02, resina epox´ıdica Bison Combi-Rapid nos dois lados maiores com a amostra em cima de papel branco, cura na estufa a 54 graus durante mais de uma hora.. 2001/01/09
Resultados: O presente estudo demonstrou que o antagonista do MIF (p425) diminuiu significativamente proteinúria, excreção urinária de GAGs , relação proteína/creatinina na
The second section is devoted to the role of purines on the hypoxic response of the CB, providing the state- of-the art for the presence of adenosine and ATP receptors in the CB;
ProSight PC (Thermo Scientific) is one of the most used tool that performs three distinct types of search: (1) absolute mass, similar to a PSM search with large toler- ance window
FEDORA is a network that gathers European philanthropists of opera and ballet, while federating opera houses and festivals, foundations, their friends associations and
