Mudge, M.; Malzbender, T.; Schroer, C. & Lum, M. (2006) - New
Reflection Transformation Imaging Methods for Rock Art and
Multiple-Viewpoint Display. In Ioannides, M.; Arnold, D.; Niccolucci, F. & Mania,
K., eds., The 7th International Symposium on Virtual Reality,
Archaeology and Cultural Heritage, VAST, Nicósia, Cyprus, November
4, 2006.
New Reflection Transformation Imaging Methods for Rock
Art and Multiple-Viewpoint Display
Mark Mudge,+ Tom Malzbender,* Carla Schroer,+ Marlin Lum+
+
Cultural Heritage Imaging, San Francisco, California USA
* Hewlett-Packard Laboratories, Palo Alto, California USA
Abstract
We offer two new methods of documenting and communicating cultural heritage information using Reflection Transformation Imaging (RTI). One imaging method is able to acquire Polynomial Texture Maps (PTMs) of 3D rock art possessing a large range of sizes, shapes, and environmental contexts. Unlike existing PTM capture methods requiring known light source positions, we rely on the user to position a handheld light source, and recover the lighting direction from the specular highlights produced on a black sphere included in the field of view captured by the camera. The acquisition method is simple, fast, very low cost, and easy to learn. A complementary method of integrating digital RTI representations of subjects from multiple viewpoints is also presented. It permits RTI examination “in the round” in a unified, interactive, image-based representation. Collaborative tests between Cultural Heritage Imaging, Hewlett-Packard Labs, and the UNESCO Prehistoric Rock-Art Sites in the Côa Valley, a World Heritage Site in Portugal, suggest this approach will be very beneficial when applied to paleolithic petroglyphs of various sizes, both in the field and in the laboratory. These benefits over current standards of best practice can be generalized to a broad range of cultural heritage material.
The 7th International Symposium on Virtual Reality, Archaeology and Cultural Heritage VAST (2006)
M. Ioannides, D. Arnold, F. Niccolucci, K. Mania (Editors)
1. Introduction
Paleolithic rock art is among the earliest surviving examples of humanity’s cultural heritage (CH). For millennia, the heirs of these ancient rock carvers have added their strokes on stone to our collective legacy. These works are found throughout the world.
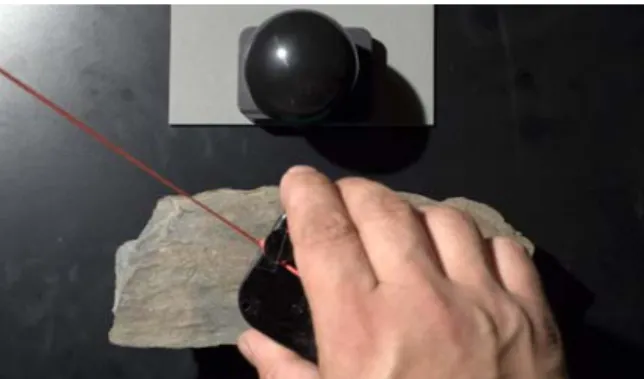
Figure 1: Highlight RTI method
We will first review the state of current CH documentary best practices for rock art and related fields. Next, we will explore test uses of techniques that capture the 3D geometry and textures of rock art. Following a brief description of Reflection Transformation Imaging (RTI) and one of its chief tools, Polynomial Texture Maps (PTMs), we will survey its previous use and advantages in CH contexts with an eye towards potential advantages in rock art. Existing
methods of PTM capture using known light positions will be evaluated and approaches for building PTMs without known light positions investigated. These investigations will suggest a new tools and methods set called “Highlight RTI.” We will examine how Highlight RTI brings powerful and practical new tools to the study of ancient rock art and how these benefits can be generalized to the fields of epigraphy, sculpture, and other areas of CH work, when materials have significant surface information. We will also see how PTM Object Movies can greatly extend the documentary power, remote ability for interactive scholarly examination, and public access to non-planar CH objects with surface relief. 2. Evaluation of Current Documentary Best Practice in Rock Art and Related Fields.
There is extensive literature regarding the established techniques employed in the documentation of rock art. Despite knowledge of the experimental use of 3D geometry-based imaging methods discussed in section 3, most current CH best practices at the beginning of the 21st-century still rely on the essentially 19th-century methods of hand-drawn graphics and conventional, including digital, photographs. This is especially true of rock art documentation and management.
The limitations of drawings and photographs have been broadly discussed. Among the most significant are the editorial decisions of the draftsperson or photographer to
M. Mudge, T. Malzbender, C. Schroer, M. Lum / New RTI Methods for Rock Art and Multiple-Viewpoint Display
record some elements of the empirical data presented by the subject and exclude others. This is obvious in drawing and is present in photography due to illumination choices in image composition. This problem is understood by epigraphic photographers who decipher inscriptions. They recognize that lighting direction significantly determines the content of the empirical data set recovered. To partially mitigate this problem, they capture multiple images of the subject from the same point of view using different illumination directions to increase the amount of available data [Zuc04]. The incomplete nature of rock art drawing and photography data makes them insufficient to track the effects of natural destructive processes [BCD*05] [FER06] and human contact. Rock art is found in 3D rather than 2D contexts. This 3D context is important to its understanding and is poorly communicated in drawings and photographs. 3. Experimental Acquisition of 3D geometry in Rock Art
Lasers have been used in many CH applications. In the United Kingdom, their use has been demonstrated to benchmark rock art geometry in order to monitor future degradation as part of an integrated management system [BCD*05].
Since 1979 [TWDM79], extensive literature has described numerous applications of photogrammetry to capture 3D geometry in archaeology and rock art around the world. In the United States for example, Federal researchers are looking for simple and inexpensive ways to incorporate these tools into standard documentary practices for rock art and paleontological material on public lands [MN06]. In Europe, photogrammetry-based tools using uncalibrated, handheld photographs and video to generate 3D geometry of CH materials are being explored [MURweb]. A new EPOCH service that accepts a set of such photographs of a single side of a CH object and returns 3D geometry shows promising results [EPOCHweb].
Photometric stereo has been investigated to capture 3D geometry of surface relief materials [EPD04,]. It has also been used, in combination with RTI enhancement, to capture single views of cuneiform tablets [WVM*05].
There are a number of reasons for the slow rate of adoption of these new technologies using 3D geometry in CH. The capture and manipulation of 3D geometry require technologically demanding skill sets outside of those present in most professional rock art and archaeological working cultures. Further, communication and visualization of high-resolution 3D geometry over the Internet is problematic. 4. Use of RTI in Cultural Heritage
The use of image-based RTI documentation avoids many of the problems associated with 3D geometry.
RTI was first developed for use in association with PTMs by Malzbender et al in 2001 [MGW01]. In summary, PTMs are an image-based representation of the appearance of a
surface under varying lighting directions. Per-pixel surface normals are extracted from the representation, and can be used for not only changing lighting direction interactively, but also performing enhancements to make surface detail more visible. Transformations of these captured reflectance functions, in particular RTI, have been found to be useful. Unlike photometric stereo, RTI information is communicated without the use of 3D geometry, eliminating 3D geometry’s associated requirements and costs.
The use of RTI with PTMs in CH documentation projects, the natural sciences, and law enforcement as well as other Image Based Re-lighting (IBRL) applications has been detailed extensively elsewhere, including [MGW01] [Zuc04] [Mud04] [MVSL05] [MS06] [MO05] [HPLweb] [CHIweb].
This work has demonstrated that RTI with PTMs brings significant advantages to CH activities. These advantages include: non-contact acquisition of data, clear representation of 3D shape characteristics through interactive viewing tools, data discernment improvements over direct physical examination through RTI enhancement functions, no data loss due to shadows and specular highlights, high resolution sample densities up to 20,500 per square millimeter, automatic determination of the most informationally rich illumination directions, simple and achievable image creation processing pipeline, and easy online communication.
In spite of these major advantages over current practice, the bottleneck slowing the adoption of this technology by CH professionals has been existing PTM capture methods. Our new methods described in sections 7 and 8 should remove many of these impediments.
5. Advantages and Limitations of Existing PTM Capture Hardware.
Existing methods of PTM capture all rely on a prior knowledge of the light positions that will be used to illuminate the imaging subject. This knowledge is encapsulated either in a physical equipment structure such as those used by Hewlett-Packard Labs and Cultural Heritage Imaging [MGW01] [MS06] or an instructional template that gives directions for the placement of free-standing lights in pre-determined locations [MVSL05].
The use of fixed-light position equipment has many advantages. Automatic control of lights and camera can acquire a PTM with great speed, frequently between five and fifteen minutes. These efficiencies are valuable when large numbers of objects must be captured. This equipment also can support the optics for controlled wavelength imaging of photonically fragile cultural artifacts [MS06].
Fixed-light position equipment also has attributes which limit its use. The light distance from the subject limits the subject’s maximum size. This ratio between light radius and object diameter, approximately 3:1 in existing designs, requires that bigger subjects require proportionately larger
light distances. As equipment size increases, light power needs, structural requirements, transport difficulties, and costs increase. In the past, this has limited PTM work to smaller objects. Many cultural heritage materials are found in locations that contain obstructions that prohibit encapsulation by fixed-light hemispheric structures. Further, PTM equipment has been expensive and only available through custom fabrication.
Pre-determined templates or on-site measurement of light positions have the potential to capture larger objects and work around obstructions, but also have limitations. They require time to pre-plan and transfer to the site. Careful positioning of light stands according to the template is also time-consuming. In situations where the floor or ground is irregular such as a natural environment, implementation of a template solution becomes extremely complicated and time-consuming. Locations on the ground and height offsets must be calculated without the benefit of simple planar measurements and may require surveying techniques to adapt the template to the topography.
6. Determination of Light Positions for PTMs
In our method, unlike traditional RTI approaches, the 3D locations of the lights used to construct the RTI need not be known or determined at the time the photographic images are recorded. Our RTI acquisition method manages light intensity fluctuations due to changing light subject distances and captures the necessary information about the light’s incident direction.
6.1 Background Considerations
To build an RTI image, the direction of the incident illumination must be known. If the direction is known, and the radius of the light to the subject remains constant, the actual distance value of the radius need not be known. Once the direction of the incident illumination is accounted for, this permits variations in pixel intensity over the subject to be understood as indicating variations in the normal directions and albedo of the underlying surface, not light distance. In past RTI capture equipment and methods, the distance of the light to the subject remained constant by virtue of a prior decision, either in the form of mechanical design or positioning template, constraining the positions of the lights to the geometry of hemispheres or arcs. Without this prior knowledge, if variations in radius are present in the input photographs, they must be managed in order to avoid misinterpreting pixel intensity changes due to changes in light distance as due to the subject’s surface features, thereby introducing errors into the normal calculations.
When changes of light source radius are introduced intentionally, these corrections in illumination intensity can be made during the acquisition session by increasing or decreasing the light source brightness at the same time as the radius change. The parameters of these required light power adjustments for distance are well understood and can
be looked up in “cheat sheets”, covering the distances likely to be encountered. The illumination radius can then be varied for subsets of images during a capture session according to site conditions, for example, shortened to avoid obstructing objects. For example, when the subject is close to the ground and the ground plane acts as an obstruction, adjustments to the illumination radius can be highly advantageous to increase the sampled light directions.
In theory, changes of light source radius could also be recorded automatically at the time of photographic image capture or be extracted later during post-processing. The subsequent illumination variations could then be corrected by adjusting pixel luminance levels
In practice, the limited dynamic range of the camera sensor and the requirement to achieve good exposures of the subject significantly restrict such post-acquisition pixel luminance adjustment options.
The best exposure for a given RTI subject is determined iteratively by checking test images captured at the extremes of the desired range of incident light inclinations. The goal of a successful exposure is to capture as much signal (light) as possible while avoiding under- and over-exposure at these extremes.
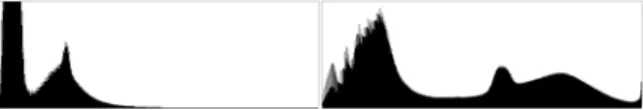
As the following histograms from the image set used to build the PTM in Figure 8 indicate, the entire usable exposure range is bracketed by the 2 images at the inclination extremes. In fact, images from the 4 highest inclinations were excluded from the input set due to over-exposure.
Figure 2: PTM input image histograms from low-and high-incident light angles.
As changes in light source radius lead to geometric increases or deceases of light intensity, the range of light source radius variation, uncorrected by light power adjustment, is very limited without image loss due to improper exposure. This limitation curtails the ability of post-processing methods that adjust pixel luminance levels to successfully correct for these changes. Even when all images are photographed in 12-to-14-bit-per-color channel RAW mode, which has greater dynamic range than in camera compressed 8-bit-per-color channel images, and exposure compensation is performed prior to conversion to 8-bit mode, signal-to-noise ratio concerns reduce the desirability of these operations.
Perhaps most importantly, given that estimations of proper exposure parameters for a given subject and environment are subject to operator error and that the consequences of these errors are potentially costly, reservation of RAW mode exposure compensation margins to permit recovery of these mistakes is highly desirable.
M. Mudge, T. Malzbender, C. Schroer, M. Lum / New RTI Methods for Rock Art and Multiple-Viewpoint Display
6.2 Evaluation of Light Source Radius Management Techniques
We explored 3 methods of light source radius management; a laser range finder, measurement of highlight intensity from a black ball, and a string marked to known lengths.
A Leica Disto laser range finder was tested during field capture of petroglyphs in Portugal. The Disto was secured to a small ball head mounted on a bar next to the light and could be pointed and locked in the desired orientation. The center of the subject imaged in the camera was identified and a distance reading taken to position the handheld light at the radius appropriate to the illumination power setting.
We found that positioning the light within 10cm of the stipulated 250cm radius took an average of five readings and considerable time. It was also hard to use if the light was held overhead or near the ground. The Disto added weight to the light setup and significant cost.
Capturing the intensity of a black ball highlight for potential use in post processing to compensate for light source radius variations was explored. The contrast ratios between the black ball highlights and normally exposed RTI subjects exceed the single image dynamic range of today’s digital cameras. To avoid data loss of the highlight intensity data due to clipping from over-exposure, a 6 stop under-exposure was needed to extract the relative highlight intensity information. This required the use of a 3 image exposure bracketing sequence.
As the PTM process requires multiple input images, we found that the tripling of capture data this process entailed was a serious disadvantage.
A string marked at known distances was also tested. One end of the string is tied to the light source, operated by one person, and the other end is held by another person adjacent to the center of the subject. The light distance is measured, the light held steady, the string moved out of the image area, and the photo taken. The radius can be changed during the session by changing the string length.
The string, nicknamed “The Egyptian Method,” became our favored light source radius management method. The string has many comparative advantages. It is intuitive and easy to learn. It is fast. Once camera configuration is complete, 60 PTM photographs can be captured in 20 minutes. With a handy chart of distance-dependent light power values, changing the string length and light power at the same time is simple and easy to remember.
6.3 Previous Image-Based Relighting Work
The use of spheres to collect lighting direction of a handheld light source for the purposes of image based relighting was first introduced by Vincent Masselus et al. in [MDA02]. In Masseulus’s approach, 4 diffuse white spheres are placed in the field of view surrounding the object in question. Two synchronized cameras are used, one which is
focused on the object being photographed, and the second, with a larger field of view, that captures images of the spheres as well. Since the spheres themselves are diffuse, a slowly varying Lambertian model is fit to the sphere surface to recover the lighting direction.
In our approach we use a single highly specular black sphere which returns a high-contrast highlight that is very easy to detect and localize. In addition, we employ only a single camera that captures both the highlight location (and thus light direction), as well as the surface being studied.
More similar to our approach is that of Paul Debevec’s group in reconstructing archaeological inscriptions, which is briefly described in [EPD04]. Two glossy black spheres and the subject are imaged in a single photograph, light vectors are extracted from highlight positions and intersected. 7. Lighting Direction from Highlight Locations
To avoid using an elaborate light stage [DHT*00] [MGW01] with known light source positions, we rely on the user to position a handheld light source, and recover the lighting direction from the specular highlights produced on a black sphere included in the field of view captured by the camera. Since the specular highlights can be of higher brightness than that of the rest of the illuminated scene, we need to be careful to limit the amount of saturation so as not to hamper our estimation of the center of the highlight location. Currently we allow some of these highlight pixels to be saturated, giving priority to the exposure of the scene itself. Manually estimating the position of the center of each highlight is still practical in this circumstance. In the future we hope to be able to automatically detect the sphere in all the images, and extract its radius along with the location of the center of the highlight automatically. Note that since the camera is stationary for every photograph, the location of the sphere remains constant, and this appears feasible to extract.
Given a specific photograph we solve for the unknown light direction, L, referring to Figure 3. We assume the distance to the camera and lights is large with respect to the object geometry to simplify the solution. First we measure (in pixel coordinates) the center (Cx,Cy) and radius, r, of the sphere and the position of each highlight center (Hx,Hy). We then normalize the highlight location to span (-1,1) by:
Thus the normal vector is given by:
Performing a Cartesian to polar conversion, the inclination of the surface normal, Φ, is seen as:
Since the inclination of the light source,ΦL, is simply the inclination of the normal Φ, it is just:
For y>0, the other angle of the light source in spherical coordinates is seen as:
So, the normalized light vector, L, is given by:
These light vectors, one for each photograph taken, can now be used to construct a PTM, allowing subsequent enhancements.
Figure 3: Estimating lighting direction from a highlight location on the surface of a glossy sphere assuming a distant camera. V is the view vector pointing to the camera, N is the surface normal, L is the unknown, normalized light vector we solve for. 8. Work Tools and Methods
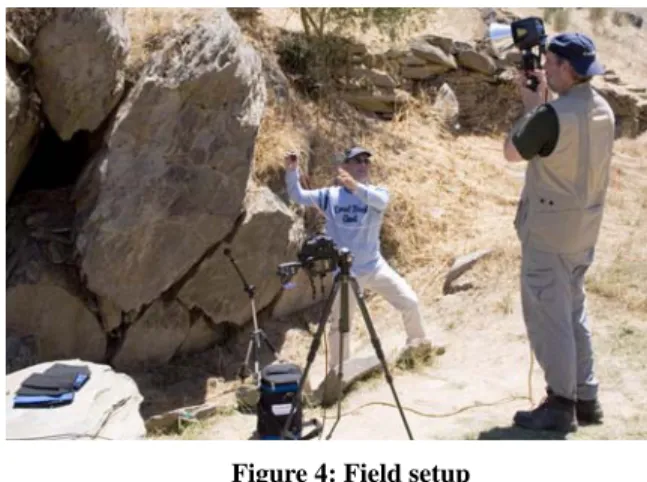
The field kit contains: a SLR digital camera; a configurable selection of light-reducing neutral density filters; computer with remote camera control software and Photoshop for evaluating images; tripods; radio flash trigger; 1 to 1/32 power adjustable 320 watt second flash with battery pack; black ball on length and angle adjustable boom; measuring tape; and retractable surveyors plumb-bob string (bob removed). An intensity-adjustable continuous light may also be used if sufficient power is available.
Ambient light is excluded using the neutral density filters. Some ambient light is excluded by a narrow aperture, usually f/11 to f/16, dictated by depth of field and image sharpness considerations and relatively fast shutter speed for
flash synchronization, usually 1/180th of a second. The filters are added in the strength necessary to remove any significant levels of remaining light. Subsequently, the only light reaching the sensor during image acquisition comes from the flash. The light source used was an inexpensive, mid-power, studio light costing $300. It was sufficient to provide more than enough light, even shooting in full sun at midday. The blackball is placed next to, but not touching, the subject. The image is composed to maximize the number of available pixels on the subject. The operators capture test images verifying ambient light exclusion, focus, depth of field, and exposure. Images are captured in RAW format. A data set of at least 60 images is collected using different light locations. The selection is biased towards the first 60 degrees of inclination from the “horizon.”
Figure 4: Field setup
During image processing, any lens distortion is corrected. The black ball’s pixel radius, and center in (X,Y) pixel coordinates are determined. The light’s highlight center coordinates on the ball in each image are collected. This information is placed in a text file that is given to the Highlight to Light Position (HLT-LP) software and a Light Position “.lp” file is generated. Remaining processing is done according to standard PTM processing procedures.
At the end of the process, an archive is created for each PTM, including RAW data, Photoshop actions, xmp files, HLT files, .lp files, PTMFitter command syntax, and descriptive text enabling interested parties to review the image processing steps employed to build it. This information can be used for confirmatory replication. In this way, the quality of each PTM image can be independently assessed.
9. PTM Object Movies
PTM Object Movies (POMs) synthesize individual PTMs into an integrated, interactive representation.
9.1 The PTM Object Movie Viewer
The PTM object movie (POM) viewer software takes as input a text file indicating the number of individual PTM
M. Mudge, T. Malzbender, C. Schroer, M. Lum / New RTI Methods for Rock Art and Multiple-Viewpoint Display
images used per inclination angle row, the number of rows, and their identifying absolute pathnames. It then assembles them using established object movie creation operations and displays them in our new viewer. Unlike traditional object movies, when a specific point of view is selected, the user may employ a menu of standard RTI enhancement functions to disclose the subject’s 3D surface features.
9.2 PTM Object Movie Tools and Methods
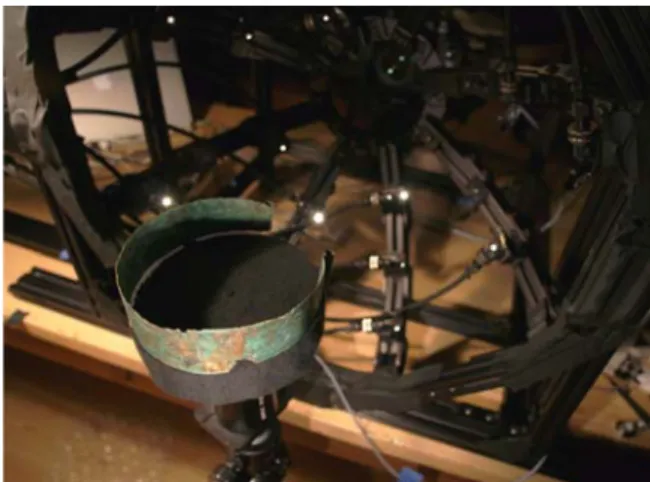
For the single row POM presented here, we used the automatic PTM acquisition structure in Figure 5 [MS06]. This structure also possesses a detachable module, not shown, that permits manual vertical inclination adjustment. The subject was rotated around the camera image’s Y axis using a programmable electronic object movie/panorama stage from Seitz Phototechnic. The stage platform was custom built to create a top face edge profile with size and shape characteristics identical to the subject’s size and shape. This prevents shadowing of the subject by the platform when the incident light comes from below the platform.
Figure 5: POM setup
The tools and methods of acquiring input images closely resemble the procedures for making normal single and multi-row object movies. As in the traditional technique, the subject is sampled by capturing individual PTMs at regular rotational intervals while maintaining a constant camera-to-subject radius. While light position imaging is introduced into the process, much of the process and equipment design strategy used in normal object movie camera location is applicable.
The highlight PTM equipment may also be used to capture the PTMs used to build a POM. As with normal object movies, when using the Highlight PTM technique, the camera positions used to photograph the input PTMs require management to ensure constant viewpoint sampling increments and camera-to-subject distance. This can be accomplished using a predetermined template or calculating the correct camera position during capture and is subject to the time and complexity issues described previously. The
precision needed in these calculations is determined by focus depth of field, and the user’s aesthetic tolerance of subject size and orientation irregularities in the POM. 10. Results
With the help of our Portuguese collaborators at the Parque Arqueologico do Vale do Côa (PAVC), Centro Nacional de Arte Rupestre (CNART), and the Universidade do Minho, we captured five PTMs reflecting a sample of the different types of rock art at the site.
Figure 6: PTM image of Penascosa Roche 5B, depicting paleolithic animation techniques.
The subject of Figure 6 was created during the Magdalenian period. It shows a left-facing goat profile with the head and neck ‘animated’ to indicate both forward- and backward-looking orientations [Bap99].
The data set images captured a 68cm by 46cm area on the rock face. Given the 4096-by-2704 pixel image resolution, 3D surface normal information was recorded every 166 microns or 36 samples per square millimeter. The final image was cropped to represent an area 45cm square. The session lasted 105 minutes, including equipment set up, tear down, and image testing. Photography of the 60 varying light direction images in the set took 30 minutes. The session took place between 12:00 noon and 1:45pm on a sunny, cloudless day. The PTM clearly demonstrates the success of ambient light exclusion using neutral density filter combinations.
Figure 7 shows two areas selected from Figure 6. The specular enhancement applied to Figure 7 shows the temporal sequence of two intersecting engraved lines. The diagonal line describing the dorsal profile of the forward facing goat head was clearly cut through the more horizontal
line. This establishes the goat engraving as younger than the horizontal line engraving.
Figure 7: The engraving sequence
The subject of Figure 8 is 18cm wide and the PTM sampled 3D normal information every 65.7 microns or 231 times per square millimeter. The tiny petroglyph featured is only 3.1cm in length and hard to see, both in photographs and during direct physical examination.
Figure 8: A very small and fine drawing from a stone used as portable art. It was found during an archaeological excavation at the PAVC in 1999 and was in the context of other evidence of Magdalenian human habitation.
In contrast, RTI imaging functions permit discernment of the most difficult to see surface attributes. The petroglyph-rich front and back of the stone and the engraved face of a second similar stone were imaged during a single day by the professional staff from Portuguese Centro Nacional de Arte Rupestre. After set up and imaging tests, the PTM data capture of 60 images for each of the 3 sets averaged 20 minutes. Under our initial supervision, the local team
conducted the entire capture session for the 3 data sets after only a half day of instruction in the Highlight PTM method. As we gave them a black ball and their existing inventory of photographic equipment included everything necessary to capture Highlight PTMs, there was no equipment start up cost.
Figure 9 shows different views of the subject as seen in the POM Viewer. The subject is a Bronze Age Torque in the collection of the Congregation of the Grand St. Bernard in Switzerland. It was worn around the neck of a person buried sometime between the 20th and 16th centuries BCE. It displays fine and intricate engraving over its entire exterior surface. This continuous abstract geometric design can be followed all around the circumference of the torque and examined at any position using RTI enhancement.
Figure 9: Multiple RTI views of an object The subject can be interactively rotated in the POM viewer and the lighting changed as desired by the user.
11. Conclusions and Future Work
The Highlight PTM method is able to acquire Polynomial Texture Maps (PTMs) of 3D rock art possessing a large range of sizes, shapes, and environmental contexts. The acquisition method is simple, fast, very low cost, and easy to learn. Our experiences working with our collaborators at CNART proved that learning the Highlight PTM technique takes less than a day. The simple, intuitive character of the method focuses the attention of the acquisition team on getting the proper photographic exposure at the time of capture.
The POM tools permit RTI examination of CH material “in the round’” in a unified, interactive, image-based representation. POMs offer a powerful new approach to virtually communicate the complete 3D shape and surface information of CH materials without reliance on full reconstruction of 3D geometry and associated processes.
Future work includes fully automating Highlight PTM post processing and mapping the full PTM and POM image generation process history to the CIDOC Conceptual
M. Mudge, T. Malzbender, C. Schroer, M. Lum / New RTI Methods for Rock Art and Multiple-Viewpoint Display
Reference Model. Additional functions will be added to PTM viewing tools that will more fully adapt them to the normal workflow of the CH professional that will use them. These functions will include the ability to make drawings on top of PTM images while panning and zooming. They will also feature the ability to output RTI-enhanced images and image sequences in a variety of formats.
12. Acknowledgements
We wish to thank our collaborators: Antonio Martinho Baptista, Alexandra Cerveira Lima, Luis Paolo Santos, Alberto Proenca, Friar Luis Proenca, Manuel Almeida, Luis Luis, Andre Tomas Santos and Chanoine Jean-Pierre Voutaz. Thanks to Hewlett-Packard Labs and the Cultural Herititage Imaging Board of Directors, contributors, and volunteers for support of this work.
13. References
[Bap99] Baptista, A. M., 1999. No tempo sem tempo: A arte
dos cacadores paleoliticos do Vale do Côa, Centro
Nacional de Arte Rupestre e Autor. ISBN: 972-98121-0-1.
[BCD*05] Barnett, T., Chalmers A., Díaz-Andreu M.,. Ellis G, Longhurst P., Sharpe K., Trinks I., 2005. 3D Laser Scanning For Recording and Monitoring Rock Art Erosion, International Newsletter on Rock Art (INORA) 41: 25-29.
[CHIweb1]http://c-h-i.org/examples/ptm/ptm.html
[DHT*00] Debevec, P., Hawkins, T., Tchou, C., Duiker, H., Sarokin, W., Sagar, M., 2000. Acquiring the Reflectance Field of a Human Face, Proceedings of Siggraph 2000, pp. 145-156.
[EPD04] Einarsson, P., Hawkins, T., Debevec, P., 2004. Photometric Stereo for Archeological Inscriptions,
Siggraph Sketch.
[EPOCHweb] EPOCH 3D Webservice. http:// homes.esat.kuleuven.be/~visit3d/webservice/html/ [Fer06] Fernandez, A. P. B., 2006. Understanding an Unique
Conservation Work Environment: The Case of the Côa Valley Rock Art Outcrops. Theory and Practice in
Conservation: A Tribute do Cesare Brandi (Proceedings of the International Seminar), Rodrigues, J. D., Mimoso,
J. M., eds. Lisboa: Laboratório Nacional de Engenharia Civil, p. 323-332.
[HPLweb] http://www.hpl.hp.com/research/ptm/
[MDA02] Masselus, V., Dutre, P., Anrys, F., 2002. ”The Free-form Light Stage”, Eurographics Workshop on
Rendering, Pisa, Italy, June 26-28, 2002.
[MGW01] Malzbender, T., Gelb, D., and Wolters, H. 2001. Polynomial texture maps. Proceedings of ACM Siggraph
2001.
[MN06] Mathews, N., Noble, T., 2006. Surveying by Photo: Get Close-range Photogrammetric Control that's Accurate Enough. Paper delivered at the Computer Applications
and Quantitative Methods in Archaeology Conference
(CAA2006), Fargo, ND USA.
[MO05] Malzbender, T., Ordentlict, E. Maximum Entropy Lighting for Physical Objects. Hewlett-Packard Technical
Report HPL-2005-68. http://www.hpl.hp.com/personal/ Tom_Malzbender/papers/papers.htm
[MS06] Mudge, M. Schroer, C., 2006. 3D Data Acquisition with Reflection Transformation Imaging. Paper delivered at the Computer Applications and Quantitative Methods
in Archaeology Conference (CAA2006), Fargo, ND USA.
[Mud04] Mudge, M., 2004. Web Graphics/Special Sessions/ Panels, Cultural Heritage and Computer Graphics Panel,
SIGGRAPH 2004 Conference Presentations, Soma
Media, publisher, ISBN1-58113-950-X.
[MURweb] 3D Murale project website. http:// dea.brunel.ac.uk/project/murale/murale.html
[MVSL05] Mudge M., Voutaz J.P., Schroer C., Lum M., 2005. Reflection Transformation Imaging and Virtual Representations of Coins from the Hospice of the Grand St. Bernard. In Proceedings of 6th International
Symposium on Virtual Reality, Archaeology and Cultural Heritage (VAST2005), Mudge M., Ryan N., Scopigno R.
(Eds.), Eurographics Association, pp. 29– 39.
[TWDM79] Turpin, S. A., Watson, R. P., Dennett, S., and Muessig, H., 1979. Stereophotogrammetric Documentation of Exposed Archaeological Features in
Journal of Field Archaeology.
[WVM*05] Willems, G., Verbiest, F., Moreau, W., Hameeuw, H., Van Lerberghe, K., Van Gool, L., 2005. Easy and cost-effective cuneiform digitizing. In Short and
Project Papers Proceedings of 6th International Symposium on Virtual Reality, Archaeology and Cultural Heritage (VAST2005), Mudge M., Ryan N., Scopigno R.,
(Eds.), Eurographics Association, pp. 73-80.
[Zuc04] Zuckerman, B., 2004. Every dot and tiddle: A consideration of the limitations of computer imaging for the study of Dead Sea scrolls. Double Takes: Thinking
and Rethinking Issues of Modern Judaism in Ancient Contexts Garber, Z. and Zuckerman, B. (Eds) Studies of