Mutations in SELENBP1, encoding a novel human methanethiol
oxidase, cause extra-oral halitosis
Arjan Pol#1, G. Herma Renkema#2, Albert Tangerman3, Edwin G. Winkel4,5, Udo F. Engelke2, Arjan P. M. de Brouwer6, Kent C. Lloyd7, Renee S. Araiza8, Lambert van den
Heuvel2,9, Heymut Omran10, Heike Olbrich10, Marijn Oude Elberink2, Christian Gilissen6, Richard J. Rodenburg2,9, Jörn Oliver Sass11, K. Otfried Schwab12, Hendrik Schäfer13, Hanka Venselaar14, J. Silvia Sequeira15, Huub J.M. Op den Camp1,17, and Ron A. Wevers2,17,18
1Department of Microbiology, IWWR, Faculty of Science, Radboud University, Nijmegen, The
Netherlands 2Translational Metabolic Laboratory, Department of Laboratory Medicine, Radboud
University Nijmegen Medical Centre (RUNMC), Nijmegen, The Netherlands 3Department of
Internal medicine, RUNMC, Nijmegen, The Netherlands 4Center for Dentistry and Oral Hygiene,
University Medical Center Groningen, University of Groningen, The Netherlands 5Clinic for
Periodontology, Amsterdam, The Netherlands 6Department of Human Genetics, RUNMC,
Nijmegen, The Netherlands 7Department of Surgery, School of Medicine, and Mouse Biology
Program, University of California, Davis, USA 8Mouse Biology Program, University of California,
Users may view, print, copy, and download text and data-mine the content in such documents, for the purposes of academic research, subject always to the full Conditions of use:http://www.nature.com/authors/editorial_policies/license.html#terms
18Correspondence should be addressed to R.A.W. ([email protected]). 17These authors jointly directed this work.
URLs: BRENDA: https://www.brenda-enzymes.org/ CADD: http://cadd.gs.washington.edu/ ExAC: http://exac.broadinstitute.org/ KOMP: https://www.komp.org/ MEGA6: http://www.megasoftware.net/ PIR: http://pir.georgetown.edu/pirwww/search/ PovRay: http://www.povray.org/ TOXNET: https://toxnet.nlm.nih.gov/
WHAT IF: http://swift.cmbi.ru.nl/whatif/
YASARA: http://www.yasara.org/
Author Contributions
H.J.M.OdC. and R.A.W. conceived the study, coordinated and supervised the different teams; H.J.M.OdC. and A.P. and G.H.R. designed the assays of the sulfur metabolites and MTO enzyme activity; A.P., U.F.E., A.T. measured sulfur metabolites and/or MTO enzyme activity; E.G.W. performed the Oral Chroma technique for halitosis detection; U.F.E. did the body fluid NMR measurements; A.P.M.d.B. provided the tissue expression data of SELENBP1; K.C.L. and R.S.A. made the knockout mouse line; L.v.d.H. and M.O-E. performed Sanger sequencing of SELENBP1; H.Om. and H.Ol. did the linkage analysis and whole exome sequencing in family A. C.G. made the frequency calculations for the SELENBP1 defect; R.J.R. and G.H.R. performed the cell cultures and the lentiviral complementation studies; J.O.S., K.O.S., J.S.S. and A.T. did the clinical and biochemical phenotyping of the patients and families; H.S. and H.J.M.OdC. provided the gene sequence of methanethiol oxidase from the Hyphomicrobium strain VS; H.V. made the SELENBP1 three-dimensional model and mapped the affected amino acid residues; A.T. did initial measurements of sulfur containing metabolites in blood and breath and carried out several studies on halitosis patients; A.P., G.H.R. and R.A.W. prepared the manuscript with contributions of various co-authors. All co-authors edited and reviewed the final manuscript.
Competing Financial Interests
Author Manuscript
Nat Genet. Author manuscript; available in PMC 2018 June 18.
Published in final edited form as:
Nat Genet. 2018 January ; 50(1): 120–129. doi:10.1038/s41588-017-0006-7.
Europe PMC Funders Author Manuscripts
Davis, USA 9Department of Pediatrics, RUNMC, Nijmegen, The Netherlands 10Klinik für Kinder-
und Jugendmedizin, Universitätsklinikum Münster, Germany 11Bioanalytics and Biochemistry,
Department of Natural Sciences, Bonn-Rhein-Sieg University of Applied Sciences, Rheinbach,
Germany 12Department of Pediatrics and Adolescence Medicine, University Hospital Freiburg,
Germany 13School of Life Sciences, University of Warwick, Coventry, United Kingdom 14Centre for
Molecular and Biomolecular Informatics, RUNMC, Nijmegen, the Netherlands 15Metabolic
Unit-Pediatric Department, Hospital de Dona Estefânia, CHLC, Lisbon, Portugal
# These authors contributed equally to this work.
Abstract
Selenium binding protein1 (SELENBP1) has been associated with several cancers. Its exact role was unknown. We show that SELENBP1 is a methanethiol oxidase (MTO), related to MTO of methylotrophic bacteria, converting methanethiol to H2O2, formaldehyde and H2S, an activity not known to exist in humans. Mutations in SELENBP1 were found in five patients with a cabbage-like smelling breath. Increased levels of methanethiol and dimethylsulfide are the main odorous compounds in their breath and responsible for the malodor. Increased urinary excretion of dimethylsulfoxide is a diagnostic biomarker of MTO-deficiency. Patient fibroblasts showed reduced amounts of SELENBP1 protein and deficient MTO enzymatic activity which could be restored by lentiviral-mediated expression of the wild-type SELENBP1 gene. A knockout mouse line showed the same biochemical characteristics. Our data define a novel inborn error of
metabolism caused by MTO-deficiency leading to a malodor syndrome. MTO deficiency may be a frequent inborn error of metabolism.
Keywords
extra-oral halitosis; dimethylsulfoxide; dimethylsulfone; dimethylsulfide; methanethiol;
methanethiol oxidase; erythrocytes; inborn error of metabolism; gasotransmitter; cancer; malodor; hydrogen sulfide; volatile organic compounds; tumor suppessor
Introduction
Volatile sulfur-containing compounds hydrogen sulfide (H2S), methanethiol (MT, CH3-SH) and dimethylsulfide (DMS, CH3-S-CH3) have been identified as the main contributors of halitosis or bad breath 1. The origin of halitosis can be intra- or extra-oral 2–4. Intra-oral halitosis is the most common form usually caused by MT and H2S produced by Gram-negative bacteria located on the dorsum of the tongue or in gingival- and periodontal crevices. Extra-oral halitosis has an estimated prevalence of 0.5-3% in the general
population 2. Its origin is less well understood. Extra-oral bad smelling breath can be caused by conditions affecting the nose, sinuses, tonsils, and esophagus, but evidence indicates that in some patients the extra-oral halitosis is blood-borne 3. In blood-borne halitosis
malodorant compounds, most commonly DMS, are carried to the lungs where they enter the breath 3. Mouth and nose breath DMS concentrations of these patients showed a five- to six-fold increase compared to controls 2. The cause for increased DMS levels in these patients is
Europe PMC Funders Author Manuscripts
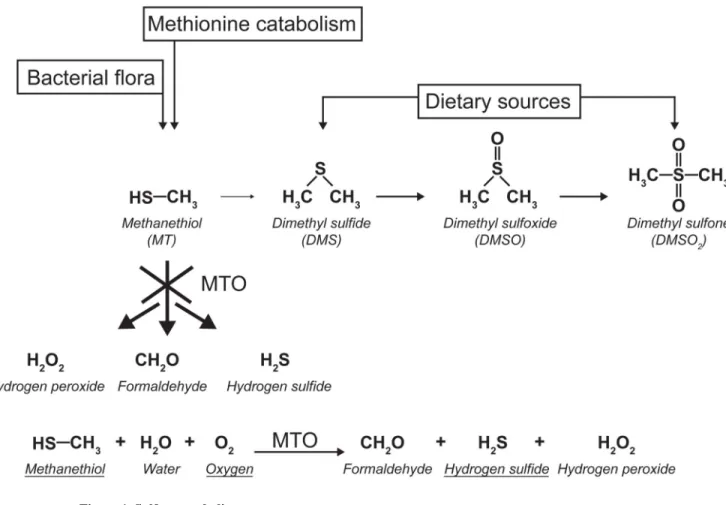
unknown. DMS is produced from MT by methylation. Both compounds result from the complex microbiome-mammalian co-metabolism of volatile sulfur compounds (Figure 1) 5,6. Under physiological conditions MT has three sources in the human body 7,8: production from sulfur containing amino acids by intestinal bacteria; formation within intestinal cells by methylation of H2S by thiol S-methyltransferase; biosynthesis from methionine by the transamination pathway in human endogenous metabolism. Under pathological conditions, it has been found that increased levels of DMS can lead to high concentrations of dimethylsulfoxide (DMSO) and dimethylsulfone (DMSO2) 9. The enzymes involved in these conversions are largely unknown and a contribution of the gut bacteria is expected 5,6. Interestingly cancer patients were found to produce MT and DMS as prominent volatile organic compounds 10,11. DMS is produced in significant amounts by lung- and liver cancer cell lines 10,12 and was found in lung tumor tissue13.
Recently, a methanethiol oxidase (MTO) was purified from the Hyphomicrobium strain VS 14,15. The gene encoding this enzyme was identified and showed 26% homology at the protein level to the human SELENBP1 gene, encoding a protein possessing selenium binding properties but with unknown function 16–18. Reduced expression of the human gene has been found in several tumors, and a tumor suppressor function has been suggested 19–21. We hypothesized that mutations in SELENBP1 could be causative for extra-oral halitosis. We studied five patients with extra-oral halitosis caused by elevated levels of DMS in the blood. We identified SELENBP1 as the human MTO, catalyzing the conversion of MT into formaldehyde, H2S and hydrogen peroxide (H2O2). Mutations in SELENBP1 cause extra-oral halitosis and define a novel inborn error of metabolism.
Results
Extra-oral halitosis patients
We studied five patients from three unrelated families with extra-oral halitosis with a cabbage-like odor (Figure 2A). The patients had high levels of DMS in their mouth- and nose breath. Known causes, such as intake of DMS containing food, use of sulfur-containing medication, lower gastrointestinal problems, known metabolic defects such as methionine adenosyltransferase deficiency and tyrosinemia were excluded. Family A is a German family of Turkish origin with two affected children (AII-2 and AII-3), family B is Portuguese with one affected child (BII-2), and family C is a Dutch family with two affected children (CII-1 and CII-2). The unifying clinical feature was the pungent malodor from the breath. Other clinical signs and symptoms of the patients differed considerably (for a full description see Supplementary Note). The two patients in the Dutch family are from a non-consanguineous marriage and the malodor was their only clinical symptom. The mother of patients CII-1 and CII-2 had some complaints of halitosis. The parents of the other patients were
consanguineous. The female patient in family A had malodor as only symptom while her brother had a broader spectrum of clinical symptoms with neurological features. The Portuguese patient also had neurological sequelae.
Europe PMC Funders Author Manuscripts
Breath and body fluid analyses
Breath and body fluid analyses used complementary methods (NMR spectroscopy, gas-chromatography) (Table 1). Because of the malodor body fluid NMR spectroscopy was requested in the index patients of the three families. NMR showed the presence of increased concentrations of DMSO and DMSO2 in their body fluids (Figures 2 B and C).
Using gas-chromatography with a sulfur detector an increased concentration of an additional sulfur-containing compound, DMS, was detected (Table 1B). Increased DMS concentrations in blood have been described in patients with extra-oral halitosis 3,4. DMSO2 is an oxidation product of DMS. Increased DMSO2 concentrations have been observed in blood of patients with methionine adenosyltransferase deficiency 9. DMSO2 also occurs in cerebrospinal fluid after DMSO2 intake as dietary supplement 22. Additional investigations on breath samples of patients AII-3 and CII-2 revealed increased levels of a fourth sulfur-containing
compound, MT. The MT concentration in breath of these patients was ten times higher than the highest value in control persons and unaffected family members. Specialized dental clinics may use portable gas chromatography to detect this specific form of halitosis (see breath analysis of CII-2, Supplementary Figure 1). We detected increased MT levels in urine in some of our patient samples. Because MT is highly volatile and reactive, reproducible quantification of urinary MT was impossible.
Patient BII-2 was treated for five days with the antibiotic Metronidazol (500 mg oral; three times/day). The concentration of DMS in breath decreased to just above the detection limit. DMS and MT in urine decreased to 65% after 5 days of Metronidazol. After cessation, the DMS levels in breath and urine returned to values before treatment. In patient AII-3 a methionine loading trial was performed. Initial levels of 18 and 129 μmol/mmol creatinine for DMSO and DMSO2 rose to 67 and 178, respectively at 12 h after loading. At 20 h the levels were still increased (48 and 152). These data are in line with a significant contribution of the microbiome and as well of methionine metabolism to the breath- and body fluid concentration of MT, DMS and its further oxidation products DMSO and DMSO2 in the patients.
Mutational analysis of SELENBP1
Based on the profile of accumulating sulfur-containing compounds in our patients we postulated a defect in a pathway that would result in the accumulation of DMS. We hypothesized that defects in MT-oxidation would lead to increased levels of MT and lead to an alternative metabolism resulting in increased DMS, DMSO, and DMSO2 (Figure 1). MT degrading enzymes are not known in humans, but methanethiol oxidases (EC 1.8.3.4.) have been purified from Hyphomicrobium strain EG 23 and Thiobacillus thioparus TK-m 24. Recently a gene, mtoX, was found in Hyphomicrobium strain VS encoding a protein with MTO activity 15. BLAST searches of the human protein database using the
Hyphomicrobium strain VS MTO amino acid sequence yielded a single hit, selenium-binding protein 1 (SELENBP1/SBP1/hSBP/SBP56), with a sequence identity of 26% and homology of 54% (Supplementary Figure 2). The gene encoding this candidate protein, SELENBP1 is located on chromosome 1 (151.364.302-151.372.734), and lies within a linkage interval with a LOD-score of 1.8 found in family A. The protein is well conserved in
Europe PMC Funders Author Manuscripts
the three domains of life from human to bacteria and archaea (Figure 3A). Subsequent SELENBP1 Sanger sequencing showed 4 different bi-allelic mutations in our 5 patients (Table 2). Segregation with the malodour was confirmed in the three pedigrees.
Pathogenicity of SELENBP1 mutations
The four mutations were predicted to be pathogenic by the algorithms Align GVGD, SIFT, MutationTaster, and PolyPhen-2 (Table 2). When calculated by the CADD tool, the mutations ranked in the top 1% of most deleterious mutations (C-score ≥ 20) or even in the top 0.1% (C-score ≥ 30) (Table 2). We have modeled the human SELENBP1 protein containing the two mutations of family C on the X-ray structure of the hypothetical selenium-binding protein from the archaeon Sulfolobus tokodaii (PDB ID: 2ECE) (Figure 3B and C). Gly225Trp is likely incompatible with the original structure since glycine-225, without side chain, is replaced by a bulky tryptophan. Moreover, Gly225 is conserved in methanethiol oxidases and putative selenium binding proteins from all domains of life. For the c.985C>T mutation changing His329 to Tyr the pathogenicity is less obvious from the structure analysis. The mutant residue is only slightly larger and does not seem to collide with adjacent side chains but His329 is conserved in eukaryotic orthologues and is in close proximity to a fully conserved region (Figure 3D).
Diagnostic assay for MTO enzyme deficiency
We have developed a functional MTO enzymatic assay to prove that SELENBP1 has MTO activity, to evaluate its biochemical characteristics and to establish the residual activity in patients (see Online Methods and Supplementary Figure 3. MTO activity in different blood fractions of control individuals revealed relatively high activity in erythrocyte extracts, but with a broad range (0.04 - 6.1 nmol.μl-1.h-1, mean 1.4, median 0.63; n=30, Figure 4A, see Raw gel data for full length blots of Figure 4). MTO activity was low in leucocytes from control individuals and hardly detectable in plasma (not shown). Erythrocytes of the patients AII-3 and CII-2 had very low MTO activity (0.017 and 0.022 nmol.μl-1.h-1) in line with a deficiency of the enzyme and adding to the functional role of the SELENBP1 protein as a methanethiol oxidase.
SELENBP1 protein and activity in cell lines
SELENBP1 mRNA was found to be ubiquitously expressed. The highest RNA levels were found in adult tissues, mainly in kidney, duodenum, liver, lung, and the brain (Figure 4B). SELENBP1 has been described as a tumor marker with decreased expression in certain cancers and tumor cell lines 20,21. To correlate the protein expression levels with our biochemical assay we analyzed colon cancer lines with previously documented high (HT29 cells) and low SELENBP1 expression (SW480 cells) 25. Western blot analysis of these cell lines (Figure 4C) was in agreement with published results. MTO enzymatic activity was high in HT29 cells (4.2 nmol.mg protein-1.h-1) and undetectable in SW480 cells, nicely in line with expression data from literature and corresponding with Western blot results. Fibroblast lines from patients (AII-3 and CII-2) had significantly lower SELENBP1 protein levels than control cells (Figure 4D). MTO enzyme activity in the patient cells was not
Europe PMC Funders Author Manuscripts
detectable (controls: 2.6-6.6 nmol.mg protein-1.h-1). We could demonstrate that the MTO enzyme activity in control fibroblasts is dependent on the presence of oxygen (data not shown) and that the molar amount of H2S formed equals the amount of converted substrate MT.
SELENBP1 has a nanomolar range Km for MT
For accurate kinetic analysis we supplemented the reaction mixture with 0.3 mg/ml of BSA, which stabilizes MTO at low protein concentrations. A kinetic analysis with erythrocytes was performed by varying the initial MT concentrations and measuring the initial reaction rates (Supplementary Figure 3D), resulting in a remarkably low apparent Km value of 4.8 nM. When using different cell and tissue sources of MTO we could measure the decrease of MT in the headspace of the reaction down to low nanomolar amounts (Supplementary Figure 3E-G). Curve fitting resulted in similar apparent Km values for all tested extracts.
Frequency of SELENBP1 mutations
Using data from the ExAC browser and a local dataset of 15,000 exomes we found evidence for a possible frequency of bi-allelic pathogenic SELENBP1 mutations of approximately 1 : 90,000 corresponding to a carrier frequency of 1 per 300 individuals (See Supplementary Note, and Supplementary Table 1). Based on these data MTO deficiency may be a frequent inborn error of metabolism. The frequency of extra-oral halitosis has been estimated by Tangerman et al 2 to be between 0.25-1.5% indicating that bi-allelic mutations in SELENBP1 can explain a minority of extra-oral halitosis cases.
Lentiviral complementation analysis
To further substantiate that the MTO activity depends on the presence of SELENBP1 we performed a lentiviral complementation experiment in a patient fibroblast cell line (Figure 4F). The cell line of patient AII-3 and a control fibroblast line were lentivirally transduced with either a control virus expressing V5 epitope tagged green fluorescent protein (GFP), or a virus expressing V5-tagged wild-type SELENBP1. The exogenous protein was expressed partly in the nucleus but mostly in the cytoplasm. The cytoplasmic staining was not uniform but seemed to follow internal filamentous structures (Supplementary Figure 4). This confirms previous studies 21,26,27.
Subsequently, we analyzed MTO activity in stably expressing cell lines. The MTO activity in patient fibroblasts expressing GFP protein only and the non-transduced cells was undetectable. In addition, little or no SELENBP1 protein was seen on Western blot. Introducing exogenous SELENBP1-V5 protein in patient fibroblasts resulted in
re-expression of SELENBP1, as detected with the specific antiserum as well as with an anti-V5 tag antiserum. Moreover, the MTO enzyme activity increased from undetectable to 55% of the control cell line.
SELENBP1 knockout mouse
A knockout mouse line was previously created by the Knockout Mouse Program Project (KOMP) at UC Davis. This mouse, expressing a “knockout (KO) first” allele of the Selenbp1tm1b(KOMP)Wtsi gene, had no apparent phenotypic changes. MTO enzyme activity
Europe PMC Funders Author Manuscripts
and metabolite concentrations were measured in KO mice, heterozygous carriers and wild type mice. MTO activity in erythrocytes of wild type mice was 1.8 nmol.μl-1.h-1, which is in the same order of magnitude as found in human erythrocytes. MTO activity in mouse erythrocytes was also strictly dependent on oxygen and yielded stoichiometric amounts of sulfide (not shown).
MTO activity in KO mice erythrocytes was deficient (on the limit of detection at 0.05 nmol.μl-1.h-1) while an intermediate activity was found in heterozygous mice (0.8 nmol.μl-1.h-1, Figure 5A). MTO enzyme activity was measured in four different tissues (Figure 5B). The highest activity in wild type animals was found in liver. Activity in liver and kidney was more than tenfold higher compared to muscle and brain. In KO animals the residual activity was <6% in all tissues compared to wild type animals illustrating the enzyme deficiency. The affinity constant of MTO from mouse tissue extracts (liver shown in Supplementary Figure 3G) and mouse erythrocytes (not shown) was 4-6 nM, similar to the low apparent Km in human erythrocytes and HT29 colon cells (Supplementary Figure 3E and F).
Since the loss of MTO activity in the patients resulted in accumulation of DMS and DMSO2 we also measured these products in blood plasma of the mice. As MT is expected to be much lower than DMS in blood and because of the highly volatile nature of the compound, MT quantification was not undertaken in the small amounts of plasma available. DMS in plasma of KO mice was significantly increased over control levels (Figure 5C). Interestingly somewhat increased plasma DMS levels were also seen in the heterozygous mice. This implies a mild biochemical phenotype of the gene defect in the heterozygous mice illustrating that the reduced MTO activity cannot cope with the usual flux through this enzymatic reaction. There was an accumulation of DMSO2 in plasma in the KO mice that was not detectable in both the wild type mice (Figure 5D and E; 36 μM) and the
heterozygous mice (not shown). Overall the biochemical characteristics of the patients were mimicked in the KO mouse model.
Discussion
We describe a group of patients suffering from extra-oral halitosis. All known causes for extra-oral halitosis, fetor hepaticus caused by liver cirrhosis 28, medicine use, cysteamine treatment in cystinosis 29, were excluded. Also methionine adenosyltransferase deficiency 9,30 and trimethylaminuria 3 were excluded. Our patients have increased concentrations of four sulfur-containing metabolites in their body fluids and breath. MT and DMS have a high odor index and are responsible for their malodor. Increased urinary excretion of DMSO2 is characteristic and diagnostic for this form of extra-oral halitosis. MT is known to be produced in substantial amounts by gut bacteria. We hypothesized that the metabolic defect in our patients relates to an impairment of MT metabolism. It was known that MT is oxidized towards H2S 7 but the enzyme, a methanethiol oxidase, had never been found. Our data show that SELENBP1 is the long-sought human MT-oxidase.
Bi-allelic mutations in SELENBP1 are the underlying cause for a novel autosomal recessive malodor syndrome. Mutations in SELENBP1 had never been implicated with a genetic
Europe PMC Funders Author Manuscripts
disorder. Increased expression of SELENBP1 was found in blood and in dorsolateral prefrontal cortex of schizophrenia patients 31–33.
The malodor is the unifying clinical feature in our patients. It is the only clinical feature in both patients of family C. There is consanguinity in the families A and B. The additional neurological signs and symptoms of patients AII-3 and BII-2 but not of AII-2 may have had other causes. Whole exome analysis in family A identified pathogenic mutations in THAP4 as a potential cause for the neurological features in AII-3 (see Supplementary Note, for detailed Patient Description and Supplementary Figure 5). Our data thus suggest that defects in SELENBP1 may cause a malodor syndrome without neurological sequelae. Further studies are required to unravel the full phenotypic consequences of SELENBP1 defects. Furne et al 34 have described a specialized detoxification system in colonic mucosa that converts MT to appreciable amounts of H2S. Defective mucosal detoxification of MT may lead to ulcerative colitis 34. They see a potential link with the strong familial clustering of ulcerative colitis. Based on our findings it may be worthwhile to investigate a potential involvement of SELENBP1 in ulcerative colitis.
SELENBP1 was first cloned by Chang 35 based on homology to the mouse selenium binding protein (mSBP56) 17,18. Binding of selenite by SELENBP1 was suggested to occur via cysteine-57 16. The bacterial MTOs do not have Cys at the 57-position nor in close proximity. Therefore Selenium binding seems not essential for MTO enzyme activity of SELENBP1. Selenite binding was found essential for a specific interaction of SELENBP1 with the von Hippel-Lindau protein-interacting deubiquitinating enzyme 1 26. SELENBP1 was not known to possess enzymatic activity 26. In incubations of control human fibroblasts and erythrocytes with the MTO-substrate MT we observed a rapid conversion of MT in time and were able to measure stoichiometric amounts of the H2S formed. The enzymatic activity was strictly dependent on the presence of oxygen. We based the presumed reaction formula (Figure 1) on our results and on the homologous Hyphomicrobium strain VS enzyme for which also H2O2 and formaldehyde were confirmed as reaction products. The apparent Km value of the human MTO towards MT, 4.8 nM, is very low. According to the BRENDA database there are only very few enzymes with such a low Km value. The formation of DMS from MT is normally of minor importance (an estimated 1% of MT is converted into DMS in control individuals 7). The high flux through the MTO reaction becomes apparent in our patients and in the KO mouse model. In the deficiency state an alternative metabolic
pathway comes in place resulting in substantial amounts of DMS, DMSO and DMSO2 in the body fluids of the affected individuals. This underpins the relevance of the MTO enzyme reaction in human metabolism.
Deficiency of MTO activity may have metabolic consequences. These can be toxicity effects due to accumulating sulfur compounds. Data on toxicity of MT, DMS and DMSO are anecdotal and only little is known about low-dose toxicity of these compounds (36, and TOXNET). No cell biological effects of an increased MT concentration have been
documented. The MTO enzymatic activity of the SELENBP1 protein sheds new light on this because at least two of the products of this enzyme, H2O2 or H2S, are biologically active molecules possessing cellular signaling functions. Decreased availability of H2O2 or H2S may have metabolic consequences. H2O2 is important because of its role in cellular
Europe PMC Funders Author Manuscripts
signaling 37. H2S is a gaseous signaling molecule, a gasotransmitter, like nitric oxide and carbon monoxide 38. At low concentrations it acts as mitochondrial electron donor thus stimulating electron transport in mammalian cells 5. The general effect of H2S is cyto-protective 5 and H2S therapy for several disorders aims at vasodilatation, antioxidant upregulation, inflammation inhibition, and activation of anti-apoptotic pathways 38–40. At high concentrations H2S is toxic by its known inhibition of the respiratory chain complex IV. In view of these literature data we cannot exclude that toxic effects of accumulating sulfur compounds or the lack of H2O2 or the gasotransmitter H2S may be causing other clinical signs and symptoms in patients with SELENBP1 mutations than malodour only. The low apparent Km of MTO may be important to avoid MT toxicity but also may have a role in the gasotransmitter producing system that operates at the nanomolar level. Three enzymes in human metabolism are known to produce H2S. These are cystathionine β-synthase (CBS), cystathionine γ-lyase (CSE or CGL) and 3-mercapto-pyruvate sulfur transferase (3MST) 41. Our data show that the MTO encoded by SELENBP1 is a fourth human H2S producing enzyme. The degree to which SELENBP1 contributes to the total H2S production is so far unknown.
One may speculate that the function of SELENBP1 may lie in keeping the breath MT concentration low enabling the human nose to detect foul smell from environmental volatile sulfur compounds. The human nose is very sensitive for MT and DMS which have a very high odor index 3. The sensitivity towards sulfur-containing compounds is evolutionary beneficial since these compounds often represent ‘danger’ in the form of decaying food sources. The low apparent Km of MTO is essential to keep the MT concentration in the body below the odor threshold level.
The presence of MTO activity in erythrocytes seems rather surprising since red blood cells have only few functions other than transporting oxygen. The presence of SELENBP1 protein as one of the major non-heme proteins in these cells has been described before in the naked mole rat 42 and in humans 33,43. Also one of the other known H2S producing enzymes, 3MST, has been found in erythrocytes. Local H2S production in the bloodstream may be important for vasodilatation 44,45. A second H2S producing enzyme in the red blood cell underpins the importance of this metabolite for this cell or the role that the erythrocyte plays in the delivery of H2S as cargo. It remains to be established which of these two enzymes has the most important contribution to H2S formation in the blood. We have no indications for vascular problems in patients with MTO mutations but this is open for further investigations. SELENBP1 is a possible biomarker for disease progression in several cancers, such as breast-, renal cell- and colorectal cancers and others 46. It is of note that we have no indication that patients with SELENBP1 mutations have an increased risk to develop cancer. Low SELENBP1 mRNA or protein levels are associated with a poor clinical cancer
prognosis 46 suggesting that SELENBP1 might be a tumor suppressor 20. In line with a tumor suppressor role and the MTO enzymatic activity of SELENBP1 is the observation that A549 lung cancer- and the HepG2 liver cancer cell lines produce DMS and other volatile sulfur compounds 10,12,47. DMS and MT were found in breath of lung cancer patients 10,11. DMS, normally absent in lung tissue, was found in lung tumor tissue 13. MT was found increased in flatus samples of colon cancer patients 10. Interestingly prevention of
Europe PMC Funders Author Manuscripts
diffusion of sulfur-containing gases from the tumour in an animal model caused a significant decrease in tumour proliferation rate 11. The mechanism of SELENBP1 tumor suppression is largely unknown 25. The SELENBP1 interaction with the von Hippel-Lindau protein-interacting deubiquitinating enzyme 1, which is involved in cancer suppression may play a role 26. Also its interaction with GPX1 (glutathione peroxidase 1), interestingly also a selenocysteine-containing protein, may be relevant 48. Both proteins are present in
erythrocytes. GPX1 is a potent antioxidant enzyme involved in counteracting oxidative stress by reducing peroxide to water to limit its destructive effects 49. Several cancers have been described to have reduced GPX1 expression (reviewed by 50). Besides a tight physical interaction, SELENBP1 and GPX1 have complex regulatory effects on each other 48. Our finding that SELENBP1 is in fact a human MTO that produces H2O2, which is
enzymatically converted by GPX1, may shed new light on the interactions between SELENBP1 and GPX1. Deregulation of either enzyme may cause a misbalance in local H2O2 concentrations. The H2O2 concentration must be controlled because of its bivalent roles in both oxidative damage as well as in cellular signaling 37. The function of
SELENBP1 in sulfur metabolism sheds new light on the tumor suppression mechanism and the role of the local concentrations of MT, DMS and H2S in this process. It is well known that dogs can smell the presence of some tumors in patients 51. With our data it is tempting to speculate that MT and DMS are the compounds that the dogs will smell in patients with cancer.
Taken together the putative tumor suppression role of SELENBP1 and the presence of DMS in tumors nicely fit together against the background of the enzymatic function of
SELENBP1 as the long sought methanethiol oxidase.
In conclusion, our experiments have identified a novel human enzyme activity, a
methanethiol oxidase. The enzyme is encoded by SELENBP1. SELENBP1 mutations cause extra-oral halitosis, an autosomal recessive malodor syndrome that may occur frequently in the general population. Accumulating sulfur-containing metabolites cause the bad smell in the patients. Theoretically this syndrome may be a treatable inborn error of metabolism when using dietary measures. SELENBP1 has been studied as a biomarker for several cancers. The finding that SELENBP1 has an enzymatic role in sulfur metabolism and influences the concentration of biologically active molecules as H2O2 and H2S may provide new clues and targets for the cancer field.
Online Methods
Patients and data
This study adhered to the Declaration of Helsinki and written informed consent was obtained from each individual. Full description of the patients can be found in the Supplementary Note.
Statistics, body fluids, cells and animal model
Statistical analysis was performed using GraphPad Prism 5.
Europe PMC Funders Author Manuscripts
Human blood cells were obtained from anonymized samples from the Radboud university medical center. White blood cells were obtained after dextran gradient sedimentation. The leucocyte fraction contained lymphocytes and granulocytes. Erythrocytes were obtained after slow centrifugation (600xg) of heparinized blood. Plasma and white blood cells were removed and the erythrocytes were extensively washed with PBS before being snap frozen as pellets. The erythrocyte extracts had a protein concentration between 240-280 mg/ml. Anonymized plasma was obtained from healthy volunteers after informed consent. The C57BL/6N- Selenbp1tm1b(KOMP)Wtsi/Mbp knockout mouse (Mus musculus) was genetically engineered to delete the critical coding region and create a homozygous null mutation of the Selenbp1 gene in all somatic and germline tissues. This knockout model was generated as part of the U.S. National Institute of Health’s Knockout Mouse Production and Phenotyping Project. The knockout mouse line was created by the Knockout Mouse Program Project (KOMP) at UC Davis in full compliance with all applicable laws and regulations for the KOMP program. Animal care and use was conducted under guidelines provided by the 8th Revision of the Guide for the Care and Use of Laboratory Animals. The care, use, and disposition of all mice used in this study were reviewed and approved by the Institutional Animal Care and Use Committee of the University of California at Davis. This study used both male and female homozygous mutant mice ranging in age from 8-18 weeks of age for urine collections, and 11-20 weeks of age for end point blood and tissue
collections. Mouse plasma samples, washed erythrocytes (as for the human erythrocytes) and snap frozen tissue samples were sent to Nijmegen in The Netherlands by courier and on dry ice. For the animal studies no randomization was used and no animals were excluded from this study. The investigators were not blinded to the group allocation of the animal samples.
NMR spectroscopy of body fluids
DMSO and DMSO2 in plasma, urine and cerebrospinal fluid (CSF) were measured using proton NMR spectroscopy essentially as described for plasma, CSF 9,54,55 and urine 56. The lower limit of detection for DMSO and DMSO2 amounts to 1 μM.
GC analysis of H2S, MT and DMS
Analysis of MT for comparison of fibroblast MTO activity was done with a Chrompack CP9001 GC that was equipped with a sulfur-specific flame photometric detector (FPD) and a two meter glass column (four mm ID) packed with Carbopack B HT, as described 57. In addition an Agilent 7890B gas chromatograph (Middelburg, The Netherlands) was used, of which the FPD detector had a lower detection limit (0.05 pmol). This allowed us to study the MT kinetics of MTO in the low nM range. This GC had the same column of Carbopak B HT100 fitted to the capillary inlet of the FPD detector (set at 200 °C). The empty part of the inlet side of the column was extended into the heated GC inlet (150 °C) up to the septum to avoid any contact of sample gas with metal parts, since MT and other volatile sulfur-containing compound are notorious for their stickiness to metals. For both GC's the carrier gas was nitrogen (80 ml/min). For MTO enzyme activity measurements where both hydrogen sulfide and MT were measured the column was set at 100 °C. For higher sensitivity desired in MTO kinetics when sulfide was trapped, the temperature was set at
Europe PMC Funders Author Manuscripts
130 °C. For MT and DMS analysis in breath the initial column temperature was set at 100 °C and after 0.5 min. increased to 140 °C resulting in retention times of 0.6 min. for H2S, 1.4 min. for MT and 6 min. for DMS, respectively.
Analysis of MT and DMS in breath
Breath samples were collected in three Liter Tedlar bags (SKC, Procare BV, Groningen, The Netherlands) via a tube (ID 4 mm). The end of this tube was pierced through a 12 mm rubber stopper. This stopper was pressed against one nostril while the other one was kept closed. The bag was filled in 2-4 goes after a relative deep breath through the nose was taken. Each go took 5-10 seconds. For DMS analysis three ml subsamples were taken from the bag and injected into the GC (lower limit of detection: 1 ppb). For MT analysis 400 ml subsamples were concentrated on a Tenax tube (13 cm, 3 mm ID) that was kept in dry ice (10 min. precooling). About 1.5 cm of the Tenax tube was sticking out above the dry ice pellets and insulated by polystyrene, to prevent MT absorbing at the very beginning of the Tenax. The breath subsamples were pushed manually over the Tenax tube with a 100 ml glass syringe (with a Teflon plunger tip) at a rate of 5 ml/sec. To trap water from the breath samples a tube (8 cm, 4 mm ID) filled with CaCl2.2H2O was fitted in between the syringe and the Tenax tube. The end of the Tenax tube was extended with a 40 cm empty part that was coiled and sticking out of the dry ice. This acted as a gas reservoir for nitrogen gas that was passed over the Tenax after the samples (15 s at 200 ml/min). To desorb the trapped MT a three ml plastic syringe (Braun Injekt, fully polypropylene/ polyethylene, so no rubber plunger tip) was connected to the inlet of the Tenax tube which was subsequently taken out of the dry ice and quickly submerged completely in a hot water bath (95 °C). After 20 s in the water bath the three ml syringe was filled quickly in this way passing the hot nitrogen from the gas reservoir over the Tenax. The full content of the three ml syringe was now injected into the Agilent 7890B gas chromatograph (see above). The MT recovery of the Tenax trapping/desorbing method described here was about 60%. Calibration of MT for this method was done by injecting increasing amounts from a MT stock into a 15 L Tedlar bag that was filled with 10 L of clean air. The lower limit of detection for MT for this method was five ppt (parts per trillion). Loss of MT in Tedlar bags at room temperature was estimated at 10-25% after one day and verified for each bag used. Analysis was performed within 8 h (patient CII-2, loss < 10%) and 24 h (patient AII-3, loss <10%), respectively. The Tenax trapping part of the method was similar to that described previously by Tangerman 58 who used liquid nitrogen for cooling. The method suffers from some inherent inaccuracies and difficulties. MT absorbs to the Teflon parts of the 100 ml glass syringe. The same syringe is used throughout and cleaning in between samples that can differ a factor of 30 in MT concentration is critical. The same is true for the Tedlar bags used for collecting breath samples. The variation in gas flow rate from the syringe when concentrating MT on the Tenax tube may cause differences in the Tenax zone (both width and position) that is loaded with MT and will influence the desorption behavior. Also the position of the Tenax tube in the dry ice pellets during loading and in the hot water bath for desorption of the Tenax tube has limited reproducibility, as has the gas flow rate during manual desorption of MT by the three ml syringe. Reproducibility of duplicate samples from the same bag was in general good with differences less than 20%. Only for the low ppt values close to detection level differences could be higher, up to 50%.
Europe PMC Funders Author Manuscripts
Cell culture
Fibroblasts were cultured using standard procedures in M199 medium (Gibco, Life Technologies) supplemented with 10% fetal calf serum (FCS, GE Healthcare, Diegem, Belgium), and 100 U/ml / 100 μg/ml of penicillin/streptomycin (P/S) (Gibco) at 37 ºC with 5% CO2. All cell lines are routinely checked for mycoplasma infection and were only used in experiments when negative.
Cell lysates and Western blot analysis
For protein expression analysis by SDS-PAGE and Western blot analysis fibroblasts and colon cancer cell extracts were made by extraction in lysis buffer (50 mM Tris.HCl (pH 7.4), 150 mM NaCl, 1 mM EDTA, 10% glycerol, 1% Triton X-100) for 10 min. on ice and subsequent clearance (10 min., 13,000 x g). Protein concentrations were measured using a Micro BCA protein assay kit (Thermo Scientific) using bovine serum albumin (BSA) as a standard. Forty μg of the total extracts were separated on 10 % SDS-PAGE. Antisera used were: anti-V5 (#R960, Invitrogen monoclonal), anti-SELENBP1 (#SAB2108611, Sigma affinity purified rabbit polyclonal), and anti-actin (#AC-15, Novus Biologicals mouse monoclonal). Western blot analysis was performed 2 -3 times for each experiment. Representative results are shown in the figures. For the MTO assay the snap frozen fibroblast and erythrocyte pellets that had been stored at -80 °C, were resuspended in PBS and homogenized by extensive pipetting. White blood cells were also resuspended in PBS and homogenized by sonification. The protein concentration of the resulting homogenates ranged from 1-4 mg/ml as measured with the Bio-Rad Protein Assay (Bio-Rad) using BSA as a standard.
Tissue extracts
Tissue samples (snap frozen and stored at -80 ºC) were thawed on ice, chopped finely, and homogenized in Tris buffer using a tight fitting potter (10 mM Tris.HCl pH 7.4, 250 mM sucrose, 2 mM K+- EDTA, 5.104 U/l heparin). The homogenate was centrifuged (10 min, 600xg) and stored in aliquots at -80 ºC.
Molecular genetic analysis
Total DNA was extracted using the QIAamp DNA kit (Qiagen), and all exons and relevant splice sites were PCR amplified with primers containing the M13 forward or reverse sequence fused to a specific sequence and sequenced with M13 primers. Primer sequences are available upon request. Mutations were analyzed using Alamut version 2.5.1 with the integrated pathogenicity prediction tools. The Alamut splice site prediction module includes the following methods: SpliceSiteFinder-like, MaxEntScan, MNSplicer, GeneSplicer and Human Splicing Finder. Sequence alignment with SELENBP1 orthologues was done using the Clustal Omega (EMBL-EBI) webtool.
For frequency analysis we used the Exome Aggregation Consortium (ExAC), Cambridge, MA (URL: http://exac.broadinstitute.org). We used the Combined Annotation-Dependent Depletion (CADD) tool to estimate the pathogenicity of mutations found in the ExAC browser. This tool prioritizes functional, deleterious, and pathogenic variants across many functional categories by using a CADD PHRED like C-score 59.
Europe PMC Funders Author Manuscripts
Phylogenetic analysis of methanethiol oxidases and putative selenium-binding proteins
The evolutionary history was inferred using the Neighbor-Joining method. The two enzymes with proven MTO activity are indicated in red. Accession numbers are given between parenthesis. The optimal tree with the sum of branch length = 10.21887791 is shown. The percentage of replicate trees in which the associated taxa clustered together in the bootstrap test (500 replicates) are shown next to the branches for values > 60. The tree is drawn to scale, with branch lengths in the same units as those of the evolutionary distances used to infer the phylogenetic tree. The evolutionary distances were computed using the Dayhoff matrix based method and are in the units of the number of amino acid substitutions per site. The analysis involved 45 amino acid sequences. All ambiguous positions were removed for each sequence pair. There were a total of 564 positions in the final dataset. Evolutionary analyses were conducted in MEGA6 52.
SELENBP1 mRNA tissue expression analysis
The expression profile of SELENBP1 was determined as described before 60. Primer sequences used to detect SELENBP1 mRNA expression levels can be found in Supplementary Table 2.
Structural analysis
The structure of the heterologically expressed hypothetical selenium-binding protein from Sulfolobus tokodaii (st0059) was solved by X-ray crystallography and deposited in 2007 (PDB file 2ECE). This structure was used as a template to build a homology model of human SELENBP1 (40% identity). This model was used to study the structural details of the Gly225Trp and His329Tyr mutations and was created and visualized using the WHAT IF & YASARA Twinset 61,62. The figures were rendered with PovRay (http://www.povray.org/).
Lentiviral complementation
A gateway compatible expression vector for wild type SELENBP1 without a stop codon was purchased from PlasmID/ Harvard Medical School and recombined with the pLenti6.2V5-DEST destination vector (Invitrogen) using the Gateway LR Clonase II Enzyme Mix (Invitrogen) according to the manufacturer’s instructions. The resulting pLenti6.2-SELENBP1-V5 or the control construct pLenti6.2-AcGFP-V5 (Aequorea coerulescens Green Fluorescent Protein) were used to produce viruses for fibroblast infection and selection of stable expressing cells as was described 63.
Immunofluorescent microscopy
For immunofluorescent detection of V5-tagged SELENBP1 the stably transduced patient fibroblasts were grown on coverslips. The cells were fixed using 3.3% paraformaldehyde in cell culture medium for 15 min., washed three times with PBS and permeabilized for 15 min. with 0,5 Triton X-100 in PBS/10% FCS. The primary antibody (anti-V5) was diluted 1:100 in PBS/10% FCS and incubated for one hour. After extensive washing the secondary antibody (goat-anti-mouse IgG AlexaFluor 568, Invitrogen) was diluted 1:1000 in PBS/10% FCS and incubated for one hour. After washing the slides were mounted using ProLong®
Europe PMC Funders Author Manuscripts
Gold antifade with DAPI (Invitrogen). Image acquisition was performed using a Zeiss Observer Z1with LED illumination and appropriate emission filters.
MTO enzyme assay
MTO enzymatic activity was measured by incubating cell homogenates or plasma in closed bottles and measuring the disappearance of added MT via headspace GC analysis. The use of new glassware proved essential for obtaining low and reproducible background
measurements. To compare MTO activity in fibroblast- and colon cell lines, we used three ml Exetainer vials (Labco Limited). Cell homogenates (400-700 μl, equivalent to 0.75 - 1.85 mg of protein) were transferred in the vials and ZnSO4 (0.2 mM final concentration) was added to trap H2S produced by MTO. This concentration was found not to inhibit the MTO enzymatic activity. After closing the bottles 12-25 μl of a freshly prepared MT stock solution (0.82 mM) was added by syringe, resulting in a MT concentration in the liquid phase of 12-23 μM. Vials were horizontally shaken at 200 rpm and 35 ºC. For MT analysis 100 μl gas samples were taken by syringe and determined by GC analysis. Because of the reactivity of MT, mainly oxidation into dimethyldisulfide, we always detected low levels of MT
disappearance in control bottles without added enzyme. These rates were subtracted from experimental rates. For MTO activity measurements in erythrocytes and mouse tissue extracts the standard assay was performed in 250 ml screw cap serum bottles (neck size 28 mm ID). This allowed bigger gas samples to be taken for GC analysis with less effects of changing the gas volume and septum leakage. Also background MT disappearance was much lower. Bottles with 25 ml of PBS containing ZnSO4 (0.2 mM) and BSA (0.3mg/ml) were closed with red rubber septa and incubated at 350 rpm at 35 ºC. Four nmoles of MT were added, resulting in about 50 nM in the liquid phase. For the determination of the reaction stoichiometry and the oxygen dependency higher MT concentrations were used (20 - 75 nmoles, giving 250-950 nM MT in the liquid). After preincubation with MT for 15 - 20 min. the MTO reaction was started by the addition of erythrocytes or tissue extracts which were diluted in 1 ml PBS. Gas samples (1 ml) were taken every 1.5 - 4 min. for GC analysis. The lower limit of detection for MTO activity in erythrocytes was 0.01 nmol.μl -1.h-1, in fibroblasts 0.5 nmol.mg protein-1.h-1 and in mouse tissue extracts 1 nmol.mg protein-1.h-1. To study the kinetics of MTO in erythrocytes and colon cells the assay was scaled up to 500 ml serum bottles with 50 ml PBS. The amount of MTO added was adjusted in a way to obtain a reliable MT consumption rate over a period of about 10 -20 min.
At the end of the incubations with fibroblasts Zn-trapped H2S was released by the addition HCl to a final concentration of 0.1M using a syringe and shaking the bottles for ten min. at 25 ºC to reach gas-liquid equilibration for H2S. The resulting H2S concentration was determined in the headspace by GC analysis. Total H2S was calculated by assuming a gas/ liquid concentration ratio for H2S of 1 : 2.47 which was calculated from reported solubility data 64. Addition of Zn traps the H2S that otherwise builds up in time and inhibits the MTO enzyme reaction.
The gas/liquid ratio for the concentration of MT in PBS at 35 ºC was determined at 1: 5.5. This was calculated from the amount of MT that dissolved in the liquid after addition of a fixed amount of MT to a closed 50 ml bottle that contained 10 ml of PBS. The dissolved
Europe PMC Funders Author Manuscripts
amount was determined by comparing the headspace MT concentration of the gas phase in this bottle with the gas phase MT concentration in an empty bottle (so without PBS) that received the same amount of MT. A slightly different ratio of 1:5 was obtained when using PBS in 250 ml bottles to which also BSA (0.3 mg.ml-1) was added. For sulfide a gas/liquid ratio of 1: 12.5 was obtained in such bottles. After acidification a value of 1: 5.5 was found and this is much lower than expected at 35 ºC (1:2) 64. We attributed the higher amount of sulfide dissolved to the presence of BSA for which adsorption of sulfide has been suggested 65.
The BRENDA database was accessed at: http://www.brenda-enzymes.org/.
To determine DMS in mouse plasma 200 μl samples were introduced via a septum into a closed glass syringe with 3 ml of air that was preincubated at 70 °C in a waterbath and incubated for another 5 minutes with intermittent shaking. At 70 °C most of the DMS from the sample is in the gas phase. 2.6 ml of gas phase was transferred into a 3 ml syringe and analyzed by GC. From water samples with DMS, >80% was recovered in this way. The DMS lower limit of detection was 1.5 nM.
Data Availability
Data that support the findings of this study are available from the corresponding author upon reasonable request.
Supplementary Material
Refer to Web version on PubMed Central for supplementary material.
Acknowledgements
The authors gratefully thank the patients and families for their help in this study. The contribution of W. Lehnert, I. Goldschmidt and C. von Schnakenburg to early investigations on family A is gratefully acknowledged. M. Antoine and T van Alen are kindly acknowledged for their technical expertise and Ö. Eyice-Broadbent for the work to identify the bacterial MTO. G. Linthorst, F. Wijburg and H. Blom are acknowledged for their help in obtaining good quality patient samples. The authors thank P. Klaren for statistical consultation. The work was supported by the following grants: UK Biotechnology and Biological Sciences Research Council grant to H. Schäfer (reference BB/ H003851/1), an ERC-grant to H. Op den Camp (ERC 669371-Volcano) and a grant from the E.C. Noyons foundation to R. Wevers.
References
1. Tangerman A, Winkel EG. The portable gas chromatograph OralChroma: a method of choice to detect oral and extra-oral halitosis. J Breath Res. 2008; 2 017010.
2. Tangerman A, Winkel EG. Intra- and extra-oral halitosis: finding of a new form of extra-oral blood-borne halitosis caused by dimethyl sulphide. J Clin Periodontol. 2007; 34:748–55. [PubMed: 17716310]
3. Tangerman A, Winkel EG. Extra-oral halitosis: an overview. J Breath Res. 2010; 4 017003. 4. Harvey-Woodworth CN. Dimethylsulphidemia: the significance of dimethyl sulphide in extra-oral,
blood borne halitosis. Br Dent J. 2013; 214:E20. [PubMed: 23579164]
5. Szabo C, et al. Regulation of mitochondrial bioenergetic function by hydrogen sulfide. Part I. Biochemical and physiological mechanisms. Br J Pharmacol. 2014; 171:2099–122. [PubMed: 23991830]
Europe PMC Funders Author Manuscripts
6. He X, Slupsky CM. Metabolic fingerprint of dimethyl sulfone (DMSO2) in microbial-mammalian co-metabolism. J Proteome Res. 2014; 13:5281–92. [PubMed: 25245235]
7. Blom HJ, Tangerman A. Methanethiol metabolism in whole blood. J Lab Clin Med. 1988; 111:606– 10. [PubMed: 3373106]
8. Walker V, Mills GA, Fortune PM, Wheeler R. Neonatal encephalopathy with a pungent body odour. Arch Dis Child Fetal Neonatal Ed. 1997; 77:F65–6. [PubMed: 9279187]
9. Engelke UF, et al. Dimethyl sulfone in human cerebrospinal fluid and blood plasma confirmed by one-dimensional (1)H and two-dimensional (1)H-(13)C NMR. NMR Biomed. 2005; 18:331–6. [PubMed: 15996001]
10. Yamagishi K, et al. Generation of gaseous sulfur-containing compounds in tumour tissue and suppression of gas diffusion as an antitumour treatment. Gut. 2012; 61:554–61. [PubMed: 21836027]
11. Machado RF, et al. Detection of lung cancer by sensor array analyses of exhaled breath. Am J Respir Crit Care Med. 2005; 171:1286–91. [PubMed: 15750044]
12. Li Z, et al. Real-time ultrasensitive VUV-PIMS detection of representative endogenous volatile markers in cancers. Cancer Biomark. 2016; 16:477–87. [PubMed: 27062705]
13. Buszewski B, Ulanowska A, Kowalkowski T, Cieslinski K. Investigation of lung cancer biomarkers by hyphenated separation techniques and chemometrics. Clin Chem Lab Med. 2011; 50:573–81. [PubMed: 22035139]
14. Pol A, Op den Camp HJ, Mees SG, Kersten MA, van der Drift C. Isolation of a dimethylsulfide-utilizing Hyphomicrobium species and its application in biofiltration of polluted air.
Biodegradation. 1994; 5:105–12. [PubMed: 7765115]
15. Eyice O, et al. Bacterial SBP56 identified as a Cu-dependent methanethiol oxidase widely distributed in the biosphere. ISME Journal. In Press.
16. Raucci R, et al. Structural and functional studies of the human selenium binding protein-1 and its involvement in hepatocellular carcinoma. Biochim Biophys Acta. 2011; 1814:513–22. [PubMed: 21338716]
17. Bansal MP, et al. DNA sequencing of a mouse liver protein that binds selenium: implications for selenium's mechanism of action in cancer prevention. Carcinogenesis. 1990; 11:2071–3. [PubMed: 2225343]
18. Bansal MP, Oborn CJ, Danielson KG, Medina D. Evidence for two selenium-binding proteins distinct from glutathione peroxidase in mouse liver. Carcinogenesis. 1989; 10:541–6. [PubMed: 2924398]
19. Jerome-Morais A, et al. Inverse association between glutathione peroxidase activity and both selenium-binding protein 1 levels and Gleason score in human prostate tissue. Prostate. 2012; 72:1006–12. [PubMed: 22072582]
20. Ansong E, et al. Evidence that selenium binding protein 1 is a tumor suppressor in prostate cancer. PLoS One. 2015; 10:e0127295. [PubMed: 25993660]
21. Chen G, et al. Reduced selenium-binding protein 1 expression is associated with poor outcome in lung adenocarcinomas. J Pathol. 2004; 202:321–9. [PubMed: 14991897]
22. Willemsen MA, Engelke UF, van der Graaf M, Wevers RA. Methylsulfonylmethane (MSM) ingestion causes a significant resonance in proton magnetic resonance spectra of brain and cerebrospinal fluid. Neuropediatrics. 2006; 37:312–4. [PubMed: 17236113]
23. Suylen GMH, Large PJ, van Dijken JP, Kuenen JG. Methyl mercaptan oxidase, a key enzyme in the metabolism of methylated sulphur compounds by Hyphomicrobium EG. Journal of General Microbiology. 1987; 133:2989–2997.
24. Gould WD, Kanagawa T. Purification and Properties of Methyl Mercaptan Oxidase from Thiobacillus-Thioparus Tk-M. Journal of General Microbiology. 1992; 138:217–221.
25. Pohl NM, et al. Transcriptional regulation and biological functions of selenium-binding protein 1 in colorectal cancer in vitro and in nude mouse xenografts. PLoS One. 2009; 4:e7774. [PubMed: 19924303]
26. Jeong JY, Wang Y, Sytkowski AJ. Human selenium binding protein-1 (hSP56) interacts with VDU1 in a selenium-dependent manner. Biochem Biophys Res Commun. 2009; 379:583–8. [PubMed: 19118533]
Europe PMC Funders Author Manuscripts
27. Miyaguchi K. Localization of selenium-binding protein at the tips of rapidly extending protrusions. Histochem Cell Biol. 2004; 121:371–6. [PubMed: 15108003]
28. Tangerman A, Meuwese-Arends MT, Jansen JB. Cause and composition of foetor hepaticus. Lancet. 1994; 343:483. [PubMed: 7905979]
29. Besouw M, Tangerman A, Cornelissen E, Rioux P, Levtchenko E. Halitosis in cystinosis patients after administration of immediate-release cysteamine bitartrate compared to delayed-release cysteamine bitartrate. Mol Genet Metab. 2012; 107:234–6. [PubMed: 22832073]
30. Mudd SH, et al. Isolated persistent hypermethioninemia. Am J Hum Genet. 1995; 57:882–92. [PubMed: 7573050]
31. Glatt SJ, et al. Comparative gene expression analysis of blood and brain provides concurrent validation of SELENBP1 up-regulation in schizophrenia. Proc Natl Acad Sci U S A. 2005; 102:15533–8. [PubMed: 16223876]
32. Kanazawa T, et al. The utility of SELENBP1 gene expression as a biomarker for major psychotic disorders: replication in schizophrenia and extension to bipolar disorder with psychosis. Am J Med Genet B Neuropsychiatr Genet. 2008; 147B:686–9. [PubMed: 18163446]
33. Prabakaran S, et al. 2-D DIGE analysis of liver and red blood cells provides further evidence for oxidative stress in schizophrenia. J Proteome Res. 2007; 6:141–9. [PubMed: 17203958] 34. Furne J, Springfield J, Koenig T, DeMaster E, Levitt MD. Oxidation of hydrogen sulfide and
methanethiol to thiosulfate by rat tissues: a specialized function of the colonic mucosa. Biochem Pharmacol. 2001; 62:255–9. [PubMed: 11389886]
35. Chang PW, et al. Isolation, characterization, and chromosomal mapping of a novel cDNA clone encoding human selenium binding protein. J Cell Biochem. 1997; 64:217–24. [PubMed: 9027582] 36. Galvao J, et al. Unexpected low-dose toxicity of the universal solvent DMSO. FASEB J. 2014;
28:1317–30. [PubMed: 24327606]
37. Finkel T. Oxidant signals and oxidative stress. Curr Opin Cell Biol. 2003; 15:247–54. [PubMed: 12648682]
38. Barr LA, Calvert JW. Discoveries of hydrogen sulfide as a novel cardiovascular therapeutic. Circ J. 2014; 78:2111–8. [PubMed: 25131384]
39. Wallace JL, Wang R. Hydrogen sulfide-based therapeutics: exploiting a unique but ubiquitous gasotransmitter. Nat Rev Drug Discov. 2015; 14:329–45. [PubMed: 25849904]
40. Bos EM, van Goor H, Joles JA, Whiteman M, Leuvenink HG. Hydrogen sulfide: physiological properties and therapeutic potential in ischaemia. Br J Pharmacol. 2015; 172:1479–93. [PubMed: 25091411]
41. Banerjee R. Catalytic promiscuity and heme-dependent redox regulation of H2S synthesis. Curr Opin Chem Biol. 2017; 37:115–121. [PubMed: 28282633]
42. Yang H, Nevo E, Tashian RE. Unexpected expression of carbonic anhydrase I and selenium-binding protein as the only major non-heme proteins in erythrocytes of the subterranean mole rat (Spalax ehrenbergi). FEBS Lett. 1998; 430:343–7. [PubMed: 9688568]
43. Ringrose JH, et al. Highly efficient depletion strategy for the two most abundant erythrocyte soluble proteins improves proteome coverage dramatically. J Proteome Res. 2008; 7:3060–3. [PubMed: 18494517]
44. Wagner CA. Hydrogen sulfide: a new gaseous signal molecule and blood pressure regulator. J Nephrol. 2009; 22:173–6. [PubMed: 19384833]
45. Yang J, et al. Erythrocytic hydrogen sulfide production is increased in children with vasovagal syncope. J Pediatr. 2015; 166:965–9. [PubMed: 25641243]
46. Yang W, Diamond AM. Selenium-binding protein 1 as a tumor suppressor and a prognostic indicator of clinical outcome. Biomark Res. 2013; 1:15. [PubMed: 24163737]
47. Mochalski P, et al. Release and uptake of volatile organic compounds by human hepatocellular carcinoma cells (HepG2) in vitro. Cancer Cell Int. 2013; 13:72. [PubMed: 23870484]
48. Fang W, et al. Functional and physical interaction between the selenium-binding protein 1 (SBP1) and the glutathione peroxidase 1 selenoprotein. Carcinogenesis. 2010; 31:1360–6. [PubMed: 20530237]
Europe PMC Funders Author Manuscripts
49. Baliga MS, et al. Selenoprotein deficiency enhances radiation-induced micronuclei formation. Mol Nutr Food Res. 2008; 52:1300–4. [PubMed: 18720346]
50. Lubos E, Loscalzo J, Handy DE. Glutathione peroxidase-1 in health and disease: from molecular mechanisms to therapeutic opportunities. Antioxid Redox Signal. 2011; 15:1957–97. [PubMed: 21087145]
51. Jezierski T, Walczak M, Ligor T, Rudnicka J, Buszewski B. Study of the art: canine olfaction used for cancer detection on the basis of breath odour. Perspectives and limitations. J Breath Res. 2015; 9 027001.
52. Tamura K, Stecher G, Peterson D, Filipski A, Kumar S. MEGA6: Molecular Evolutionary Genetics Analysis version 6.0. Mol Biol Evol. 2013; 30:2725–9. [PubMed: 24132122]
53. Tangerman A, Meuwese-Arends MT, van Tongeren JH. A new sensitive assay for measuring volatile sulphur compounds in human breath by Tenax trapping and gas chromatography and its application in liver cirrhosis. Clin Chim Acta. 1983; 130:103–10. [PubMed: 6851177]
54. Wevers RA, Engelke U, Heerschap A. High-resolution 1H-NMR spectroscopy of blood plasma for metabolic studies. Clin Chem. 1994; 40:1245–50. [PubMed: 8013094]
55. Wevers RA, et al. Standardized method for high-resolution 1H-NMR of cerebrospinal fluid. Clin Chem. 1995; 41:744–51. [PubMed: 7729054]
56. Moolenaar SH, et al. Prolidase deficiency diagnosed by 1H NMR spectroscopy of urine. J Inherit Metab Dis. 2001; 24:843–50. [PubMed: 11916317]
57. Derikx PJ, Op Den Camp HJ, van der Drift C, van Griensven LJ, Vogels GD. Odorous Sulfur Compounds Emitted during Production of Compost Used as a Substrate in Mushroom Cultivation. Appl Environ Microbiol. 1990; 56:176–80. [PubMed: 16348090]
58. Tangerman A. Determination of volatile sulphur compounds in air at the parts per trillion level by Tenax trapping and gas chromatography. J Chromatogr. 1986; 366:205–16. [PubMed: 3782318] 59. Kircher M, et al. A general framework for estimating the relative pathogenicity of human genetic
variants. Nat Genet. 2014; 46:310–5. [PubMed: 24487276]
60. Wortmann SB, et al. CLPB Mutations Cause 3-Methylglutaconic Aciduria, Progressive Brain Atrophy, Intellectual Disability, Congenital Neutropenia, Cataracts, Movement Disorder. Am J Hum Genet. 2015; 96:245–57. [PubMed: 25597510]
61. Vriend G. WHAT IF: a molecular modeling and drug design program. J Mol Graph. 1990; 8:52–6. 29. [PubMed: 2268628]
62. Krieger E, Koraimann G, Vriend G. Increasing the precision of comparative models with YASARA NOVA--a self-parameterizing force field. Proteins. 2002; 47:393–402. [PubMed: 11948792] 63. Renkema GH, et al. SDHA mutations causing a multisystem mitochondrial disease: novel
mutations and genetic overlap with hereditary tumors. Eur J Hum Genet. 2015; 23:202–9. [PubMed: 24781757]
64. Douabul AA, Priley JP. Solubility of gases in distilled water and seawater. 5. Hydrogen sulfide. Deep-sea Research. 1979; 26:259–268.
65. Tan B, et al. New method for quantification of gasotransmitter hydrogen sulfide in biological matrices by LC-MS/MS. Sci Rep. 2017; 7 46278.
Europe PMC Funders Author Manuscripts
Figure 1. Sulfur metabolism
Diet, bacterial metabolism and endogenous metabolism contribute to the levels of MT, DMS, DMSO and DMSO2 and catabolites in the body. The main conversion of MT to H2O2, formaldehyde and H2S by the enzyme MTO (indicated by the cross) is deficient in the patients. The lower part shows the MTO reaction. All underlined metabolites have been confirmed in our assay.
Europe PMC Funders Author Manuscripts
Figure 2. Extra-oral halitosis families
Panel A, Schematic representation of the family trees of the affected families. Double horizontal line in families A and B indicate consanguineous marriages. Dark symbols represent affected individuals, crossed out symbols are deceased individuals.
Panels B and C, One-dimensional 1H-NMR spectroscopy of human plasma measured at pH 2.50. Plasma from patient CII-2 (B) and a control sample (C). The spectra illustrate the increased concentration of DMSO2 in the patient. For quantitative data see Table 1B.
Europe PMC Funders Author Manuscripts
Figure 3. Analysis of missense mutations in SELENBP1
Panel A, Neighbor-Joining phylogenetic tree of methanethiol oxidases and putative selenium-binding proteins. The evolutionary distances were computed using the Dayhoff matrix based method and are in the units of the number of amino acid substitutions per site. Bootstrap values (500 replicates) are shown next to the branches for values > 60.
Evolutionary analyses were conducted in MEGA6 52.
Panel B, The SELENBP1 sequence was modeled on the X-ray structure of the hypothetical selenium-binding protein from Sulfolobus tokodaii (PDB ID: 2ECE). The protein forms a
Europe PMC Funders Author Manuscripts
typical WD40 fold. The positions of the mutations Gly225Trp (on the right) and His329Tyr (on the left) are indicated in red.
Panel C, Detail of the amino acid changes that are found in family C. Green residue is the original, red the replacement in the patients.
Panel D, Alignments of the regions of SELENBP1 of multiple species indicating the conserved residues found mutated in family C. The amino acid numbering is according to the human sequence. Asterisk indicates a fully conserved residue, colon indicates conservation between amino acids of strongly similar properties, period indicates conservation between amino acids of weakly similar properties.
Europe PMC Funders Author Manuscripts
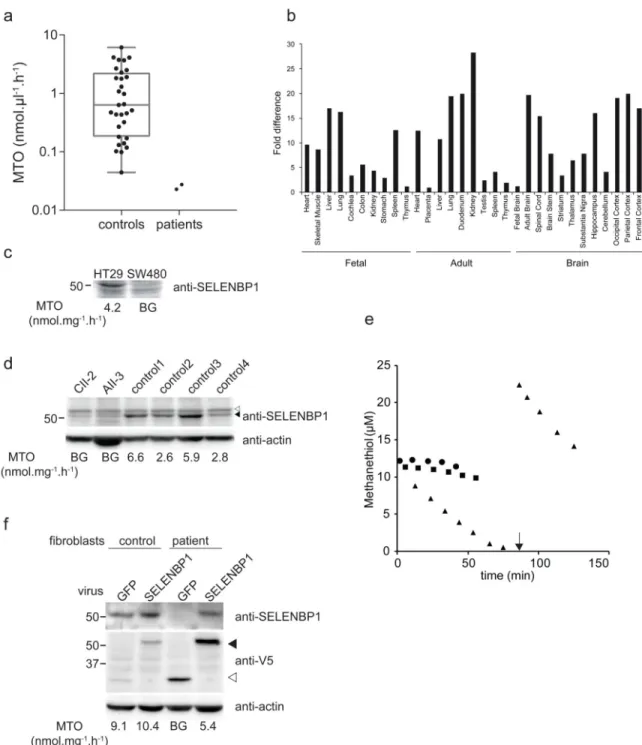
Figure 4. Analysis of SELENBP1 expression and MTO activity in human cell lines
Panel A, MTO activity in human erythrocytes in control (n=30) versus patients AII-3 and CII-2. Box indicates the median and the 25 - 75 percentile, whiskers indicate the minimal and maximal value. Panel B, SELENBP1 mRNA expression in human fetal and adult tissues. Presented as fold change in comparison to the tissue with the lowest expression level.
Panel C, Anti-SELENBP1 Western blot analysis in HT29 (high expression) and SW480 (low expression) colon cancer cell lines. Panel D, Western blot analysis of patient (CII-2 and
Europe PMC Funders Author Manuscripts
AII-3) and 4 control fibroblast cell lines. Upper panel: anti-SELENBP1. ▲, SELENBP1; △, non-specific band. Lower panel: loading control (anti-actin).
Panel E: Progress curve of MTO activity. ▲, control fibroblast C5120); ■, patient AII-3
●,control incubation without protein added. At t = 0 MT was added to all samples; the
arrow indicates a second addition of MT to the control fibroblasts when the substrate was depleted, resulting in restoration of the initial activity, indicating that the enzyme was still fully functional.
Panel F: Lentiviral complementation of patient and control fibroblast using SELENBP1-V5 viruses shows restoration of the MTO activity. As a control GFP-V5 encoding viruses were used. Upper panel: Western blot analysis of SELENBP1 expression (anti-SELENBP1). Middle panel: Western blot analysis of the exogenous expressed V5 tagged proteins (closed arrowhead is SELENBP1-V5, open arrowhead is GFP-V5). Lower panel: loading control (anti-actin).
In panels C, D and F the MTO activity of each sample is indicated below the lanes. BG = background, below 0.5 nmol.mg protein-1.h-1.
Europe PMC Funders Author Manuscripts
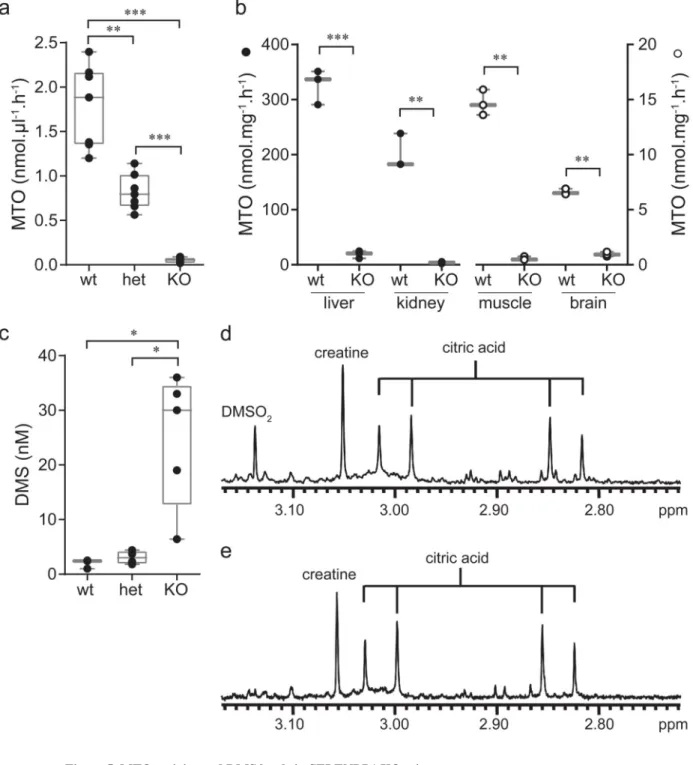
Figure 5. MTO activity and DMS levels in SELENBP1 KO mice
Panel A, MTO activity in erythrocyte extracts from SELENBP1 KO, heterozygous and wild type animals (n=7 for each group). MTO activity in erythrocytes of the SELENBP1 KO animals were at or under the level of detection.
Panel B, MTO activities were determined in homogenates of mouse tissues of both SELENBP1 KO and wild type animals (n=3 for each tissue and each genotype). Black symbols are plotted on the left Y-axis, open symbols on the right Y-axis. MTO activities in the muscle and brain of the SELENBP1 KO animals were at or under the level of detection.
Europe PMC Funders Author Manuscripts
Panel C, DMS levels in mouse plasma was determined from the SELENBP1 KO (n=5) as well as heterozygous (n=4) and wild type animals (n=3).
For panels A, B and C, Boxes indicate the median and the 25 - 75 percentile, whiskers indicate the minimal and maximal values. Statistical analysis was performed with GraphPad Prism using a two-sided unpaired t test with Welch's correction. ***, p<0.001; **, p<0.01; *, p<0.05.
Panels D and E, Representative one-dimensional 1H-NMR spectroscopy of mouse plasma samples measured at pH 2.50. Plasma from a KO animal (D) and a wild type sample (E). The spectra illustrate the increased concentration of DMSO2 in the SELENBP1 knock out animals.
Europe PMC Funders Author Manuscripts
Europe PMC Funders Author Manuscripts
Europe PMC Funders Author Manuscripts
Table 1 MT, DMS, DMSO and DMSO2 levels in patients.
A MT
(ppb)
DMS (ppb)
Breath Ref. 0.05 +/- 0.05 (range 0.01–0.24) 6.1 +/- 4.5 (range 1-19)
AII-2 - 154/201 AII-3 2.6 251/246/200 BII-2 - 184 CII-1 - 30/34 CII-2 2.3 40/67/104 B DMS (nM) DMSO (μM) DMSO2 (μM) Blood Ref. < 7 < 1 <1-24 AII-2 192 - -AII-3 191/242 6 68 BII-2 185 4 36 CII-1 164 - -CII-2 156 - -CSF Ref. < 10 < 1 <1-25 AII-3 104/114 8 112 BII-2 - 8 41 DMS (nM) DMSO (μmol/mmol Cr) DMSO2 (μmol/mmol Cr) Urine Ref. <10 < 1 3-18 AII-2 194 30 54 AII-3 71-194** 31 47 BII-2 265/480 10 60 CII-1 - 4 31 CII-2 - 4 28
MT and DMS were measured using gas-chromatography and DMSO and DMSO2 were measured with NMR spectroscopy. Numbers separated by “/” are measurements on separate days. -, not determined.
Panel A: MT and DMS levels measured in exhaled breath. Reference ranges were obtained from 20 control persons sampled arbitrarily throughout the day (given as mean ± 1 SD and as well as range). The values from individual persons fluctuated during the day (up to a factor of 10), these values are all included in the reference range. The DMS reference range corresponds to the range previously published 2,53.
Panel B: DMS, DMSO and DMSO2 levels in body fluids of the affected patients and controls. Reference ranges for DMSO2 have been described in Engelke et al 9. DMS was measured in blood, DMSO and DMSO2 in plasma. **: range of measurements on different time points during the day.