junho de 2015
Daniel Faria Gomes de Oliveira
Perceptions of inequity and its influence
on the reservation wage
Universidade do Minho
Escola de Psicologia
Dissertação de Mestrado
Mestrado Integrado em Psicologia
Trabalho realizado sob orientação do
Professor Doutor José Bernardo Bicudo Azeredo Keating
junho de 2015
Daniel Faria Gomes de Oliveira
Perceptions of inequity and its influence
on the reservation wage
Universidade do Minho
Escola de Psicologia
DECLARAÇÃO
Nome: Daniel Faria Gomes de Oliveira
Endereço eletrónico: [email protected]
Número do bilhete de identidade: 14167178
Título da dissertação: Perceptions of inequity and its influence on the reservation wage
Orientador: Professor Doutor José Bernardo Bicudo Azeredo Keating
Ano de conclusão: 2015
Designação do Mestrado: Mestrado Integrado em Psicologia
É AUTORIZADA A REPRODUÇÃO INTEGRAL DESTA DISSERTAÇÃO APENAS PARA EFEITOS DE INVESTIGAÇÃO, MEDIANTE DECLARAÇÃO ESCRITA DO INTERESSADO, QUE A TAL SE COMPROMETE.
Universidade do Minho, 12/06/2015
II
Index
Introduction ... 6
Method ... 10
Participants ... 10
Variables and instruments ... 10
Procedures ... 12
Data analyses ... 12
Results ... 13
Conclusion ... 15
Limitations ... 18
Future research suggestions ... 18
III
Acknowledgements
I found many difficulties while completing this dissertation but with the help of a few persons I was able to overcome them. I would like to first thank the ones that were more involved in its making by thanking professor José Keating for the continuous mentoring and exchange of ideas and by thanking the members of our research group, Maria Paiva, Inês Soares, Soraia Gonçalves, Marco Pinheiro, Cláudia Ribeiro, Tânia Ferreira, Daniela Costa and Isabel Coelho that helped the growth of this project. In order to realize this experiment I needed money for the assessment of the reservation wage and was only able to get it with the help of many friends and strangers that bought our merchandising, which I am very thankful for and whose contribution made this possible. I would also like to thank the company that made our merchandising, the TPJM, by helping with the prices. I’m thankful to my roommates, Simão Moreira, Diogo Rio and João Mendes, that from time to time would try to drive my attention away from all this or to make me focus on it, depending on what I would need at the time. I’m also thankful to Juliana Rodrigues, by being able to listen to all my troubles, every step of this project. And last but definitely not least, I’m thankful to my family that helped me continue my studies and reach the end of this course.
IV
Resumo
Perceções de iniquidade e a sua influência no salário de reserva.
Sabemos que o salário de reserva corresponde à menor quantia de dinheiro que estamos dispostos a receber pelo nosso trabalho, uma variável bastante estudada em indivíduos desempregados. Contudo, não temos muita informação sobre as possíveis modificações no salário de reserva enquanto estamos empregados ou a realizar uma tarefa. Temos como objetivo verificar se estas mudanças existem quando percecionamos iniquidade no nosso salário, em comparação com outros. As nossas hipóteses esperam mudanças no comportamento e cognição de forma a restaurar a equidade, tal como indicado na teoria da iniquidade. Modificamos uma tarefa usada no estudo de Ariely e colaboradores, com dois grupos experimentais em que num os sujeitos percecionavam iniquidade positiva, sendo-lhes dito que estavam a receber mais dinheiro pela tarefa, e noutro os sujeitos percecionavam iniquidade negativa, sendo-lhes dito que estavam a receber menos dinheiro pela tarefa, e um grupo de controlo cujos sujeitos não percecionavam qualquer iniquidade. Os resultados não confirmaram as hipóteses. Sujeitos do primeiro grupo mostraram um salário de reserva menor enquanto os sujeitos do segundo grupo parecem restaurar a equidade através de outros meios. Sugestões para experiências futuras foram dadas para confirmar as possíveis explicações para os resultados.
Palavras-chave: iniquidade, salário de reserva, dinheiro, iniquidade positiva, iniquidade
V
Abstract
Perceptions of inequity and its influence on the reservation wage.
We know that the reservation wage, a variable well studied on unemployed individuals, stands for the minimum amount of money that we are willing to accept for our work. However, we don’t have much information about the possible changes in our reservation wage while we are employed or performing a task. Our objective is to verify if these changes exist when we perceive inequity in our salary, in comparison with others. Our hypotheses predict a behavioral and cognitive change in order to restore equity, as stated in the theory of inequity. We modified a task used in Ariely and colleagues’ study, with two experimental groups: in one condition the subjects perceived positive inequity, by being told that they were earning more money for the task, and in the other, subjects perceived negative inequity, by being told that they were earning less money for the same task, and one control group whose subjects didn’t perceive any inequity. Contrary to predictions, subjects from the first group showed a lower reservation wage while subjects from the second group seem to restore equity by other means. Future research suggestions were given to confirm possible explanations for the results.
6
Introduction
An individual’s reservation wage stands for the minimum quantity of money he’s willing to accept for a task or a job. This concept reflects on our decision making when it comes to accepting or refusing a job offer, which is the reason why it has been more studied in economics, especially in the field of unemployment. The individual’s participation in the labor market is dependent on his reservation wage, because if the market wage is below the reservation wage, the individual will not work at all (Borjas, 2012). We also know that certain factors influence our reservation wage. Prasad (2003), for example, shows us that the unemployed Germans’ reservation wage is larger in men and is positively related to the level of education, the unemployment compensation (if the subjects are actively looking for a job), other sources of income, having a house and the salary before being unemployed, and is negatively related to the presence of employed people in the same house and with the person’s skill level.
However, there isn’t much literature about the reservation wage on employed individuals. It is relevant to study this subject on an employed situation or performing a paid task, as Ariely, Kamenica and Prelec (2008) noted while showing that certain characteristics of a task, like its meaning, can change our reservation wage. According to these authors, individuals whose work was acknowledged had a lower reservation wage, compared to individuals whose work was ignored or destroyed. Therefore, it is necessary to identify factors that may change our reservation wage while employed, because if there is an increase while in a job we may stop supplying work hours, like Borjas (2012) mentioned.
The influence perceived inequity has on the reservation wage is unsure, but many workers perceive inequalities in employment. Homans (1961) developed the concept of distributive justice, defining it as something that is obtained in an exchange relationship in which profits to each side are proportional to the investments. Adams (1965) follows up this theory of distributive justice and complements it with the theory of inequity. This author states that an individual (person A) perceives inequity when the ratio of his outcomes (rewards) to his inputs (effort, education, intelligence, experience, etc.) in a relationship, is different from the same ratio of a comparison other (person B):
𝐴 𝑂𝑢𝑡𝑐𝑜𝑚𝑒𝑠 𝐴 𝐼𝑛𝑝𝑢𝑡𝑠 ≠
𝐵 𝑂𝑢𝑡𝑐𝑜𝑚𝑒𝑠 𝐵 𝐼𝑛𝑝𝑢𝑡𝑠
This can happen in a direct trade with another person or when both are in a trade relationship with a third person and the individual is comparing himself with the other. Adams also stated that the greater the inequity the person perceives, the more distress s/he feels, and the greater the distress, the harder s/he will work in order to restore equity and, thus, reduce the distress. Inequity can happen when the individual perceives that his ratio is larger (positive inequity) or smaller (negative inequity) than the comparison other. The means to reduce inequity include modifying or cognitively distorting inputs / outcomes of himself or the comparison other,
7
changing the comparison other, or leaving the field / terminating the relationship, but it is unlikely that all means are psychologically available to the individual.
Which means are used to restore equity changes according to the type of inequity they perceive. When a person perceives a negative inequity situation, s/he tends to decrease inputs. An example set by Clark (1958) tells us about bundlers in this situation who resorted to slowing down the pace in which they filled the shopping bags. In other words, they decreased their effort in the task. However, individuals will not produce less in a piece-rate system because it would increase inequity by being paid even less. In these cases, as Goodman and Friedman (1971) refer in their examination of Adam’s theory of inequity, persons will produce more than in an equity situation but will decrease their work quality. This way, they increase their outcomes (money earned) and decrease their input (work quality), in order to restore equity.
In a positive inequity situation, however, people tend to increase inputs. Arrowhood (1961) demonstrated that participants pre-paid for 3 hours of labor that perceived to be earning a larger than expected reward (positive inequity), tended to work for more than 3 hours. Again, this will depend on how participants are paid. In a piece-rate system, individuals who feel they are in a positive inequity situation will produce less compared to others who feel they are in an equity situation. If they increased productivity they would increase their reward, which would in turn increase their outcomes and hence their distress. They would work with more quality, however, in order to provide more input for the same outcome.
Adams and Jacobsen (1964) give support to this hypothesis by creating a positive inequity situation in a proofreading task, in which participants would earn money for each page they could complete: productivity was lower in cases where the perception of positive inequity was stronger and participants would find more errors in each page (including pointing out words that were correct as incorrect).
According to Adams (1965) and as stated before, individuals may also cognitively distort their inputs and/or outcomes or the comparative other’s, in the same direction as stated earlier. Finally, individuals may not cognitively change their inputs and/or outcomes, but can alter their importance or relevance in order to reduce inequity.
There are certain conditions that govern the adoption of forms to reduce inequity. Adams (1965, p. 295-296) adanced six propositions about these conditions: (a) Individuals will maximize positively valent outcomes and the valence of outcomes; (b) Individuals will minimize increasing inputs that are effortful and costly to change; (c) Individuals will resist real and cognitive changes that are central to their self-concept and self-esteem; (d) Individuals will be more resistant to changing cognitions about his own outcomes and inputs than to changing his cognitions about the comparison other’s outcomes and inputs; (e) leaving the field will be resorted to only when the magnitude of inequity experienced is high and other means of reducing it are unavailable. Absenteeism will occur more frequently and under
8
conditions of lower inequity; (f) Individuals will be highly resistant to changing the subject of his comparison other, once it is stabilized over time and, in effect, has become an anchor.
Adams’ theory received some criticism over its concept of fairness and allocation of rewards. This criticism has led to another perspective on the equity theory, which brought forth the equity sensitivity construct. This construct suggests that there are individual differences on how individuals allocate rewards to themselves and/or others, as well as how they react to inequitable treatment (Huseman, Hatfield & Miles, 1987). Although it proposes that individuals react in a consistent way, it also tells us that there are individual differences in reactions to equity and inequity because people have different preferences for equity. This construct divides people into three classes based on their preferences: (a) Benevolents, who prefer their outcome/input ratios to be less than the comparison other; (b) Equity Sensitives, who prefer their outcome/input ratios to be equal to the comparison other; and (c) Entitleds, who prefer their outcome/input ratios to exceed the comparison other’s. (Huseman, et al., 1987, p. 223).
These authors also predict job satisfaction levels for equity sensitivity orientations, in which individuals should report more satisfaction when they perceive to be in the situation they prefer, and the least satisfaction if they perceive to be in an opposite situation of what they prefer. The authors go further and predict results based on quality and quantity work research, that include: “(1) on a piece-rate system, Entitleds consistently will produce at a higher level, but the quality of their work will be consistently low; (2) under the equitably-rewarded condition on a piece-rate system, Benevolents will produce the highest quality work; (3) on a salary or wage, Benevolents will produce consistent quality and quantity under all three reward conditions; (4) for Benevolents, absenteeism and turnover will be consistent regardless of reward level, Entitleds will have the highest absenteeism and turnover in the equitably-rewarded condition.”. (Huseman, et al., 1987, p. 230).
However, Shore (2004, p. 722) stated, “despite the growing interest in equity sensitivity, few studies have tested the key propositions of Huseman et al.’s (1985, 1987) theory”. This may not mean that they are not important propositions to consider since these individual differences may be a part of an explanation for consistently different or low power results (Huseman, et al., 1987, p. 230). However, Shore’s (2004) results showed a main effect in which pay satisfaction increases and turnover intention decreases as the reward level increases, and perceived pay fairness was highest in the equitably reward condition. This tells us that there are certain results that are equal regardless of the class they represent and it seems individuals are always more satisfied when receiving more.
As stated before, I am not aware of studies that focus both perceived inequities and the reservation wage, although Adams and Rosenbaum (1962) suggest that the need to restore equity is a stronger motivation than maximizing gains. My objective with this dissertation is to find out if these perceptions of inequity, both negative and positive, can influence the individual’s reservation wage, and if so, to find out if they aim to restore equity, as Adam’s theory predicts. In order to see if individuals try to restore equity by modifying their
9
reservation wage, it is also relevant to see if there are differences in terms of work quality or if a distortion in cognition exists, since individuals may restore equity by other means available, and not by the reservation wage. I modified the task made by Ariely, et al. (2008) to assess the reservation wage in a piece-rate situation. The importance of this question is the fact that the reservation wage may decide whether a worker stays or leaves an organization, and if the perception of inequity changes this variable then it may be an explanation for some of organization’s turnover, which raises the importance to assess workers’ perceptions of inequity. This study also aims to gain a better knowledge of what variables may change employed individual’s reservation wage, since it is not a well studied topic.
Despite its criticism, my hypotheses are based on Adams’ theory since we are trying to find main effects made by perceived inequities. They are the following:
H1 – Individuals in a perceived positive inequity situation will complete fewer pieces in order to not increase their outcomes, which results in a higher reservation wage than individuals in an equity situation.
H2 – Individuals in a perceived negative inequity situation will complete more pieces in order to increase their outcomes, which results in a lower reservation wage than individuals in an equity situation.
H3 – Individuals in a perceived positive inequity situation will perform their tasks better (with more quality) than individuals in an equity situation, in order to increase their inputs.
H4 – Individuals in a perceived negative inequity situation will perform their tasks worse (with lower quality) than individuals in an equity situation, in order to decrease their inputs.
H5 – Individuals in a perceived positive inequity situation will perceive that others do more pieces than them, in order to cognitively increase the comparison others outcomes.
H6 – Individuals in a perceived negative inequity situation will perceive that others do less pieces than them, in order to cognitively decrease the comparison others’ outcomes.
H7 – Individuals in a perceived positive inequity situation will perceive they performed better in the task than individuals in an equity situation
H8 – Individuals in a perceived negative inequity situation will perceive they performed worse in the task than individuals in an equity situation.
10
Method Participants
Our participants were students from University of Minho. These students were recruited by an email that stated our objective, the place and maximum duration of the experiment and a link for participants to enroll in the experiment. It also stated that participants would get less than 5 euro for participating. Although the maximum amount would certainly be less, we couldn’t inform of a smaller value in order for the procedure to work properly, which will be better explained in the variables section of this dissertation. The sample was composed by 80 participants, 24 (30%) male participants and 56 (70%) female (Mo = 2). The average age was 21,67 years old (SD = 4,608), varying between 18 and 45 years, and 8 (10%) participants had a job at the time, while 72 (90%) did not, although some participants had worked in jobs before for 13,41 months on average (SD = 41,829) ranging between 0 and 336 months. Since I had to induce deception on participants, psychology students on the 3rd grade and beyond were not accepted to grant a better probability for the deception effect to work since these students were more used to participate in various psychology experiences and had a significant theoretical knowledge of research in social psychology, while still accepting 1st and 2nd graders to get a bigger sample easier. The platform for University of Minho’s psychology students to enroll on experiments was not used because it uses a reward system based on the duration of the experiment, which in this experiment is a decision left to the participant, and because it uses university credit points as a reward and the experiment’s results are dependent on the money reward, so it may influence participant’s decision making while on the experiment. With two reward systems, participants’ perceived inequities may not create enough distress to them since they are equally rewarded in one of them and participants could focus on university credit points’ reward and not on money they earned, which would weaken the effect I am aiming for.
Variables and instruments
In order to measure the dependant variables, mentioned further in this study, I used a task similar to Ariely, et al. (2008), but with some modifications. I created 20 A4 sheets of paper with matrixes of random letters, which included fifteen horizontal pairs of “s” (“s s”) and 50 “v” letters” each, randomly scattered, that participants had to find and circle. A box was also used for participants to insert completed sheets, in order for them to not be able to touch these sheets after they thought they were completed.
Participants would get paid for each matrix they handed in (completed or not), starting at 40 euro cents and decreasing 3 cents for each new matrix. A table of remunerations (per matrix and cumulative) was in front of the participants.
Ariely, et al. (2008) used only ten pairs of “s” in their measure of the reservation wage. The changes made in this experiment were: I used the number of “v” letters that were found as a proxy for work quality, since they were not obliged to find all of them and did not know how
11
many of them were in each matrix; I increased the difficulty of the task (by increasing the number of pairs of “s” present in each matrix and by increasing the number of sheets that would reward the participant, so it would be more difficult to reach the last rewarded sheet) so that a normal distribution of the results would be easier to obtain; I eliminated round numbers on the cumulative remuneration values so there were no values more “attractive” than others that could influence participant’s decision to go on (this is a problem in Ariely, et al. (2008) and it would distort the reservation wage scale).
Fake remuneration tables were also made to deceit participants in both inequity conditions. I used a computer program that functioned as a timer setter to keep track of participants’ time spent doing the task. At the end of the experiment I gave a questionnaire asking demographic variables and four questions to assess participants perception of the task: (1) the percentage of “v” letters participants thought they found in the sheets they handed in; (2) the difficulty of the task, on a scale from 1 to 10; (3) the average number of sheets participants thought that everyone handed in; and (4) the percentage of “v” letters participants thought that everyone found in the sheets completed.
The dependant variables were the number of sheets completed / reservation wage, percentage of “v” letters found / work quality, the four answers to the questionnaire and the time spent. The type of inequity was the independent variable. Participants were randomly assigned to one of three groups that represented those types, which are: (1) equity (N = 26); (2) positive inequity (N = 27); and (3) negative inequity (N = 27). The first group is the control group since these participants won’t perceive any inequity. The second group was an experimental group, whose participants were told they would receive more money than others for the same work. Besides the true remuneration table, there was a fake table which represented the table the other participants would supposedly follow with less than 50% on the value of the rewards. The third group was also an experimental group, and participants were told they would receive less money than others for the same work, they also had a fake table of remuneration supposedly for the other participants, which showed an increase of around 50% on the value of the reward (hence the reason why I couldn’t say in the recruitment email a value smaller than 5 euro).
The use of real money in this experiment was an important factor, since most research papers on distributive justice refer its use, along with Ariely, et al.’s (2008) study, which task I use as a reference. The concept of reservation wage also largely involves extrinsic motivation, and if a system by points or hypothetical money was used the results might not be the same since these are more connected to intrinsic motivation only and motivation has a crucial role in our decision to keep working, so the best condition would be the one that simulates the desired motivation better.
12
Procedures
Participants’ division to one of the three groups was done according to their arrival, changing group allocation with each participant in a consistent matter, in order to respect a random allocation and an equilibrated amount of participants for each group.
Each participant did the experiment inside a soundproof booth in order to isolate them from the environment and focus them on the task. The isolated booths also facilitate data collection by having more than one participant doing the experiment at the same time without mutual interferences. Inside each booth, I read the instructions to the participants and asked if they had questions before they started. Participants would then have to complete the letter matrixes by finding all fifteen pairs of “s” (“s s”) and the maximum “v” letters they could find, without informing them that there were 50 in total. After they completed a sheet they had to insert it inside the box that was beside them and only then they could start another one. Participants decided when the experiment stopped and how much they would earn, but they were also told they had a limit of one hour and that I would start the timer once I left the booth. After the experiment ended, they were given the questionnaire. All participants did exactly the same task, following the same remuneration table, differing only on the perception of inequity.
After the experiment was done, I paid participants the amount of money corresponding to the number of sheets they handed in, along with an explanation of the experiment, explaining that there were no inequities and asking them not to share that information with other students. After all data collection and data analyses, an email containing more detailed information about the experiment and the results was sent. This procedure was done according to the Ethics Code of the Order of Portuguese Psychologists (2011) and although participants were deceived in the beginning, only a perceived inequity was used and not a real one, which would be more hurtful for participants.
Data analyses
In order to test my hypotheses, data analyses were focused on: (1) finding inter-group differences in terms of reservation wage (minimum amount of money participants worked for) / number of sheets made, in order to find out if H1 and H2 are true; (2) finding inter-group differences in the percentage of “v” letters found, to test hypotheses H3 and H4; (3) finding intra-subject differences between the number of sheets participants did and the number they estimated was the average that everyone completed, to test H5 and H6; and (4) finding intra-subject differences between the percentage of “v” letters participants estimated they found and what they estimated was the average percentage everyone found, in order to test both H7 and H8. Although not directly connected to my hypotheses, inter-group differences in perceived difficulty of the task and time spent performing the task were also tested, since these may show possible changes in behavior or cognitive distortions in participants that could compliment my hypotheses. Exploratory data analyses were done for each dependent variable in each group, in order to see if they obeyed the premises to use parametric tests.
13
Results
All data were processed using the Statistical Package for the Social Sciences (SPSS) program, version 22. Exploratory data analysis results, in terms of tests of normality in my dependent variables, are shown in table 1. According to these results, I resorted to parametric tests in inter-subject differences in the time participants spent doing the task, since it is the only analysis which dependent variable follows a normal distribution and has homogeneity of variance (Based on Mean, p = 0,55; Based on Median, p = 0,52 ; Based on Median and with
adjusted df, p = 0,52; Based on trimmed mean, p = 0,53). Other results of the exploratory data
analysis did not obey the premises to use parametric tests, since none of the performed analysis’ dependent variables demonstrate a normal distribution in every condition.
Table 1 - Tests of normality
Skewness Kurtosis Kolmogorov-Smirnov Shapiro-Wilks
Sheets Completed Equity -0,03 -1,01 p = 0,20 p = 0,20 P. Inequity 0,47 -1,22 p = 0,02 p = 0,01 N. Inequity 0,55 -0,60 p = 0,02 p = 0,05 "v"s percentage Equity -1,22 1,41 p = 0,08 p = 0,01 P. Inequity -1,14 0,90 p = 0,07 p = 0,00 N. Inequity -1,11 0,97 p = 0,08 p = 0,02 Total sheets estimated Equity 0,07 -1,12 p = 0,20 p = 0,22 P. Inequity 0,49 -0,84 p = 0,04 p = 0,08 N. Inequity 0,65 -0,76 p = 0,13 p = 0,01 "v"s estimated percentage Equity -0,62 -0,95 p = 0,04 p = 0,01 P. Inequity -0,60 -0,97 p = 0,00 p = 0,01 N. Inequity -1,21 0,90 p = 0,01 p = 0,00 "v"s total estimated percentage Equity -0,64 -0,54 p = 0,12 p = 0,05 P. Inequity -0,36 -0,86 p = 0,20 p = 0,20 N. Inequity -0,94 0,76 p = 0,14 p = 0,04 Task difficulty Equity -0,02 -0,13 p = 0,20 p = 0,84 P. Inequity -0,63 -0,06 p = 0,09 p = 0,11 N. Inequity -0,19 -0,47 p = 0,20 p = 0,40 Time spent Equity -0,34 0,30 p = 0,02 p = 0,33 P. Inequity -0,30 3,01 p = 0,00 p = 0,00 N. Inequity -0,38 -1,04 p = 0,00 p = 0,10
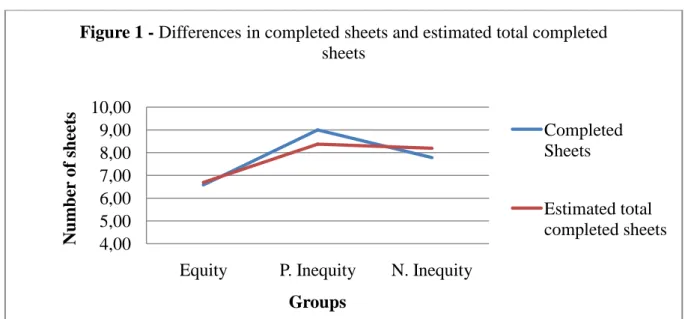
To find out if hypotheses H1 and H2 were true, I tested inter-subject differences in the number of sheets completed between participants of the three groups. I started by using the Kruskall-Wallis test which showed statistically significant differences, 𝑥2(2) = 6,52, p < 0,05. The Mann-Whitney test revealed that participants in the positive inequity group completed
14
significantly more sheets than participants in the equity group, U = 216, p = .016, while there were no differences between the other groups (see Figure 1, below).
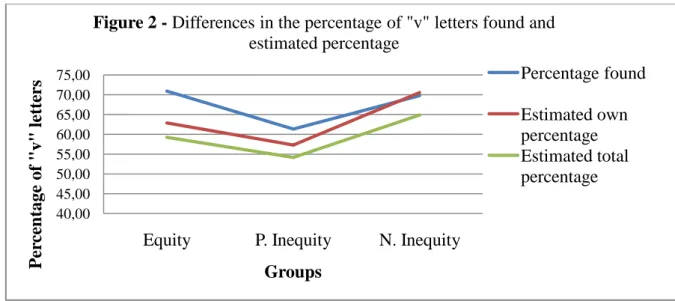
I also found no intra-subject differences between the number of sheets participants completed and the average number of sheets they perceived all participants did, using the Friedman test, 𝑥2(1) = 0,00, p = 1,00, as seen in figure 1, which was important to test because of H5 and H6. In terms of inter-subject differences in the percentage of “v” letters participants found, in order to see if H3 and H4 were true, although individuals in group 2 had the lowest percentage, using the Kruskall-Wallis test, there were no statistically significant differences between groups, 𝑥2(2) = 2,56, p = 0,28. A graphical representation of the percentage of “v” letters found can be seen in Figure 2. However, an interesting result was that 2 participants in the positive inequity group did not mark any “v” letters in 13 sheets of paper, and only one in the negative inequity group did not mark any “v” in 3 sheets of paper. On the opposite side, 2 participants in the negative inequity group were able to find all 50 “v” letters in 2 pages, and other 2 participants of the same group found all 50 in 1 sheet, while only 1 participant in the equity group was able to find all 50 “v” letters in 1 sheet of paper.
For H7 and H8, I performed a Friedman test to see if there were intra-subject differences between what participants perceived it was their percentage of “v” letters found and what they perceived it was the percentage of “v” letters everyone found, which showed statistically significant differences, 𝑥2(1) = 4,90, p = 0,03. Participants in the negative inequity condition perceived they performed better while comparing themselves to others, Z = -2,113, p = .035, as seen in Figure 2 and relevant for H8.
4,00 5,00 6,00 7,00 8,00 9,00 10,00
Equity P. Inequity N. Inequity
Num b er of sh ee ts Groups
Figure 1 - Differences in completed sheets and estimated total completed
sheets
Completed Sheets
Estimated total completed sheets
15
No inter-subject differences in terms of perceived difficulty of the task were found using Oneway ANOVA, F (2,77) = 0,04, p = 0,96. The time spent doing the experiment had statistically significant differences by the Kruskall-Wallis test, 𝑥2(2) = 6,54, p = 0,04 with participants in the positive inequity group spending more time than participants in both the equity (U = 215.5, p = .014) and negative inequity (U = 252.5, p = .049) conditions.
Table 2 shows the means and standard deviations of the dependent variables results to summarize them.
Table 2 - Means and standard deviations of results
Equity Positive Inequity Negative Inequity
Mean SD Mean SD Mean SD
Sheets completed 6,58ᵃ 2,72 9ᵃ 3,03 7,78 3,09 Total sheets perceived 6,69 2,78 8,37 2,79 8,19 3,88 Reservation wage (euro) 0,23 0,08 0,16 0,09 0,2 0,09 "v"s percentage 70,88 19,54 61,33 25,29 69,79 23,28 "v"s estimated own percentage 62,88 28,85 57,3 29,38 70,56ᵇ 26,51 "v"s estimated total percentage 59,23 23,9 54,15 26,34 64,85ᵇ 23,66 Task difficulty 4,73 2,39 4,85 2,23 4,93 2,67 Time spent (minutes) 50,58ᶜ 13,24 58,63ᶜᵈ 10,8 50,3ᵈ 14,28 Values with the same superscript are significantly different
Conclusion
In general, results didn’t go according to my hypotheses. For H1, the results showed the opposite of the hypothesis. Goodman and Friedman (1971) questioned if piece-rate pay would be perceived in a global or a unit basis. They stated that individuals in a positive inequity situation, by increasing quality in each piece, would mean that individuals were restoring
40,00 45,00 50,00 55,00 60,00 65,00 70,00 75,00
Equity P. Inequity N. Inequity
P er ce n tage of " v" let te rs Groups
Figure 2 - Differences in the percentage of "v" letters found and
estimated percentage Percentage found Estimated own percentage Estimated total percentage
16
equity in each piece, but by decreasing the number of pieces would also mean that they perceived it in a global basis. So it seems individuals can perceive both ways in order to maximize equity restoration. My hypothesis followed what Adam’s theory suggested so I assumed participants would complete less sheets by perceiving payment on a global basis. In Ariely, et al.’s (2008) task, however, which would decrease payment for each new piece, it seems that the participants were more inclined to perceive it on a unit basis. This suggests that, in the present experiment, results can be congruent with an equity restoration perspective: participants in the positive inequity situation, by doing more sheets, in fact decreased their outcome per unit, so they worked for less money.
Shore (2004) also demonstrated that pay satisfaction would increase in a direct proportion to the payment level. Although every participant in this experiment had the same payment levels for each sheet, participants in the positive inequity condition perceived they were on a higher payment level than others. This may mean that they were more satisfied doing the same sheets of paper than other participants, while trying to decrease the distress created by inequity creating enough sheets in order to obtain a lower reservation wage.
However, this would mean that participants in the negative inequity group should have handed in less sheets than participants in the equity group, but that was not the case. In fact, the average number of sheets completed in the negative inequity group and in the equity group showed no statistically significant differences. An explanation for this may be an existing difference in the distress strength in each inequity situation, such that positive inequity was stronger than the negative, so the latter was not strong enough to cause differences in behavior. This contradicts what Adams (1965) says, since negative inequity should have a stronger effect, but there might have been a cognitive distortion on these individuals, decreasing the importance that they gave to the value of the money they could get if they were receiving more, which may have been one of the means they used to restore equity, as mentioned by Adams (1965).
H3 and H4 were not confirmed, but the few participants that reached maximum and minimum in work quality in a sheet of paper may show us the individual differences suggested by the equity sensitivity construct and may explain the difficulty in not getting statistically significant differences between groups, as Huseman, et al. (1987) said, so it seems that individual differences have some role in work quality in perceived inequity situations.
H5 and H6 were also not confirmed and there were no differences in the number of sheets participants completed and what they perceived it was the average sheets completed by everyone. As Adams (1965) referred, not all means may be available psychologically for the individual to restore equity, so it is not surprising that some hypotheses are not confirmed, which may also be an explanation for the results about H3 and H4.
H7 may be the same case because no statistically significant differences were found between what participants in the positive inequity group perceived that was their percentage of “v” letters found and what they estimated it was the average percentage. However, results for the
17
negative inequity condition showed the opposite that was hypothesized in H8, since participants in this group perceived they had a better performance than the average. Adams (1965) indicates that individuals are resistant to real and cognitive changing that are central to their self-concept and self-esteem, which might explain why they didn’t evaluate themselves as performing worse than others, which also tells us that performance is a relevant factor for these participants. Tesser (1986), in his Self-Evaluation Maintenance (SEM) model of social behavior indicates that individuals will behave in a manner that will maintain or increase self-evaluation, and if the “relevance” of their performance is high then they will help the comparative other less and evaluate their performance as not so much better or even worse than the individual’s own performance.
The reason why participants of other groups didn’t do the same was probably because they did not give such a high relevance to their performance, since they were not in the same situation where the comparison others are in a higher status than them. This is because high evaluations of the comparison others are more “threatening” to the individual’s own performance, making it look bad and participants in the negative inequity group might have thought that I was expecting a better performance in participants that were earning more money, hence their evaluation.
The most interesting aspect of these results was the fact that participants in the negative inequity condition seem to have given more relevance to performance than other participants, and according to Adams (1965) they should do the opposite in order to decrease the distress created by inequity. Having a good performance seems to be more important than restoring equity to these participants but perhaps they also decreased the relevance of outcomes for the distress to diminish, hence the results for H2 and H6, by not confirming those hypotheses.
There were no differences between groups in terms of perceived difficulty of the task, which could be another mean for individuals to restore equity. Although the time spent doing the task was higher in the positive inequity group than both other groups, the timer was set manually so there is a probability that these results may not be totally correct. If this difference does exist, Goodman and Friedman (1971) suggest that individuals who are not used to working on a piece-rate basis, might have perceived the outcome on a hour-rate basis since reward was only given at the end of the experiment, so spending more time in the task would be expected for these participants.
In summary, participants perceiving to be in positive inequity situation showed a lower reservation wage as compared to the control group, thus compensating for the higher outcomes, with no apparent distortion in cognition. On the other hand, participants perceiving a negative inequity situation did not show any differences in the reservation wage, as compared to the control group, but seem to distort cognitively the importance they attributed to outcomes, lowering it and thus decreasing inequity, and the importance attributed to inputs, increasing it, and thus evaluating themselves as better than others. This means that there may be different influences on the reservation wage depending on the type of inequity perceived. Equity restoration seems to happen by trying to influence the earnings on a unit basis to
18
participants perceiving positive inequity, but in a perceived negative inequity situation the changes seem to be made cognitively, and not by changing the reservation wage.
Limitations
There are some limitations to this study that do not warrant a deeper analysis. The first being the difficulty in recruiting participants, since we could not use the platform for University of Minho’s psychology students, which would make it easier. Still, the use of participants from other courses was enriching for the experiment, but a larger sample would also be important to go deeper into these hypotheses.
Better control of response times would also give more trustful results. Since we are suggesting different cognitive processes, a rigorous analysis of response times becomes critical. In this case, we could not find a way to automate the whole experimental situation, which led us to manually time the participants’ performance, which certainly introduced error in the measurements.
A larger value for the rewards would increase the distress made by the inequity, which would give more robust results. Compared to Ariely, et al.’s (2008) experiment, the amount earned in each sheet was too small (20.5 euro cents average) and the difference between each sheet was also small (3 cents). This is because we increased the number of sheets participants could earn money from and we offered a smaller maximum amount of money. We did not have more money to spend in this research so we could not afford to increase this amount
Future research suggestions
A better strategy to surpass this research’s limitations should be advised. There is also very few studies from Portugal that focus on perceived inequity and this is an important subject, especially when social inequalities are arising with the current economic crisis and there might be cultural differences in how we react to inequity, so there are benefits in increasing the number of researches on this matter.
Although Adams (1965) mentions cognitive distortions to restore equity, there are very few studies to assess this, compared to the number of studies that assess behaviors in quantity and quality. My results showed that cognition distortions may not follow the same path as behavior, so a deeper understanding of this reaction is needed. A questionnaire assessing the relevance participants give to the money earned and to their performance should also be made, in order to confirm if there are cognition distortions by that mean.
Also, more studies assessing individual’s reservation wage in an employed context should be made. A deeper understanding of this variable in employment contexts might bring a greater satisfaction for both employers and employees.
19
References
Adams, J. S. (1965). Inequity in social exchange. Advances in experimental social psychology (267-299).
Adams, J. S., & Jacobsen, P. R. (1964). Effects of wage inequities on work quality. The
Journal of Abnormal and Social Psychology, 69(1), 19.
Adams, J. S., & Rosenbaum, W. B. (1962). The relationship of worker productivity to cognitive dissonance about wage inequities. Journal of Applied Psychology, 46(3), 161.
Ariely, D., Kamenica, E., & Prelec, D. (2008). Man's search for meaning: The case of Legos.
Journal of Economic Behavior & Organization, 67(3), 671-677.
Arrowood, A. J. (1961). Some effects on productivity of justified and unjustified levels of
reward under public and private conditions. Unpublished doctoral dissertation, University of
Minnesota.
Borjas, G. J. (2012). Labor Supply. Labor Economics (6ª ed.). McGraw-Hill/Irwin.
Clark, J. V. (1958). A preliminary investigation of some unconscious assumptions affecting
labor efficiency in eight supermarkets. Unpublished doctoral dissertation, Harvard University.
Goodman, P. S., & Friedman, A. (1971). An examination of Adams' theory of inequity.
Administrative Science Quarterly (271-288).
Homans, G. C. (1961). Social behavior: its elementary forms. New York: Harcourt, Brace.
Huseman, R. C., Hatfield, J. D., & Miles, E. W. (1987). A new perspective on equity theory: The equity sensitivity construct. Academy of management Review, 12(2), 222-234.
Ordem dos Psicólogos Portugueses (2001). Código Deontológico: Código Deontológico da Ordem dos Psicólogos Portugueses. Diário da República, 2ª série, nº 78, 17931-17936.
Prasad, E. S. (2003). What determines the reservation wages of unemployed workers? New
evidence from German micro data. IZA Discussion-Paper, 694.
Shore, T. H. (2004). Equity sensitivity theory: do we all want more than we deserve? Journal
of Managerial Psychology, 19(7), 722-728.
Tesser, A. (1988). Toward a self-evaluation maintenance model of social behavior. Advances