ASTRAZENECA AND PHARMACEUTICAL INDUSTRY:
SECTOR OVERVIEW AND COMPANY VALUATION
Miguel Francisco das Neves Costa Ucha
Project submitted as partial requirement for the conferral of
Master in Finance
Supervisor:
Prof. Pedro Manuel de Sousa Leite Inácio, ISCTE Business School, Finance Departament
ASTRA
ZE
NECA
AND
PHAR
MAC
EUT
ICAL
SE
C
T
OR
: I
N
DUS
TRY
OVERV
IE
W
AN
D COM
PANY
VA
LUAT
ION
M
ig
ue
l F
ra
nci
sc
o
da
s Ne
v
es
C
o
sta
U
ch
a
I RESUMO
A presente projecto de Mestrado tem como objectivo a apresentação de uma descrição global da indústria farmacêutica e a avaliação da AstraZeneca. A avaliação da empresa será seguida de uma recomendação de investimento, baseada no cálculo do preço-alvo da acção.
A indústria farmacêutica tem um conjunto de características únicas, devido ao seu impacto na saúde pública. Essas características irão ser avaliadas através da análise da indústria a nível mundial e através da descrição de empresas europeias do sector farmacêutico.
A AstraZeneca é uma empresa multinacional inglesa, que opera no sector farmacêutico. A empresa é responsável por todo o processo de investigação, desenvolvimento, teste, produção, divulgação e venda de medicamentos próprios. Desenvolve investigação nas áreas de oncologia, cardiologia, gastrointestinal, infecção, neurociência, doenças respiratórias e inflamação. Entre os medicamentos mais vendidos destacam-se Nexium, Crestor, Symbicort e
Brilinta.
A empresa está cotada na Bolsa de Londres, na Bolsa de Estocolmo e na Bolsa de Nova Iorque. É parte integrante dos índices FTSE 100 e do OMX 30.
A avaliação da empresa foi feita através do Método de Fluxo de Caixa Descontado e do método dos Múltiplos.
No sentido de avaliar a empresa, dados históricos entre 2009 e 2014, foram utilizados. A projecção dos resultados foi feita por um período de 5 anos, de 2015 até 2020.
Através da avaliação feita concluímos que a recomendação é MANTER, com um preço-alvo de ₤46.98.
Palavras-chave: AstraZeneca, Pharmaceutical industry, Discounted Cash Flow, Multiples JEL classification: G30, G32
II ABSTRACT
The present Master thesis aims to present a global description of the pharmaceutical industry and evaluate AstraZeneca. Company valuation is followed by a recommendation on the stock and a target price.
Pharmaceutical industry has several unique features, due to its impact on public health. Those features will be assessed by analyzing the industry worldwide and by describing European pharmaceutical companies.
AstraZeneca is a British multinational that operates in the pharmaceutical sector. The company is responsible for all the process of investigation, development, testing, production, advertising and selling of own medicines. The company develops its R&D activities in oncology, cardiology, gastrointestinal, infection, neuroscience, respiratory and inflammation. Among the medicines best sellers are Nexium, Crestor, Symbicort and Brilinta.
Company shares quote on London Stock Exchange, Stockholm Stock Exchange and on New York Stock Exchange. It integrates FTSE 100 and OMX 30 country indices.
Company valuation has been performed, using fundamental analysis, by the Discounted Cash Flow method and the Multiples method.
Regarding the valuation of the company, historical data publically published from 2009 until 2014 was used. The forecasting period is 5 years, from 2015 to 2020.
After evaluating the company, we conclude that the recommendation is HOLD, with a target price of ₤46.98.
Keywords: AstraZeneca, Pharmaceutical industry, Discounted Cash Flow, Multiples JEL classification: G30, G32
III ACKNOWLEDGEMENTS
The present project is the final step of the long journey the MSc in Finance was. The hard work and commitment to overcome all challenges was complemented with huge support and encouragement from friends and family; and by great knowledge shared by professors. Without them it would not have been possible to finish this project.
First, I would like to express my deep gratitude to Professor Pedro Leite Inácio, for all the support, guidance and advices given during the preparation of this thesis and the precious knowledge shared during the Master.
I would like to thank my Master’s colleagues and friends João Martins and João Mendes for all the hours spent together working, for being an example of success, commitment and for always backing me to improve my skills. I also take this opportunity to specially thank Rita Valério for the key importance throughout this project by encouraging, helping and motivating me to finish it.
Last but definitely not least, very special thanks should be given to my family, in particular my Mother, Father and Brothers, Martim Ucha and João Ucha, for the unconditional support, for inspiring me every day and for giving me strength to always do my best.
IV INDEX
GLOSSARY ... VII
1 - INTRODUCTION ... 1
2.1 – Overview of valuation methods ... 2
2.2 – Introduction to real options valuation ... 3
2.2.1 – Financial options ... 3
2.2.2 – Options key elements ... 4
2.2.3 – Option pricing ... 5
2.2.4 - Moneyness ... 6
2.2.5 - Real Options Valuation ... 6
2.3 – Multiples Valuation ... 8
3 – PHARMACEUTICAL INDUSTRY ... 11
3.1 – Economic Environment ... 11
3.2 – Pharmaceutical sector ... 13
3.3 – Healthcare expenditure ... 14
3.4 – Industry sales by world region ... 15
3.5 – World sales by therapeutic area ... 17
3.6 – Regulatory Entities ... 18
3.7 – Medicine development process ... 20
3.8 – Intellectual Property ... 21
3.9 – European Pharmaceutical Large Cap ... 22
3.9.1 – Bayer AG ... 22
3.9.2 – GlaxoSmithKline Plc... 24
3.9.3 – Novartis AG ... 26
3.9.4 – Novo Nordisk A/S ... 27
3.9.5 – Roche AG ... 29 3.9.6 – Sanofi ... 30 4 – ASTRAZENECA ... 32 4.1 – Company description ... 32 4.2 – Therapeutic Areas ... 33 4.3 – Geographic presence ... 34 4.4 – Business strategy ... 35 4.5 – Shareholder structure ... 36
5 – FINANCIAL STATEMENT ANALYSIS ... 37
5.1 – Sales and margins ... 37
V
5.3 - Dividend analysis ... 42
5.4 – Capital structure and debt coverage ... 43
5.5 – Risk analysis ... 45 5.6 – Company events ... 46 6 – COMPANY VALUATION... 47 6.1 – Cost of Capital ... 48 6.1.1 – Beta ... 48 6.1.2 – Cost of Equity ... 48 6.1.3 – Cost of debt ... 48 6.1.4 – Capital Structure ... 49
6.1.5 – Weighted Average Cost of Capital ... 49
6.2 – Discounted Cash Flow ... 49
7 – SENSITIVITY ANALYSIS ... 52
7.1 - Constant zero growth ... 53
7.2 – Bear case ... 54
7.3 – Bull case ... 55
8 – MULTIPLES VALUATION ... 57
10 – RISKS AND OPPORTUNITIES ... 58
12 - BIBLIOGRAPHIC REFERENCES ... 62
VI LIST OF FIGURES
Figure 1- The Binomial model with two steps ... 5
Figure 2 - GDP growth 2005 - 2020E ... 12
Figure 3- Inflation rate 2005 - 2020E ... 12
Figure 4 – Government health expenditure as % of GDP by world region 2000 - 2013 ... 14
Figure 5 - Total health spending by country as a % of GDP 2012 ... 15
Figure 6 - World industry sales by geographic region ... 16
Figure 7 - Top 10 therapeutic areas by sales in 2014 ... 17
Figure 8 - FDA approvals 2003 - 2014 ... 18
Figure 9 - From discovery to market launch by FDA criterion ... 20
Figure 10 - Bayer AG results overview 2009 – 2014 ... 22
Figure 11 - Bayer organizational structure and contribution sales in 2014 ... 23
Figure 12 - GSK results overview 2009 – 2014 ... 24
Figure 13 - GSK sales by therapeutic area in 2014 ... 25
Figure 14 - Novartis results overview 2009 - 2014 ... 26
Figure 15 - Novartis sales by therapeutic area in 2014 ... 26
Figure 16 - Novo Nordisk results overview 2009 – 2014 ... 27
Figure 17 - Novo Nordisk sales of 2014 by geography ... 28
Figure 18 - Roche AG results overview 2009 – 2014 ... 29
Figure 19 - Roche sales of 2014 by therapeutic area ... 29
Figure 20 - Sanofi results overview 2009 – 2014 ... 30
Figure 21 - Sanofi sales of 2014 by geography ... 31
Figure 22 - AstraZeneca share performance vs FTSE 100 from 2009 – 2014 ... 32
Figure 23 - Therapeutic areas weight on 2014 total sales ... 33
Figure 24 - Sales by geographic region 2009 – 2014 ... 35
Figure 25 - Major shareholders and percentage free float ... 36
Figure 26 - AstraZeneca sales and margins 2009 - 2014 ... 37
Figure 27 - AstraZeneca economic profitability 2011 – 2014 ... 39
Figure 28 - Financial Profitability 2011 – 2014 ... 40
Figure 29 - Operating Profitability 2011 – 2014 ... 41
Figure 30 - AstraZeneca dividend analysis 2011 - 2014 ... 42
Figure 31 - Capital structure and debt coverage 2011 – 2014 ... 43
Figure 32 - Debt breakdown 2009 - 2014 ... 43
Figure 33 - Liquidity ratios 2011 - 2014 ... 44
Figure 34 - Degrees of leverage 2011 - 2014 ... 45
Figure 35 - WACC calculations ... 49
Figure 36 - Consensus on sales and gross profit 2015 – 2020 ... 50
Figure 37 - EBITDA, D&A and EBIT calculations 2015 – 2020 ... 51
Figure 38 - Share price calculations ... 52
Figure 39 - Share price calculations for constant zero growth ... 53
Figure 40 - Recommendation for constant zero growth ... 53
Figure 41 - Bear case estimates 2015 - 2020 ... 54
Figure 42 - Company share prices in bear case ... 55
Figure 43 - Bull case estimates 2015 - 2020 ... 55
Figure 44 – Bull case price target calculations ... 56
Figure 45 - Equity Multiples analysis ... 57
VII GLOSSARY
AZN – AstraZeneca Plc BMS – Bristol-Myers Squibb CAPM - Capital Asset Price Model DCF – Discounted Cash Flow
CFDA - China Food and Drug Administration EMA – European Medicines Authority
EPAR - European Public Assessment Report EUR – Euro currency
EV – Enterprise Value
FDA – U.S. Food and Drugs Administration GSK – GlaxoSmithKline Plc
PMDA - Japanese Pharmaceuticals and Medical Devices Agency ROV – Real Options Valuation
R&D – Research and Development
SG&A – Selling, General and Administrative expense USD – United States dollar currency
WACC – Weighted Average Cost of Capital Yoy – Year on year
1 1 - INTRODUCTION
The present project is a case study and arises in the context of the Master in Finance. Its’ goals are to describe the features of pharmaceutical industry worldwide, present large capitalization European pharmaceutical companies, analyze and evaluate AstraZeneca and make a recommendation on the stock based on the calculated price target.
Pharmaceutical industry is one of the most important and regulated industries in the world. Its’ investments on Research and Development, patents, medical tests and production of medicines have a direct impact in our lives, affecting healthcare systems, economies, family budgets and human health. All these features are assessed in order to have a wide understanding of the industry framework.
AstraZeneca is a British pharmaceutical multinational, which researches, tests, develops and sells medicines. It is one of the major European players in this industry. The company dedicates its research to cardiovascular (38% of sales 2014), respiratory and inflammation (19% of sales 2014), oncology (12% of sales 2014), gastrointestinal (18% of sales 2014), oncology (12% of sales 2014), neuroscience (7% of sales 2014) and infection (6% of sales 2014). Its medicines are available worldwide, but its major market is the USA, which represents 40% of sales, followed by 29% of sales in Europe.
Regarding AstraZeneca valuation, two valuation methods are used; the Discounted Cash Flow method and Multiples. These methods are used to reach a recommendation and a price target for AstraZeneca shares as of 31/12/2015.
To evaluate the company and analyze its financial statement, public data from 2009 to 2014 is used and the estimation of several items was made until 2020.
A brief review of company valuation literature was also made, considering the two valuation methods used and the one mentioned by some authors as the most correct, the Real Options valuation method.
In the end, the recommendation is HOLD with a price target of ₤46.98. This recommendation reflects an upside of 3.12% comparing with ₤45.56 per share, as of 31/12/2014.
2 2 - REVIEW OF LITERATURE
2.1 – Overview of valuation methods
Company valuation literature provides a wide range of different methods and approaches that research analysts and investors can use. Fernandez (2013b) identifies six main models to evaluate a company, describing pros and cons about each one of them. Fernandez (2013b) considers balance sheet methods, income statement methods, mixed methods, cash flow discounting, value creation and options as the available methods to value companies. Between these six methods, Fernandez (2013b: 2) highlights that “the methods that are becoming
increasingly popular (and are conceptually ‘correct’) are those based on cash flow discounting”.
Discounted cash flow methods, “… determine the company’s value by estimating the cash
flows it will generate in the future… (Fernandez, 2013b: 9)”. The key to use this method is to
choose the correct rate to discount future cash flows, normally it is used the weighted average cost of capital.
Every industry requires a different valuation approach, in order to get the most accurate valuation results. The pharmaceutical industry, the mining industry and the telecommunication industry, are concrete examples of sectors that need special attention when choosing valuation methods. A great part of these companies assets value comes from Research and Development (R&D), which can lead to new technologies, patents and other intangible assets that can create value to the company or not. Also, a great part of these companies business is based on projects that can create future value for the company or not and the arrival of new information, at every stage of the project, can change its progress. For example, in the pharmaceutical industry, medicines have to be tested in different phases and can fail or succeed in each phase. Depending on the results on each phase the company can continue to invest, abandon or postpone the project. Each of these outcomes should account on the value of the company.
R&D and intangible assets, like patents or other types of intellectual property, are incorrectly valued using Discounted Cash Flow methods, because they only consider the cash flows generated in the future. These methods do not consider the possibility of active management of the company and the uncertainty and risk involved in R&D. Managers can decide whether to leave a project if it turns out bad or keep investing if the project turns out to be good.
3 Using DCF models, managers have to make decisions today based on expectations of future results, which will undervalue the project and the decisions made with the arrival of new information (Copeland, Koller and Murrin, 2000).
2.2 – Introduction to real options valuation
Considering the previous remarks, there is one valuation method that accounts for real management problems as flexibility, uncertainty and decision making stage by stage, the Real Options Valuation.
Most literature on ROV is applied to investment projects and the decisions managers face when investing in new technology, medicines or expensive project like, mining projects or oil fields. Yet, it can be used to value a company has a whole and make investment decisions on a company and not only on a single project.
Hull (2012) highlights the utility of ROV on the valuation of new companies, where earnings are negative for the first years, because of their efforts to expand and increase market share. ROV assumes the same principles and rules of financial options valuation. Therefore, the fundamentals of financial options should be explained.
2.2.1 – Financial options
A financial option is a contract that gives the right, not the obligation, to buy or sell a predetermined amount of an asset, at a specific price and date. The amount is called contract size, the asset is the underlying, the specific price is called strike price and the date is the maturity/expiration date.
There are two basic types of options, call options and put options. A call option, gives the right, not the obligation, to buy a predetermined amount of an asset, at a specific price and date. A put option gives the right, not the obligation, to sell a predetermined amount of an asset, at a specific price and date.
Additionally, options have two exercising styles, the American-style and the European-style. When using an American-style option, the investor can exercise its right to buy or sell, at any moment until the maturity date. When using European-style options, the investor can only exercise it at the maturity date.
4 The payoff of a plain-vanilla call option is max (ST – K; 0), where ST is the price of the underlying asset and K is the strike price. When ST ≤ K the payoff is zero and when ST > K, the payoff is ST – K for a long call and K – ST for a short call. The payoff of a plain-vanilla put option is max (K- ST; 0). When ST < K the payoff is K – ST for a long put and ST – K for a short put. When ST ≥ K, the payoff is zero for a long or short put.
2.2.2 – Options key elements
There are five key elements that affect option value, the market price of the underlying asset, volatility of the underlying asset, dividends, option strike price and time to maturity.
Since options are dependent of an underlying asset, the option price as to change when the market price of the underlying changes. When the price of the underlying asset goes up, call options value increases and put options value decreases, and vice-versa.
Considering volatility, the more volatile the price of the underlying asset is, the more valuable the call or put option is. This comes from the fact that the investor can only lose the price he paid for the option and so, if the underlying performs big price changes it can give a potential gains.
If the underlying asset pays dividends, its price will decrease in the same amount of the dividend paid. If there are any dividend payments during the life of the option, the call option owners will see their options lose value, the bigger the expected amount of the dividend, the lower the price of the call. On the contrary, the value of puts will increase, the bigger the dividend.
The strike price is a determinant feature of options because it defines at what price, the call owners will buy the asset and the put owners will sell the asset, if they exercise the options. Therefore, calls will lose value and put will increase value as the strike price increases. As the maturity of the option arrives, the opportunities for price changes will decrease. A longer time to expiration makes calls more valuable and puts less valuable.
5 (1) 2.2.3 – Option pricing
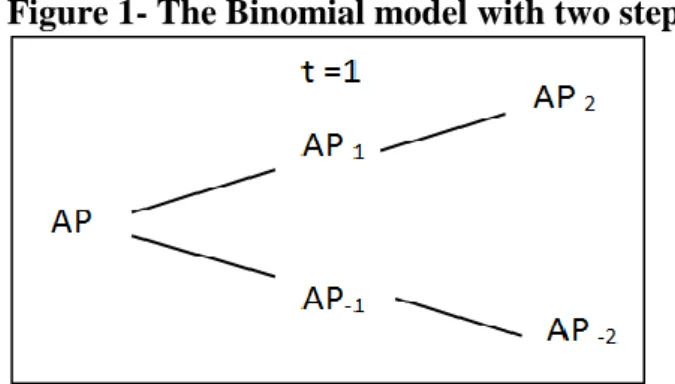
There are two ways to price an option, the Binomial model and the Black-Scholes model. Using the Binomial model, the underlying asset price (AP) can only move for one of two possible prices at each moment of time (t), one at which the price goes up with a level of probability and one at which the price goes down with the opposite level of probability. Figure 1- The Binomial model with two steps
To perform this valuation model, a replicating portfolio is created with the goal of studying the cash flows of the option being valued. To correctly perform this study the investor as to consider the asset spot price, the risk free rate, the option strike price, the time periods until maturity and the contract size.
Damodaran (1994: 328) refers that in the Binomial model “the value of an option is not
determined by the expected price of the asset but by its current price, which, of course, reflects expectations about the future”.
The Black-Scholes Model allows an option valuation in which the price can change at any time and can assume any value, other than negative. It also uses a replicating portfolio to study the option cash flows. So it is a model that assumes continuous price change and it is lognormal distribution because of the only positive values assumption and, as Damodaran (1994: 329) says “there are no price jumps”.
Damodaran (1994) defines the value of a call option using the Black-Scholes model as follows:
𝐶 = 𝑆𝑁(𝑑1) − 𝐾𝑒−𝑟𝑡𝑁(𝑑2)
where
6 (3) (4) (2) 𝑑1 =ln( 𝑆 𝐾)+(𝑟+ 𝜃2 2)𝑡 𝜃√𝑡 and 𝑑2 = 𝑑1 − 𝜃√𝑡
S is the value of the underlying asset at moment 0; K is the option strike price, t is the time to maturity; r is the risk free rate and 𝜃2 is variance of the underlying asset.
To value put options we can use the previews equations to value a call option and then perform the Put-Call Parity.
𝐶 − 𝑃 = 𝑆 − 𝐾𝑒−𝑟𝑡
where
C – call option P – put option S – strike price
K𝑒−𝑟𝑡 – present value of the strike price
2.2.4 - Moneyness
Financial options can be in-the-money, at-the-money and out-of-the –money. When an option is in-the-money, it means a positive payoff which in the case of call options is when the price of the underlying asset is above the strike price and; in put options, the underlying asset price is below the strike price. When an option is out-of-the-money, it means a negative payoff. In this case, the call option strike price is bigger than the underlying asset price and the contrary for put options. When an option is at-the-money, the strike price is equal to the underlying asset market price.
2.2.5 - Real Options Valuation
Copeland, Koller and Murrin (2000: 399) affirm that “Option pricing methods … explicity
capture the value of flexibility”. We can use ROV to evaluate the asset side of the balance
7 A project has the option to continue or abandon has a bigger present value than one with no flexibility, because it allows the investor to decide whether to keep investing or to abandon a project step by step with the arrival of new information. This comparison only makes sense with American options, because of the early exercise option.
Copeland, Koller and Murrin (2000: 400) write that “… options on the asset side are
primarily related to flexibility” and options on the liabilities side “… affect the company’s weighted average cost of capital (Copeland, Koller and Murrin, 2000: 423)”.
Damodaran (1994: 342) points the similarities between equity and call options, by stating that equity holders “cannot lose more than their investment in the firm”. Yet, Damodaran (1994: 341) highlights there are aspects that have to be taken into account when valuing real options: the underlying asset cannot be traded; the price changes are continuous, this assumptions is violated when considering real options and the consequence is that the “model will
underestimate the value of deep out-of-the-money options”; as in financial option pricing
theory, the underlying asset variance is maintained over the valuation period and is well known; and the “exercise is instantaneous”, this assumption is not real when taking into consideration that most projects do not appear form one instant to another, e.g. a medicine needs time to be approved by regulators and the exploration of an oil drill is not immediate. According to Damodaran (1996: 377), the value of the company (V) can be seen as current price of the underlying asset and the debt of the company (D) as the strike price (K). He assumes that in case of default, the equity holders can only lose the amount invested in the company. On one hand, when the value of the firm is lower than the value of its debt (V ≤ D) the payoff is zero. On the other hand, if V > D the payoff of equity holders is V-D.
To identify the value of real options, we can use the exactly some methods of financial options valuation; the Black-Scholes model and the Binomial model with a decision tree. However, Damodaran (1994) clears that some assumptions have to be made. We can only consider the existence of equity holders and debt holders; to treat debt as the strike price we have to consider only one issue of debt, with a zero coupon; the value and variance of the company have to be possible to estimate. Also, when valuing deep indebted companies, equity still has value like a deep out-of-the-money option, because until the expiration date, the value of equity can change and exceed the value of debt.
8 Copeland, Koller and Murrin (2000: 405), distinguish eight different kinds of options that are applied to investment projects. “The abandonment option”, the “option to defer development”, the “option to expand or contract”, the “option to extend or shorten”, the “option to scope up
or scope down”, “switching options”, “compound options” and “rainbow options” consider all
decisions the manager of a project/investor can deal with.
The options above, consider the flexibility that real investment projects have, such as the option to leave a project if the first outcomes reveal not good; the option to choose the right time to invest; the option to “make follow-up investment”; the option to lengthen an investment project beyond the forecasted period; or to consider different sources of uncertainty. All the options described by Copeland, Koller and Murrin (2000) are comparable with American call or put options, and in some cases, use both.
Dzyuma (2012: 62) identifies the need of “complicated formulas”, “the required
mathematical knowledge and the adoption of rigid assumptions” as some of real options
valuations drawbacks. 2.3 – Multiples Valuation
Another valuation method is using Multiples. It is a simple valuation method that is used to compare the company with its industry peers. Mota and Custódio (2012) consider this model a support for DCF valuation. Using Multiples valuation, the investor calculates a range of values where the company we want to evaluate is supposed to be in, defining an industry standard and not a concrete value for a single company.
Unlike the previous models, we cannot assess the value of a single company using Multiples, but it is a good method to compare and conclude the reasonability of the results obtained using DCF or ROV models.
Mota and Custódio (2012: 248) claim that to perform a correct valuation by Multiples it is necessary to identify a peer group of companies with “the same profile of future cash flows,
same growth potential and the same level of company risk of the company we are valuing”.
They recommend the use of a set of Multiples and not just one, as a way to not skew our analysis and have a range of results to compare with the company of interest.
To perform relative valuation, there are Equity Multiples and Enterprise Multiples. Equity multiples use the equity market price of a company and its fundamentals. The enterprise
9 (5)
(6) multiples, use the enterprise value of a company, often seen as an alternative to market capitalization when assessing a company total value.
𝐸𝑉 = 𝑀𝑎𝑟𝑘𝑒𝑡 𝐶𝑎𝑝. +𝑀𝑎𝑟𝑘𝑒𝑡 𝑣𝑎𝑙𝑢𝑒 𝑜𝑓 𝑐𝑜𝑚𝑝𝑎𝑛𝑦 𝑑𝑒𝑏𝑡 + 𝑀𝑖𝑛𝑜𝑟𝑖𝑡𝑦 𝑖𝑛𝑡𝑒𝑟𝑒𝑠𝑡 − 𝐶𝑎𝑠ℎ & 𝐸𝑞𝑢𝑖𝑣𝑎𝑙𝑒𝑛𝑡𝑠
Among the Equity Multiples, Damodaran (1994) highlights the price to earnings ratio (P/E), the price to book value (P/BV) and the price to sales ratio (P/S) as the most used multiples. Both are equity multiples, which compare the market stock price with company fundamentals, e.g. earnings per share and sales volume.
Considering general advantages, multiples valuation gives a simple approach; it is easy to understand; it gives a picture of the industry, defining a standard for the industry; no need to make assumptions like in the DCF valuation.
Among the general drawbacks, we can highlight the fact that it does not give the investor a price target; it only makes sense if compared with a benchmark or with peers average; it can be affected by how the market is pricing a sector, over or under valuating it; and the accounting measures can also skew valuation.
The P/E ratio is the market price of a company stock divided by its earnings per share. It is broadly used because of its simplicity and utility when comparing companies. High P/E ratios mean that investors expect an earnings increase in the future.
𝑃/𝐸 =𝐶𝑜𝑚𝑝𝑎𝑛𝑦 𝑚𝑎𝑟𝑘𝑒𝑡 𝑠ℎ𝑎𝑟𝑒 𝑝𝑟𝑖𝑐𝑒 𝐸𝑎𝑟𝑛𝑖𝑛𝑔𝑠 𝑝𝑒𝑟 𝑠ℎ𝑎𝑟𝑒
In addition to the advantages and drawbacks mentioned early, Damodaran (1994) alerts the price to earnings ratio is not interpretable when valuing negative earnings. Also, we have to take into account the effects of earnings volatility on the ratio. An increase in volatility can make the P/E ratio results to suffer big changes when valuing more than one period. We also have to be careful with the capital structure of the companies, because different capital structures will affect P/E results.
The P/BV compares the current stock price with the stock book value. Damodaran (1994) considers that stocks trading below its book value can mean the stock is being undervalued by the market.
10 (7)
(8) 𝑃/𝐵𝑉 =𝐶𝑜𝑚𝑝𝑎𝑛𝑦 𝑚𝑎𝑟𝑘𝑒𝑡 𝑝𝑟𝑖𝑐𝑒 𝑝𝑒𝑟 𝑠ℎ𝑎𝑟𝑒𝐵𝑜𝑜𝑘 𝑣𝑎𝑙𝑢𝑒 𝑜𝑓 𝐸𝑞𝑢𝑖𝑡𝑦 𝑝𝑒𝑟 𝑠ℎ𝑎𝑟𝑒
It overcomes the problem of evaluating companies with negative earnings and it is easily compared with the company market price. However, it is affected by accounting standards and it loses some of its meaning when valuing company with few fixed assets. Damodaran (1994), states that the ratio takes into account, the company expected growth rate, its payout ratio and risk, and differences on these features can lead to wrong comparisons and conclusions.
Also according to Damodaran (1994), the comparison between P/BV with the Return on Equity can show overvalued (higher P/BV than peers and lower ROE) or undervalued companies (lower P/BV than peers and higher ROE).
The price to sales ratio compares the market price of the company stock with its sales per share.
𝑃/𝑆 =𝐶𝑜𝑚𝑝𝑎𝑛𝑦 𝑚𝑎𝑟𝑘𝑒𝑡 𝑝𝑟𝑖𝑐𝑒 𝑝𝑒𝑟 𝑠ℎ𝑎𝑟𝑒 𝐶𝑜𝑚𝑝𝑎𝑛𝑦 𝑅𝑒𝑣𝑒𝑛𝑢𝑒𝑠 𝑝𝑒𝑟 𝑠ℎ𝑎𝑟𝑒
By considering company sales, this measure is not affected by accounting standards and it can be applied to all companies, even companies with negative earnings. Nevertheless, looking only for company sales, it does not take into account company margins and costs, which can overvalue a company with high fixed costs and low margins or the opposite.
Fernandez (2013a) selects the most relevant multiples by sector, and identifies the enterprise value to company sales (EV/S) and the enterprise value to EBITDA (EV/EBITDA) as the most relevant for the healthcare industry. Additionally, Mota and Custódio (2012) suggest the use of value per patent when evaluating pharmaceutical companies.
The EV/EBITDA is an enterprise valuation multiple that calculates a company’s return on investment, the price (in this case the enterprise value including net debt) the investor as to pay to benefit from the company’s cash flows. Unlike the P/E ratio, it is not affected by capital structure changes. It is a good measure for comparing companies with different levels of financial leverage and for evaluating companies with high depreciations and amortizations. However, it cannot be used in case of negative cash flows.
The EV/S compares the enterprise value of the company with its sales volume and it computes how much enterprise value is generated by one dollar of sales. Low results of EV/S
11 can mean that the company is undervalued, and its potential to increase in value attracts investors but it can also mean that investors are not confident with future sales generation. It is a useful measure when there are accounting differences or have negative cash flows among the companies of the peer group.
The previous multiples are recommended by Mota and Custódio (2012) as the correct ones when we need to compare companies from different countries that use different accounting rules. This is the particular case of the pharmaceutical industry, where competition is at a worldwide level and not in a country level.
To conclude our multiples valuation, we should take the mean of every multiple computed for the peer group to have a clear picture of the industry standards and a clear value to compare with the company with want to evaluate.
3 – PHARMACEUTICAL INDUSTRY 3.1 – Economic Environment
According to the International Monetary Fund1, GDP growth in advanced economies will increase in the coming years, recovering from the most recent crisis. Estimations point to an average growth of 1.6% from 2015 until 2020.
Low interest rates environment will persist during this period, together with fiscal sustainability issues and the need of structural reforms, mainly in the Eurozone. In 2015, the Eurozone is expected to grow a little more than 2%, the highest rate of the next 5 years, and the US growth forecast points to a 3% rate.
Regarding the emerging markets, GDP growth is expected to achieve an average of 5.2% between 2015 and 2020. Russia, Brazil and China are amongst the countries with an expected decline in growth rates.
Thus, the IMF is targeting a World GDP growth of 4% in 2020.
12 -6,00% -4,00% -2,00% 0,00% 2,00% 4,00% 6,00% 8,00% 10,00% World Advanced economies Emerging Markets
Source: International Monetary Fund, World Economic Outlook Database, April 2015 Figure 2 - GDP growth 2005 - 2020E
Inflation rates across the world show stabilization until 2020. Eurozone is expected to overcome recent deflation fears and return to ECBs’ inflation target of 2% in the medium term, in line with the rest of advanced economies.
In the US, inflation rates are expected to return to the 2% target in 2015 and remain in that level for the coming years.
The emerging markets inflation rate estimates point to 4.5% in 2020.
Considering exchange rates2, analysts believe that EUR/USD parity is a real possibility in the short term. Strong recovery of the US economy and the Fed intention to start rising interest
2 See Annex 13 for EUR/USD daily spot exchange rate evolution 31/12/2004 – 22/06/2015
0,00% 2,00% 4,00% 6,00% 8,00% 10,00% World Advanced Economies Emerging Markets
Source: International Monetary Fund, World Economic Outlook Database, April 2015 Figure 3- Inflation rate 2005 - 2020E
13 rates in September 2015 are some of the reasons mentioned. Also the Eurozone weak
economic recovery and the Greek crisis, can depreciate the EUR.
For the European pharmaceuticals, the weak EUR is a good factor to promote sales. Most of them are highly exposed to the US economy in terms of sales, but they produce their
medicines in Euros. This allows companies to benefit from a financial gain. Like the European pharmaceutical industry, some other industries are benefiting from the current exchange rate levels, for example the oil companies, carmakers and paper production companies.
All in all, a weak Euro currency is good for the European economies because exports become cheaper and imports more expensive.
3.2 – Pharmaceutical sector
Pharmaceutical industry is composed by companies that produce and sell medicines, vaccines, consumer care products and other related products. This sector has two different types of companies: the ones that cover every step of medicine life cycle and the ones that only produce and market medicines.
Companies that cover every step of medicine life cycle are the ones that research, develop, test, produce and sell their own medicines. These companies work together with regulatory authorities to test and approve new medicines to be marketed. Also, these companies commit themselves to closely track their approved medicines, in search of further knowledge about their effects on the human body.
To promote research and protect intellectual property, the large majority of countries protect the new discoveries by a patent policy, giving companies exclusivity to produce and sell the medicine for a limited period, usually 20 years.
Generic companies do not have R&D expenses and have less regulatory and clinical testing expenses, focusing on production and marketing costs. These companies take advantage of patent expiration, inefficiencies in IP protection laws and patent validity challenges. When a patent expires or is lost, the company which created the new medicine no longer as the exclusivity to produce and sell the medicine. Therefore, other companies start to produce similar medicines at lower, more competitive, prices. These are called generic medicines.
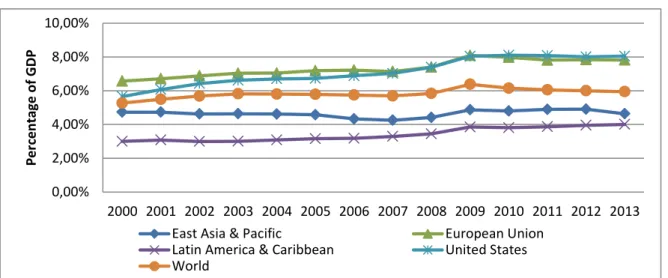
14 Source: The World Bank, World Health Organization Global Health Expenditure
database 0,00% 2,00% 4,00% 6,00% 8,00% 10,00% 2000 2001 2002 2003 2004 2005 2006 2007 2008 2009 2010 2011 2012 2013 Per ce n tage o f GDP
East Asia & Pacific European Union Latin America & Caribbean United States World
Other feature of the pharmaceutical sector is the companies’ profile. Every company has its own profile, meaning that the areas of research change from company to company and the specialization area is also different.
This sector is one of the most regulated. Every new medicine has to pass through a series of tests and clinical trials to possibly be approved by national regulators. These regulatory bodies do not have the same criteria and testing phases, so a new medicine can have marketing authorization in the United States and not in Europe. Although every region has its own health safety regulator, the most closely followed by is the US Food and Drugs Administration.
3.3 – Healthcare expenditure
The above chart shows the general government health expenditure by world region as a percent of its GDP. United States and the European Union are the regions where government spending is higher, justifying why pharmaceutical companies are so exposed to these markets. Since 2009, both regions maintained around 8% of GDP spent on health stopping the upward trend since the beginning of 2000’s.
Health expenditure represents 6% of the World GDP.
The region with the smallest amount spent in health care is Latin America & Caribbean. It grew 1% in a decade but only represents 4% of the region GDP.
15 Figure 5 shows both public and private health spending by OECD country. The OECD average was 9.23% of GDP spent on health.
The United States stands out as the country with the biggest percentage of GDP spent on health related costs, around 17%. This fact is explained by the features of the American health system. In the US the health system is mainly private, meaning that people have to pay private insurance to guarantee access to health care. Public expenditure in health care is related with the fact that it is the government that ensures access to health care to the public sector employees.
In Europe, there are public healthcare systems provided by the national government budget, which means most of the total health spending as a percentage of GDP it is made the general government. Therefore, populations have total access to health care without the need of health insurance, reducing the total expenses on health. The European average expenditure on health is 9.25%, meaning that private spending is around 1.25%.
3.4 – Industry sales by world region
In the recent years, top industry sales were $903 billion in 2014, which represent a growth of 8.3% comparing with 2013. 0,00% 2,00% 4,00% 6,00% 8,00% 10,00% 12,00% 14,00% 16,00% 18,00% Au stria Be lgi u m Ca n ad a Cze ch Rep u b lic De n m ar k Es to n ia Finla n d Fr an ce G erm an y G re e ce H u n gary Ice lan d Ire lan d Is ra el It aly Jap an Kore a Lu xe m b o u rg Me xico N o rw ay Po lan d Slov ak Rep u b lic Sl ov en ia Sp ain Sw ed e n Sw itz erlan d Tu rk e y U n ite d K in gd o m U n ite d S ta te s OE CD A ve ra ge
Source: OECD health statistics
16 Source: AstraZeneca 2014 annual report
$100.000 $200.000 $300.000 $400.000 $500.000 $600.000 $700.000 $800.000 $900.000 $1.000.000 2012 2013 2014 Emerging Markets Other Established Markets Europe
USA
Has Figure 6 shows, the US market was responsible for $365 000 million of 2014 industry sales, which represents 40% of total sales. This is the result of the worlds’ biggest public and private expenditure on health related goods and services has already mentioned.
The second biggest market is Europe, which represented 24% of industry sales.
Also important to refer are the demographic trends of the majors markets. According to the World Bank, 14% of the US population is over 65 years. In Europe in 2014, according to the Eurostat, 18.5% of population was over 65%. A high percentage of elderly population translates in more healthcare expenses.
The Emerging markets growth in industry sales, comes from the fact that recent development and economic growth, in several of these countries, brought populations conditions to pay health care and allowed governments to provide better health care conditions. Industry sales, in the emerging markets, grew from $168 000 million to $208 000 million, the biggest sales growth of every geographic region.
Although the Emerging markets are seen as the region with the biggest growth potential, the USA, Europe and other established markets still account for 77% of industry sales.
17 3.5 – World sales by therapeutic area
Therapy areas are the fields where companies do their research and development, in order to produce medicines to fight the main diseases affecting world populations. The top 10 diseases with higher levels of revenue, account for 84% of total industry sales and are the ones included in the graphic above3.
Oncology is the area that deals with tumours and cancer. Cancer is one of the diseases with the highest number of mortality cases. According to the World Health Organization, in 2012, there were 14 million new cases (7.4 million men and 6.7 women) and 8.2 million deaths by cancer. The most common types of cancer are lung cancer, breast cancer, stomach cancer and colorectal cancer. It is expected that the number of new cases raises by 70% in the next 2 decades, to 22 million. The oncology field is the new leading therapeutic area by sales, growing $12 783 million from 2010 to 2014. Last year achieved $74 734 million in global sales.
The second biggest therapeutic area is Cardiovascular, which is related with heart diseases. In 2012, it caused the death of 17.5 million people worldwide, of which, 7.4 million due to coronary heart disease and 6.7 million due to stroke. In the future, scientists expect a rise in cardiovascular deaths of 23.3 million by 2030. It was the leading area, representing $83 579 million in global sales in 2010. 2014 was the worst year, accounting for $50 475 million in global sales. This downward trend is due to patents expirations in most big pharmaceutical companies and the consequent appearance of generic versions.
3 Absolute values available in Annex 12
$10.000,00 $20.000,00 $30.000,00 $40.000,00 $50.000,00 $60.000,00 $70.000,00 $80.000,00
Sales in millions of USD
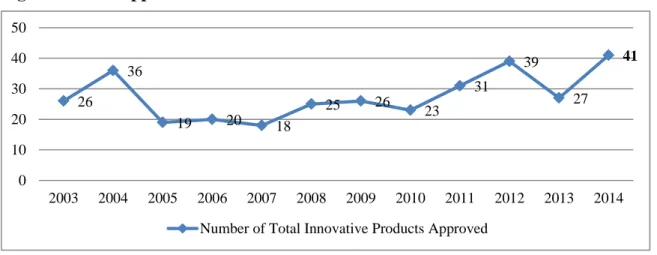
Source: Bloomberg
18 Source: Bloomberg 26 36 19 20 18 25 26 23 31 39 27 41 0 10 20 30 40 50 2003 2004 2005 2006 2007 2008 2009 2010 2011 2012 2013 2014 Number of Total Innovative Products Approved
Autoimmune diseases occur when the body's immune system attacks healthy cells rather than bad cells, affecting the body own tissues. There are more than 80 different known types of autoimmune diseases and can affect every part of the body. Since 2004, this therapeutic area sees constant growth and from 2010 to 2014 doubled its global sales. Last year, it posted $42 478 million in global sales, a record high.
Diabetes is a condition associated with high levels of blood sugar and can damage eyes, kidneys, nerves and heart. There are over 347 million people and it is expected to be the 7th cause of death by 2030. Diabetes numbers are growing every year, in number of patients and in global sales. In 2014, accounted for $36.917 million of the total industry sales and analysts expect $55.300 million by 2017. Obesity, physical inactivity and a promising pipeline of new drugs are amongst the reasons that support this growth.
3.6 – Regulatory Entities
The US Food and Drug Administration, founded in 1906, is the American regulatory entity responsible for securing public health. With this goal, it is the authority that ensures the safeness, effectiveness and approves all the medicines sold in the United States.
As mentioned earlier, the United States are the major geographic market of this sector, which makes the number of FDA approvals a key industry indicator.
Last year, FDA achieved the highest number of medicine approvals since 2000 after a slump in 2013, result of the exploration of new product areas, more specific than the traditional ones. Figure 8 - FDA approvals 2003 - 2014
19 In European Union, the regulatory system is more complex than in the US and it is not centralized in one entity. European Commission, regulatory authorities of the European Economic Area members and the European Medicines Agency operate jointly to ensure medicine safeness.
There are different ways a company can use to make its medicines approved for marketing in the EU.
For innovative medicines, it must be used the centralized way. The pharmaceutical company submits a market authorization application to the European Medicines Authority, which starts clinical trials and scientific processes to conclude about the safeness and efficiency of the new medicine. After testing, EMA gives its opinion on whether the medicine should be authorized or not to be marketed in the EU. If authorized by the European Commission, the medicine is available to be sold in all EU members.
When a company wants to sell a new medicine in more than one EU country it can follow two paths.
Using the decentralised procedure, the company seeks approval to sell the medicine in several EU member states without the compulsory steps of the centralized way. This path is only for medicines which do not have authorization to be marketed in any EU country.
For medicines which have been already approved in one member state, the company uses the mutual recognition procedure. In this procedure, the company applies for the extension of the authorization to the other EU member states. Countries rely on the scientific assessment of local regulatory authorities.
All EU member states regulatory authorities follow the same rules and procedures to evaluate medicines. Every human or veterinary medicine approved or rejected is presented in a European Public Assessment Report (EPAR), after being analysed by EMA.
After marketing approval, each member state considers the potential use of the medicine by the national health system and concludes about the pricing and refund.
Additionally, there are the Pharmaceuticals and Medical Devices Agency in Japan and the State Food and Drug Administration in China, which have their own criterion and clinical test requirements.
20 3.7 – Medicine development process
The development process of a new medicine is costly, complex and implies risk with no guarantees of success. It takes several years from the first investments in R&D until the launch of the new medicine in the market. In order to clarify the creation process of a new medicine, the following explanation is based on the US Food and Drug Administration process and regulations, because it is the most closely followed by the analysts.
Figure 9 - From discovery to market launch by FDA criterion
The path begins with laboratory research, when scientists discover a potential unmet medical need. This step takes, on average, 2 to 5 years to complete.
Next, the new finding starts to be tested using animals and in vitro laboratory experiments. This stage is called pre-clinical testing and takes, on average, 1 year. Researchers will try to assess, for the first time, if the new discovery is safe for human health, in what quantities it should be used, disease healing efficiency and potential side effects. During pre-clinical tests, company starts seeking for patent protection for the intellectual property.
The development period begins with FDA's Phase I. In this stage, the new medicine is tested on a small group (20 to 80) of healthy human volunteers. The goal is to find the risk/benefit profile by studying how the human body reacts and processes the medicine; clarify safe dosage; and side effects. Also, the manufacturing process starts to be developed, to reduce costs and ensure high production levels. Phase I clinical testing takes 1 year.
Next stage of development is FDA's Phase II, where the medicine is used by a group of 100 to 300 patients, over 2 years. In this phase the company can calculate the effectiveness and body tolerability of the new medicine on humans affected by the disease. During this process, starts the preparation of FDA's Phase III to insure that all the data required for the medicine’s approval, is available. Additionally, the company prepares the medicine pricing and looks for
Pre -clinical testing Discovery Phase I Phase II Phase III Regulatory Approval Market Launch Source: U.S. Food and Drug Administration
21 external advisory to find ways to prove the differentiating elements of the new medicine from existing medicines.
Concluding Phase II with success allows the medicine to enter FDA's Phase III and be tested in a larger group of patients (around 1 000 patients). With these clinical trials, the dangers and the benefits of using the new drug are assessed more broadly, as the larger group helps to improve knowledge on how the medicines provides an effective treatment for the disease is trying to fight. The information obtained will be used to define the medicines risk/benefit profile. On the commercial side, the medicine brand is created to prepare its market launch. It takes about 3 to 4 years to conclude Phase III.
If the new medicine passes successfully these three Phases, the company looks for regulatory approval to start producing and launch the medicine in the market. It must deliver to the regulatory authority every piece of clinical data obtained in the three phases of the process to prove the efficiency and security of the new medicine. The regulatory authority has to decide if the medicine needs further testing or if it can be approved.
After about 10 years of research and regulatory processes, the new medicine is launched in the market and prescribed to patients. Although the new medicine is already available in the market, the company needs to constantly monitor it for possibly new side effects found, to the extent of updating the side effects warning.
During the medicines' life-cycle the company has to continuously search for more knowledge about disease healing efficiency and possibility extent of patient population it can be prescribed.
Recently, companies are investing in biologic medicines, which extend product life by being more difficult to be substituted by generics.
3.8 – Intellectual Property
Intellectual property is the biggest asset of “pure” pharmaceutical company, so the industry needs a clear and fair patent system.
A patent is an incentive to innovation. It gives companies a safe guard for their discoveries and allows them to recover the huge investments needed in R&D and regulatory requirements.
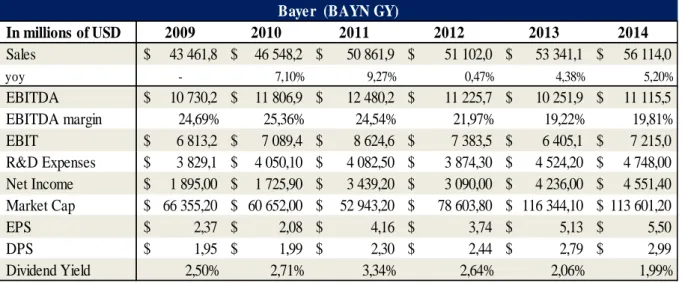
22 Source: Bloomberg and Bayer 2014 annual report
In millions of USD 2009 2010 2011 2012 2013 2014 Sales $ 43 461,8 $ 46 548,2 $ 50 861,9 $ 51 102,0 $ 53 341,1 $ 56 114,0 yoy - 7,10% 9,27% 0,47% 4,38% 5,20% EBITDA $ 10 730,2 $ 11 806,9 $ 12 480,2 $ 11 225,7 $ 10 251,9 $ 11 115,5 EBITDA margin 24,69% 25,36% 24,54% 21,97% 19,22% 19,81% EBIT $ 6 813,2 $ 7 089,4 $ 8 624,6 $ 7 383,5 $ 6 405,1 $ 7 215,0 R&D Expenses $ 3 829,1 $ 4 050,10 $ 4 082,50 $ 3 874,30 $ 4 524,20 $ 4 748,00 Net Income $ 1 895,00 $ 1 725,90 $ 3 439,20 $ 3 090,00 $ 4 236,00 $ 4 551,40 Market Cap $ 66 355,20 $ 60 652,00 $ 52 943,20 $ 78 603,80 $ 116 344,10 $ 113 601,20 EPS $ 2,37 $ 2,08 $ 4,16 $ 3,74 $ 5,13 $ 5,50 DPS $ 1,95 $ 1,99 $ 2,30 $ 2,44 $ 2,79 $ 2,99 Dividend Yield 2,50% 2,71% 3,34% 2,64% 2,06% 1,99%
Bayer (BAYN GY)
Patent policy is different in every territory and it has limited duration. In most countries, after 20 years the patent expires and the company loses the right to exclusively produce and market the medicine. When this happens, generic versions start to be sold in the market. Patent expiration is usually associated with a negative impact on pharmaceutical companies’ sales. Considering that most part of the protected years are spent in clinical tests and regulatory requirements, some of the major markets have Patent Term Extensions. This extension varies from zero to five years depending on the market and on the medicine in question.
The data submitted in every step of the regulatory procedures is also considered intellectual property and is subject to intellectual property protection. It is called “data exclusivity” or “regulatory data protection” and protects the clinical information of the testing phases from being used by competitors. The “regulatory data protection” period begins when the new medicine is approved for sale.
The regulatory data protection differs in duration and rules from country to country. The EU grants a period of 8 years plus 2 years for the right to be the exclusive seller. The US grants 12 years data exclusivity for new biologic components.
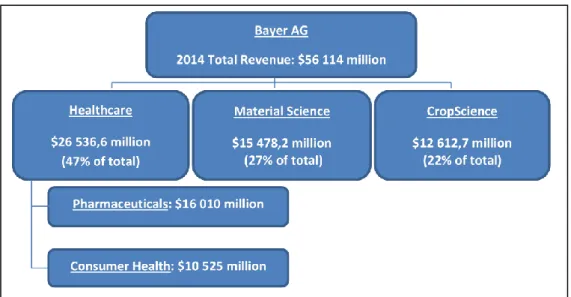
3.9 – European Pharmaceutical Large Cap 3.9.1 – Bayer AG (Price: €1134)
Figure 10 - Bayer AG results overview 2009 – 2014
23 Bayer AG is a German company, based in Leverkusen, Germany. It quotes in Euros in the Deutsche Bourse. It was founded in 1863 and is the creator of several well-known medicines and medical substances, such as aspirin and heroin.
The company is divided in three business areas, HealthCare, CropScience and Material Science. Bayer HealthCare unit deals with animal health, consumer care, medical care and pharmaceuticals.
CropScience is the environmental science unit, which does research and commercializes insecticides, herbicides and other agricultural products.
MaterialScience is responsible for polycarbonates, polyurethanes and other high tech polymer materials.
Bayer pharmaceutical unit focuses on 5 therapeutic areas5: cardiology, oncology, ophthalmology, hematology and gynecology.
Bayer major markets are Europe, USA and Asia Pacific. Unlike most pharmaceutical companies, the US is not Bayer main market, accounting for 24.26% of 2014 sales. Europe is the biggest geographic market representing 37.42% of 2014 total sales.
5 Bayer sales by therapy in Annex 29
Source: Bloomberg and Bayer 2014 annual report
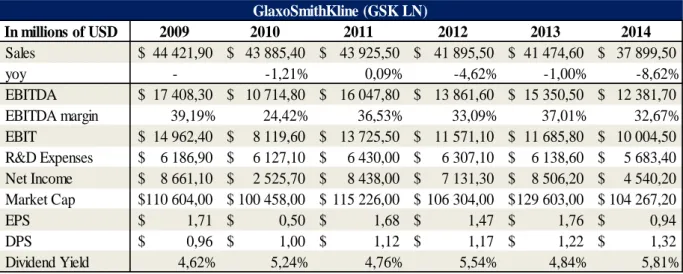
24 Source: Bloomberg and GSK 2014 annual report
In millions of USD 2009 2010 2011 2012 2013 2014 Sales $ 44 421,90 $ 43 885,40 $ 43 925,50 $ 41 895,50 $ 41 474,60 $ 37 899,50 yoy - -1,21% 0,09% -4,62% -1,00% -8,62% EBITDA $ 17 408,30 $ 10 714,80 $ 16 047,80 $ 13 861,60 $ 15 350,50 $ 12 381,70 EBITDA margin 39,19% 24,42% 36,53% 33,09% 37,01% 32,67% EBIT $ 14 962,40 $ 8 119,60 $ 13 725,50 $ 11 571,10 $ 11 685,80 $ 10 004,50 R&D Expenses $ 6 186,90 $ 6 127,10 $ 6 430,00 $ 6 307,10 $ 6 138,60 $ 5 683,40 Net Income $ 8 661,10 $ 2 525,70 $ 8 438,00 $ 7 131,30 $ 8 506,20 $ 4 540,20 Market Cap $ 110 604,00 $ 100 458,00 $ 115 226,00 $ 106 304,00 $ 129 603,00 $ 104 267,20 EPS $ 1,71 $ 0,50 $ 1,68 $ 1,47 $ 1,76 $ 0,94 DPS $ 0,96 $ 1,00 $ 1,12 $ 1,17 $ 1,22 $ 1,32 Dividend Yield 4,62% 5,24% 4,76% 5,54% 4,84% 5,81% GlaxoSmithKline (GSK LN)
In 2015, is expected some newsflow from medicines in testing phases. Finerenone, a medicine for heart failure, is expected to succeed in FDA Phase II and became a long term growth driver. Xarelto sales are expected to raise a compound annual growth rate of 16%6, driving the operating margin up. Also important will be the integration in Bayer of Merck & Co’s consumer business.
3.9.2 – GlaxoSmithKline Plc (Price: ₤13.767)
GlaxoSmithKline Plc is a British company, headquartered in Brentford, United Kingdom. The company was founded in 2000 by the merger between Glaxo Wellcome and SmithKline Beecham. Its stock is listed in the London Stock Exchange and in NYSE.
The company research, develops, produces and sells pharmaceuticals, consumer healthcare products and vaccines. Considering the pharmaceutical unit, GSK produces medicines for respiratory diseases, oncology, cardiovascular, metabolic and urology diseases, immune-inflammation and HIV.
6
According to JP Morgan Cazenove European Pharmaceutical published on 5 January 2015
7 Daily last price as of 31/12/2014
25
In millions of USD 2014 % of Total Sales
Respiratory $ 10 182,40 26,87%
Oncology $ 1 980,00 5,22%
Cardiovascular & Metabolism $ 1 589,70 4,19%
Immuno-inflammation $ 352,50 0,93%
ViiV Healthcare (HIV) $ 2 467,80 6,51%
Others $ 8 925,40 23,55%
Other sources of Revenue $ 12 401,70 32,72%
TOTAL Pharmaceuticals $ 25 497,80 67,28% GlaxoSmithKline (GSK LN)
These therapeutic areas represent 67.28% of company revenue. The most important area is Respiratory, in which the company is a global leader. It accounts for 26.87% of the total sales. Oncology is a recent business but already weighs 5.22% in company sales.
Geographically, the major market is the US accounting for 29% of total revenues, followed by Emerging Markets with 18.5% and Europe with 17.5%.
Sales evolution in recent years have not been good, sales were down 8.62% in 2014. EPS also saw a sharp fall last year to $0.94. Although 2014 was a good year for Oncology and HIV units, Respiratory and Cardiovascular units pushed sales down.
Considering geographic markets, sales were down in US, Europe and Japan. Emerging Markets reported year on year growth but not enough to compensate the $1745 million fall in US sales.
Nevertheless, the company shows an attractive dividend yield with growing dividend per share, compared with peers.
In 2015, is not expected great news from its medicine pipeline and there is no medicine looking to become a long term growth driver. Some good news can come from chronic obstructive pulmonary disease medicines. The differentiation of its medicine Breo from Novartis Advair, is a key element for GSK growth.
Source: Bloomberg and GSK 2014 annual report Figure 13 - GSK sales by therapeutic area in 2014
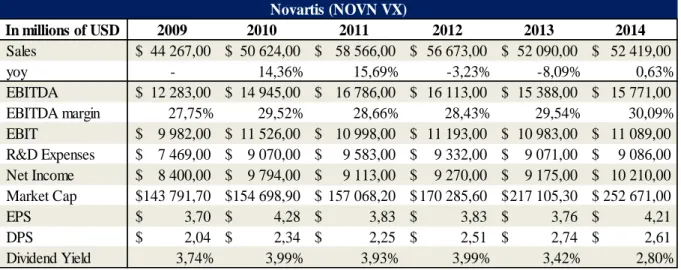
26 3.9.3 – Novartis AG (Price: CHF 92.358)
Novartis is a Swiss company, based in Basel, Switzerland. The company is the result of a merger between two Swiss companies, Ciba-Geigy and Sandoz Laboratories in 1996.
It is quoted in the Swiss Exchange, in the NYSE and is one of the components of Stoxx 600 index.
Company business is divided in 5 areas, but Pharmaceuticals, Alcon and Sandoz represent 99% of company sales. The company pipeline counts with 135 projects in development. Pharmaceutical is the division responsible for development, testing, production and selling of innovative medicines. The company operates in Oncology, Cardiovascular, Neuroscience, Ophthalmology and Infectious diseases. Novartis pharmaceutical unit accounts for 61% of its sales, being the largest unit of the company.
8 Daily last price as of 30/12/2014
Source: Bloomberg
In millions of USD 2014 % of Total Sales
Oncology $ 11 703,00 22,33%
Cardiovascular & Metabolism $ 7 961,00 15,19%
Neuroscience $ 4 509,00 8,60% Ophtalmology $ 2 504,00 4,78% Infectious Diseases $ 3 112,00 5,94% Others $ 2 002,00 3,82% TOTAL Pharmaceuticals $ 31 791,00 61,25% Novartis (NOVN VX)
Source: Bloomberg and Novartis 2014 annual report
In millions of USD 2009 2010 2011 2012 2013 2014 Sales $ 44 267,00 $ 50 624,00 $ 58 566,00 $ 56 673,00 $ 52 090,00 $ 52 419,00 yoy - 14,36% 15,69% -3,23% -8,09% 0,63% EBITDA $ 12 283,00 $ 14 945,00 $ 16 786,00 $ 16 113,00 $ 15 388,00 $ 15 771,00 EBITDA margin 27,75% 29,52% 28,66% 28,43% 29,54% 30,09% EBIT $ 9 982,00 $ 11 526,00 $ 10 998,00 $ 11 193,00 $ 10 983,00 $ 11 089,00 R&D Expenses $ 7 469,00 $ 9 070,00 $ 9 583,00 $ 9 332,00 $ 9 071,00 $ 9 086,00 Net Income $ 8 400,00 $ 9 794,00 $ 9 113,00 $ 9 270,00 $ 9 175,00 $ 10 210,00 Market Cap $ 143 791,70 $ 154 698,90 $ 157 068,20 $ 170 285,60 $ 217 105,30 $ 252 671,00 EPS $ 3,70 $ 4,28 $ 3,83 $ 3,83 $ 3,76 $ 4,21 DPS $ 2,04 $ 2,34 $ 2,25 $ 2,51 $ 2,74 $ 2,61 Dividend Yield 3,74% 3,99% 3,93% 3,99% 3,42% 2,80% Novartis (NOVN VX) Figure 14 - Novartis results overview 2009 - 2014
27 In millions of USD 2009 2010 2011 2012 2013 2014 Sales $ 9 565,80 $ 10 826,50 $ 12 398,80 $ 13 478,50 $ 14 884,60 $ 15 824,90 yoy - 13,18% 14,52% 8,71% 10,43% 6,32% EBITDA $ 3 274,40 $ 3 804,70 $ 4 646,60 $ 5 535,90 $ 6 107,60 $ 6 758,50 EBITDA margin 34,23% 35,14% 37,48% 41,07% 41,03% 42,71% EBIT $ 2 796,60 $ 3 365,20 $ 4 181,30 $ 5 091,50 $ 5 609,10 $ 6 146,30 R&D Expenses $ 1 472,80 $ 1 710,50 $ 1 799,30 $ 1 882,40 $ 2 089,70 $ 2 452,30 Net Income $ 2 016,60 $ 2 565,70 $ 3 195,10 $ 3 702,20 $ 4 485,40 $ 4 718,80 Market Cap $ 39 665,50 $ 67 143,50 $ 66 741,10 $ 90 964,50 $ 101 141,50 $ 112 619,60 EPS $ 0,67 $ 0,88 $ 1,13 $ 1,35 $ 1,67 $ 1,80 DPS $ 0,28 $ 0,36 $ 0,52 $ 0,62 $ 0,80 $ 0,89 Dividend Yield 2,26% 1,59% 2,12% 1,96% 2,26% 1,92%
Novo Nordisk (NOVOB DC)
Alcon is the second largest division of Novartis. It develops, produces and commercializes eye care medicines and devices. It is the global leader in this field accounting for 20% ($10.827 million in 2014) of Novartis sales.
Sandoz is the generic division of Novartis, which means it produces and markets medicines that lost their patents and can now be produced by any company. In 2014, Sandoz revenue was $9.562 million, weighting 18% in Novartis total sales.
Novartis operates in 150 countries worldwide. The major market is Europe, 36.72% of sales, and the United States are the second accounting for 32.40% of total sales. Asia, Africa and Australasia (Oceania) represent 21%.
In 2015, is expected the launch of LCZ696, a cardiovascular medicine. The promising results obtained in the testing phase anticipate strong demand when the medicine reaches the market. Also promising is Novartis pipeline, in particular medicines to fight breast cancer and geographic atrophy which are due to report latest discoveries in 2015.
3.9.4 – Novo Nordisk A/S (Price: DKK 260.309)
Novo Nordisk is a Danish pharmaceutical company, based in Bagsvaerd, Denmark. It quotes in the Copenhagen Exchange and is included in the Stoxx 600 index.
9 Last daily price as of 30/12/2014
Figure 16 - Novo Nordisk results overview 2009 – 2014
28 Source: Bloomberg North America 49% Europe 23% China 9% Japan and South Korea 5% Rest of the World 14%
The company is the result of a merger, in 1989, of two Danish companies, Nordisk Insulinlaboratorium, founded in 1923, and Novo Terapeutisk, founded in 1925. Both companies focused on the production of insulin and development of medical products to fight diabetes.
Today it has 4 therapeutic areas, diabetes, haemostasis management, growth hormone therapy and hormone replacement. These last 3 areas are included in the biopharmaceutical unit which represents 46% of total sales.
The key area of Novo Nordisk is diabetes, in which the company researches, developments and markets several medicines and devices. Diabetes represents 78.8% of Novo Nordisk total sales.
The Danish company is very exposed to the US market, which represents almost half of its total sales, followed by Europe with 23% of contribution to sales.
Novo Nordisk presents constant sales growth since 2009 and at a good pace, achieving 10.59% CAGR. EBITDA margins are also very good, 42.71% in 2014, which is 10% better than peers. Net Income doubled in 5 years, from $2 016 million to $4 718 million.
In 2015, the company expects “high single digit” sales growth. Good news are expected from the testing of Semaglitude, a new diabetes treatment, FIAps, a new version of insulin and oral
GLP-1, a medicine that stimulates the release of insulin when blood sugar is low.
29 In millions of USD 2014 % of Total Sales
Oncology $ 24 931,70 48,03% Immunology $ 5 563,30 10,72% Infectious Diseases $ 3 493,10 6,73% Ophtalmology $ 1 860,00 3,58% Neuroscience $ 794,00 1,53% Others $ 3 489,80 6,72% TOTAL Pharmaceuticals $ 40 131,90 77,32% Roche (ROG VX) Source: Bloomberg
Source: Bloomberg and Roche annual report 2014
In millions of USD 2009 2010 2011 2012 2013 2014 Sales $ 45 310,40 $ 45 671,90 $ 48 153,50 $ 48 543,90 $ 50 495,60 $ 51 906,40 yoy - 0,80% 5,43% 0,81% 4,02% 2,79% EBITDA $ 17 491,90 $ 17 661,50 $ 20 259,50 $ 20 205,40 $ 20 711,00 $ 18 278,00 EBITDA margin 38,60% 38,67% 42,07% 41,62% 41,02% 35,21% EBIT $ 15 004,30 $ 15 206,30 $ 17 578,80 $ 17 622,40 $ 18 140,80 $ 15 409,40 R&D Expenses $ 9 121,00 $ 9 645,60 $ 9 426,70 $ 10 191,20 $ 10 006,30 $ 10 920,00 Net Income $ 7 190,40 $ 8 337,20 $ 10 578,10 $ 10 057,90 $ 12 050,70 $ 10 205,90 Market Cap $ 147 115,50 $ 127 120,40 $ 147 120,40 $ 147 548,70 $ 174 343,40 $ 241 873,00 EPS $ 8,38 $ 9,76 $ 12,47 $ 11,86 $ 14,21 $ 12,02 DPS $ 5,54 $ 6,35 $ 7,70 $ 7,84 $ 8,42 $ 8,75 Dividend Yield 3,41% 4,82% 4,27% 3,99% 3,13% 2,96% Roche (ROG VX) 3.9.5 – Roche AG (Price: CHF 269.9010)
Roche Holding AG is a Swiss based pharmaceutical company. Founded in 1896 by Fritz Hoffman-La Roche, is headquartered in Basel, Switzerland. The company first started to produce vitamins and related products. It was the first company to mass produce synthetic vitamin C, in 1934 and discovered the first antidepressant, in 1956.
Nowadays, Roche has two main sources of revenues, pharmaceuticals and diagnosis. Pharmaceuticals account for 77.32% of Roche sales and is divided into Oncology, Immunology, Infectious diseases, Ophthalmology, Neuroscience and other therapeutic areas.
10 Daily last price as of 30/12/2014
Figure 18 - Roche AG results overview 2009 – 2014