A Distributed Load Scheduling Mechanism for
Micro Grids
Jânio Monteiro
1,2, Jorge Eduardo
1, Pedro J. S. Cardoso
1,3, Jorge Semião
1,2 1 ISE, University of Algarve, Faro, Portugal2 INESC-ID, Lisbon, Portugal
3 LARSys, University of Algarve, Faro, Portugal Emails: {jmmontei, jmeduardo, pcardoso, jsemiao}@ualg.pt
Abstract— Several protocols have recently been defined for
smart grids that enable the communication between electric devices and energy management systems. While these protocols and architectures can already be applied in different fields of micro grids, it is still not clear how the distributed resources and constraints of such electrical grids can be managed in an optimum way. In order to achieve a reduction in electricity costs and maximizing investments made in renewable sources, an optimization mechanism should be used to perform load scheduling, considering different variables such as forecasted power generation curve from renewable sources, different tariffs’ rates, electric circuit constraints, user restrictions and correspondent comfort levels. Given these considerations, this work defines and evaluates a distributed micro grid resource management architecture and protocol which is able to optimize load scheduling while considering all the mentioned restrictions and parameters. The proposed architecture was implemented on a multi-agent simulator and the performed tests show that significant reductions in electricity cost can be achieved using this methodology.
I. INTRODUCTION
When comparing current electrical grids with the ones that we had a few years ago, a very different dynamism is verified which results from the increasing introduction of renewable energy sources. Those renewable power sources are sometimes characterized as Intermittent Resources (IRs), as they depend on environmental factors that make them significantly vary over time, and difficult to predict with accuracy. This may in turn cause inefficiencies and mismatches of various kinds in the necessary equilibrium between production and consumption.
In order to reduce these mismatches several solutions can be considered. Some proposals opt for promoting an adjustment in the consumption side using dynamic tariff rates (so called Demand Side Management) using dynamic tariff rates, so that the consumption may adapt to the power being produced. In this field, Distribution System Operators (DSOs) typically buy electricity in markets that already define their prices daily, reflecting the forecasted supply and demand data for the following day (as for instance happens in [1]). These dynamic tariffs are also being applied to DSO customers in various regions of Europe and United States [2], because constant tariff rates do not correlate with the marginal costs of production [4]. Based on these tariffs, either automatically or
by human intervention, the working periods of equipment can be changed to take advantage of the lowest price and high production.
In this sense, the goal of creating a system capable of energy management is to implement a set of so-called smart objects [4], supported in the concept of the Internet of Things (IoT), that by communicating with each other and acting based on an optimized control system, allow a better use of the energy produced by renewable energy sources and the improvement of energy management in buildings.
In terms of energy control, several protocols like the Smart Energy Profile - Version 2 (SEP 2.0) [5], IEEE 1888 [6], and the OpenADR 2.0 [7] protocol architectures have already been defined. However, while these protocols and architectures can already be applied to Micro Grids, a mechanism is necessary to enable the management and control of the distributed resources that are typically available in such grids.
One of such resources is electrical power. In fact, while until now load scheduling has been performed non-automatically, the introduction of automatic management systems in medium to large scale installations can cause demand hikes at low price periods, causing a disruption of supply, due to overloading. Thus, a Micro Grid energy management system should take into consideration electrical circuit constraints [8], while reducing electricity costs and maximizing investments made in renewable sources equipment. That mechanism should implement load scheduling, resulting from optimization algorithms that reflect user comfort levels and restrictions [9]. It should also consider the forecasted renewable power generation and the different rate tariffs from the DSOs.
Given these considerations, this paper introduces a new Micro Grid energy management system which, considering a tree based electrical grid [8], defines a communication and control structure composed by agents. To test our proposal, a simulator based on a Multi Agent System [10] was implemented and the experimental tests show that electricity cost reductions can be achieved once the management system is used.
The remainder of the paper has the following structure. Section II analyses a Micro Grid structure and set of protocols developed for communication and control in such electrical grids. Section III, proposes a Resource Management Protocol
Fig. 1. Example of micro-grid architecture with a tree structure comprising several Distribution Boards and having a renewable generator, in node G.
for the distributed management of Micro Grids. Section IV described the simulation platform and results obtained using the proposed protocol. Finally, section V concludes the paper.
II. MICRO GRID STRUCTURE AND PROTOCOLS A. Communication Protocols in Smart Grids
The user’s ability to manage their energy consumption according to the production is a critical feature of Smart Grids, and a base for innovation, new products and services. In order to support this capability, the communication between different devices such as meters, appliances, electric vehicles, energy management systems and distributed energy resources (including renewable energy and storage) must occur using secure, standard and open procedures. In this context, several protocols have been recently defined.
One of these protocols, the Smart Energy Profile [5] results from the collaboration between the low-power ZigBee, Wi-Fi and HomePlug power-line technologies, building a power management architecture for Micro Grids, supported on IP networks.
In March 2011, the Institute of Electrical and Electronics Engineers (IEEE) announced the approval and publication of the Standard for Ubiquitous Green Community Control Network Protocol (IEEE 1888 TM) [6] within the Ubiquitous Green Community Control Network Protocol (UGCCNet). Originating in China, the IEEE 1888 standard defines itself as a global standard within the IoT, which aims at energy efficiency through the management of renewable energy, through communication using Internet protocols and Information and Communication technologies.
Another communication protocol for Smart Grids is the Open Automated Demand Response (OpenADR) version 2.0 [7]. The OpenADR is an evolution and extension of the first version, developed by the Demand Response Research Center at Lawrence Berkeley National Laboratory. It is supported by the OpenADR industrial alliance, having been developed as part of the standard OASIS Energy Interoperation 1.0, published in February 2012 [11].
If on one hand the protocols that allow communication between different devices of a Micro Grid are being developed, a control procedure is still needed to support an optimized load scheduling when managing distributed resources. This is the purpose of the forthcoming sections.
B. Micro-Grid Architecture
Fig. 1 presents a typical structure of a low voltage Micro Grid [8], common among industrial and business facilities. These structures are comprised of a hierarchy of Distribution Boards (DB), where the Main General Distribution Board (MGDB) interconnects the external DSO circuits to several internal workshop circuits (represented as A, B/Bx, C/Cx and D, in Fig. 1). Workshop DBs can be divided into intermediate DBs if they obligatorily feed other lower level DBs, and possibly, electrical loads (e.g., B and C in Fig 1) or leaf DB if they only feed loads (e.g., A, B1, B2, B3, B4, C1, C2 and Din Fig. 1).
At the lower levels we find electrical loads (represented by orange boxes in Fig. 1). They can be controlled in terms of one or more of the following parameters: when to start, when they should finish, or the maximum power to be drawn from the electrical grid. Some of them can also be controlled through indirect parameters, like for instance HVAC (heating, ventilation, and air conditioning) set point temperatures. Finally, some loads are not controllable and/or individually monitored.
Each intermediate and leaf DB can connect tens of circuits, aggregating hundreds of loads. Furthermore, simultaneity (or diversity) factors, ks, are applied at each DB level, considering that not all equipment runs at the same time. Usually, the simultaneity factor values range from 0.1 to 1.0, depending on the type of loads that are connected to a certain circuit. They enable the computation of the expected resulting aggregated load, which is drawn from higher levels boards. This procedure is repeated in higher DBs, leading to an expected total demand for the full installation (exemplified as 50 kVA in Fig. 1). The aggregated power of these installations can easily reach hundreds of kVA in industrial installations, distributed over tens of DBs.
Simultaneity factors result from practice and considering that working periods of equipment are typically spread over time. However, they were not computed considering that many devices could work at the same time, as it may happen if a period of lower tariffs is combined with a greedy automatic load shifting. Thus if scheduling is applied to loads, some measures as the one proposed in the next sections should be taken to avoid overloads.
C. Communication Architecture
Given the architecture presented in Fig. 1, the communication structure that controls and monitors electric devices should derive from the electrical structure. Thus, in such control system, we consider that a Monitoring and Control Device (MCD) should be placed at each DB. The set of MCDs will form a distributed Energy Management System (EMS) of the whole installation.
At each distribution board, MCDs measure the current, voltage, active and reactive power consumed from the upward circuit, while communicating through wireless and/or wired Sensor Networks (SN) with electrical equipment. Sensors devices are also used to measure ambient data (e.g., temperature, movement, and light intensity).
MCD devices are thus in charge of Machine-to-Machine communication while reflecting Human-to-Machine interactions. Based on these inputs they define when terminal devices should work. These load scheduling decisions should result from optimization algorithms that take into consideration: (1) the forecasted power curves of installed renewable sources in the yet-to-come minutes/hours; (2) the power consumption curve of each equipment/load; (3) the future minute/hourly based tariffs charged by the DSO; (4) the local and global power constraints imposed by the electrical installation; and (5) human requirements and comfort levels.
Given the computation capabilities available in many electronic devices, MCDs are currently capable of running optimization algorithms and communicating with each other for the management of distributed resources, which are shared by the whole micro grid. While this distributed architecture is capable of parallel computing, it also places several challenges in terms of coordination between control devices and scalability.
In order to address these issues, in the following we consider that optimization algorithms for load scheduling run in a distributed fashion at MCDs, making local decisions that reflect a global equilibrium of the system. Given these considerations, we will define and evaluate a communication mechanism that can be used to manage these electrical devices.
III. ARESOURCE MANAGEMENT PROTOCOL FOR MICRO
GRID MANAGEMENT
A. Introducing Distributed Resource Reservation
The problem of distributed resource reservation has been addressed previously in computer networks. The Resource Reservation Protocol (RSVP) in particular, specified in IETF RFC2205 [12] and updated since then with several features, was used to support a distributed Quality of Service (QoS) resource reservation procedure among several Integrated Services routers [13].
RSVP considers two fundamental message types: PATH and RESV. In IP Multicast trees, the PATH message travels downstream along the multicast routes with information about the traffic that the sender application expects to generate and storing path state with the QoS control capabilities of routers along the path. RESV messages are originated in leaf nodes and travel upstream, being used to request an appropriate resource reservation from the desired QoS. As RESV messages move from receivers to senders, reservation parameters are merged at intermediate nodes.
While the RSVP protocol cannot be applied directly to the resource reservation problem described in sections II.B and II.C, a similar concept may be used to implement a distributed mechanism for load management.
B. Micro Grid Resource Management Protocol
Differently from the RSVP protocol, that only reserves flows for a subsequent time period, in the optimization mechanism that we are considering, such requests should also address future time intervals. This means that resource request messages must carry a vector of n power requests, where each index refers to a time interval (for instance for the 5 minutes interval between 10:15 and 10:20). In this case, index 0 refers to present time and subsequent indexes refer to future time intervals.
The proposed Micro Grid Resource Management Protocol considers two communication phases (as shown in Fig. 2), which are similar with the ones that were defined for RSVP. For each of these phases one message type is used: a Resource Information (RI) message, and a Resource Allocation (RA) message.
In the first stage, the MCD at the top of the tree multicasts RI messages. Each of these messages contains three vectors, represented by (R, P, C): the R vector informs lower MCDs about the forecasted power that is expected to be generated by renewable sources; P vector translates the ratio of maximum upward power that lower MCDs can allocate; and C contains the energy cost (per kWh) associated with each time interval. Each of the time intervals of the C vector starts by reflecting the tariff of the DSO. However, as explained later, the associated values will be adjusted to avoid cyclic overloading in adjacent time periods, penalizing the intervals where these overloads occur.
As these RI messages traverse down the tree (i.e., from the top to leaf MCDs), P and C vectors may be changed by intermediate MCDs, in order to reflect their own capabilities and state. Thus, when these RI messages reach a leaf MCD, the (R, P, C) vectors reflect the capability of the whole grid, being used as input in the optimization algorithm to decide: when loads should start working, when they should finish and/or what is the power level they are allowed to request [14].
Leaf MCDs, after running the optimization algorithm, generate an aggregate load vector, which is sent upstream using a Resource Allocation (RA) message. Intermediate MCDs, after receiving RA messages from lower MCDs, behave like leaf MCD, i.e. they run optimization algorithms to decide when loads should start working, when they should finish and/or what is the power level they are allowed to request. However, while they may be allowed to perform time shifting of their own loads (depending on the user’s restrictions), they are typically not allowed to shift aggregated loads that they receive from lower level MCDs.
If at some time instant(s), the aggregated load surpasses the maximum allowed upward power of a DB, the MCD must act, since it is not possible to assure the requested power. This may happen if several loads of different downward aggregators are scheduled to work at the same time. At this point, intermediate MCD aggregators should increase the cost of the energy associated with the overload periods and explicitly instruct lower level MCDs to reduce the power they are requesting for the time intervals where overloads happened. In both cases upper level MCDs will inform lower level MCDs about the
Fig. 2. Two stages of the Micro Grid Resource Management Protocol: a) Resource Information (RI) messages travel down the tree carrying information about the resources that are commonly distributed, b) Resource Allocation (RA) messages inform upper nodes about the forecasted power consumption of each aggregator node.
required reschedule of their loads using a subsequent RI message, changing the associated power and cost vectors of (R,
P, C), which will lead lower MCDs to make the necessary
adjustments.
Each time a new load scheduling is requested, an RI message is sent upwards, which triggers the exchange of RA and RI messages. This process stops when the top level MCD verifies that after several repetitions the cost does not improve. It then stops sending RA messages.
Given this brief explanation, in the following we will describe this resource management mechanism in more detail.
C. Optimization Mechanism at MCDs
The task of leaf MCDs is to run the optimization algorithms that minimize the cost of electric consumption of various loads, shifting them in time or adjusting the power consumed, taking into consideration: (1) the electricity tariffs, (2) the power generated from local renewable sources, (3) the time constraints imposed by the user for each device and (4) the micro grid electric structure and constraints.
In order to do this, after receiving an RI message with (R, P, C) vectors, leaf MCDs run a Genetic Algorithm (GA) targeting the minimization of the objective function given by:
T tt
t
C
t
Q
F
1
.
(
)
.
(
)
(
)
, (1)where Q translates the quality assessment of the scheduling solution seen from a user perspective, T represents a set of time intervals, C(t) translates the cost of energy for interval t (obtained from the RI message),
otherwise
t
R
t
P
if
t
R
t
P
t
MCD t MCD0
)
(
)
(
)).
(
)
(
(
)
(
(2) and
otherwise
P
t
P
if
t
MCD0
)
(
)
(
max
. (3)In equations (2) and (3), PMCD(t) translates the sum of
load’s power scheduled to work at the time interval t; Pmax
translates the maximum upward power limit of the DB of the MCD; t translates the time period associated with each R, P or
C vector entrance; and R’ is obtained from the R vector
received in the RI message using equation:
0
)
(
))
(
1
).(
(
0
)
(
&
0
)
(
)
(
)
(
0
)
(
&
0
)
(
)
(
)
(
t
R
if
t
R
t
P
t
R
t
P
if
t
R
t
P
t
R
t
P
if
t
R
t
R
, (4)where
P
(t
)
represents the last requested PMCD(t) vector, in theiterative optimization process. In this sense, R’ translates an estimation of the power generated by renewable sources at time interval t.
Using these equations, the Genetic Algorithm procedure defines when loads should be scheduled to start. These decisions can be conveyed to loads using one of the protocols described in section II.A. However, this can only be made after a micro grid level verification of the solution. In order to obtain it, leaf MCDs send an RA message to an upper level MCD containing the aggregated load vector, PMCD(t).
D. Load Aggregation
After receiving RA messages from lower level MCDs, an upper layer MCD sums up the lower level PMCD(t) load vectors,
generating an aggregated vector of requested power Pr.
If Pr(t) is higher than the maximum power of the upward
circuit (i.e., Pmax) at some time interval(s) t, then the values of
P and C vectors stored in the MCD will be updated, for all the
time intervals t where overloads happened, according to equations:
)
(
)
(
maxt
P
P
t
P
r
(5) andT
e
t
C
t
C
k n
.
1
1
)
(
)
(
0 ( ) (6)where C(t) represents the new value of the energy cost at time interval t , C0(t) is the vector with cost values obtained from the
DSO, T represents a difference between tariffs, k is a constant
used to adjust the responsiveness to repeated overloads and n represents the number of overloads that happened for time t. Equation (6) adds memory to the cost vector with the aim of reducing fibrillation, which happens when several loads continuously and in parallel oscillate around a small set of time intervals. T and k can assume different values according to the
level of the MCD.
After changing the power and cost vectors and before running its own optimization algorithms, Pr(t) is upper limited
to Pmax, for all time instants where overloads occurred. Using
the resulting power margin, the genetic algorithm is used to decide where loads should work, setting the aggregated power vector PMCD, of the intermediate MCD, which is sent to the
upper layer MCD, through a subsequent RA message.
E. The (R, P, C) computation
When RA messages arrive to the top level MCD, it will act like an intermediate node, with the exception that it will not generate a new RA message. Instead, after summing up the
PMCD load vectors received from lower MCDs and obtaining an
aggregated requested power vector Pr, it will change the (R, P,
C) vectors to reflect the capability of the whole grid, before
sending it down in a subsequent RI message.
Regarding the P and C vectors, they will be updated according to the procedure explained in equations (5) and (6), only if and when overloads are expected to happen. For all the time instants t where overloads are not predicted to occur (i.e.,
Pr(t)<Pmax) no information will be conveyed in the P vector of
the RI message. This means that the P vector will not be used to perform a First-Come-First-Serve reservation procedure, which would tend to be unfair with the most recent requests. For those time intervals t where overloads occur, P(t) will equally force a percentage of reduction in all power requests from lower MCDs (given by equation (5)).
Finally, the R vector will be obtained using:
)
(
)
(
)
(
)
(
)
(
)
(
)
(
)
(
)
(
)
(
t
P
t
P
if
t
P
t
P
t
P
t
P
t
P
if
t
P
t
P
t
R
r G r r G r G r G , (7)where PG translates the forecasted generation vector of a
renewable source. For those values where R(t) is positive, it
will convey the forecasted generated power that is still not being used by scheduled loads. However, when Pr(t) surpasses
PG(t), R(t) will be negative and it will carry the ratio of power
that all nodes are requesting beyond the forecasted PG(t). This
value will be used by MCDs to estimate the ratio of power that is not being paid, as expressed by equations (2) and (4).
As these RI messages go down the tree, P and C vectors may be changed by intermediate MCDs, according to their own stored state or capability. In terms of P, values that are sent down in a newly generated RI message are the lowest among the ones received in the RI message and the ones stored in the node. As for the C cost vector, the MCD will send the highest value among received and stores values.
The next section will outline the simulation platform and some experimental test.
IV. SIMULATION PLATFORM AND RESULTS A. Simulator’s framework
The simulator was specified to implement a system where each object (counters, generators and consumers) is an agent within a Multi-Agent System (MAS) [9]. Taking into consideration the specifications, our simulator was implemented using SPADE (Smart Python Multi-Agent Development Environment) [15][16]. SPADE was built around the XMPP/Jabber communication framework and is developed in Python, showing to be a particularly useful system in the implementation of MAS. Its usefulness comes from its support to: (1) the concepts of agent and servers, (2) the implemented communications between agents, (3) the possibility to develop agents in multiple programming languages (4) the processing of agent behaviors and (5) the extensible communication protocol based on XML. Furthermore, SPADE follows the FIPA specifications for MAS [17].
In this sense, the simulator has been implemented as a distributed system where each of the previous defined objects (e.g., MCDs and electrical consumers/load) are connected in a tree structure like the ones described in the previous sections. Each agent implements the corresponding capacities and behaviors as the communication or the optimization actions.
B. Simulation Tests
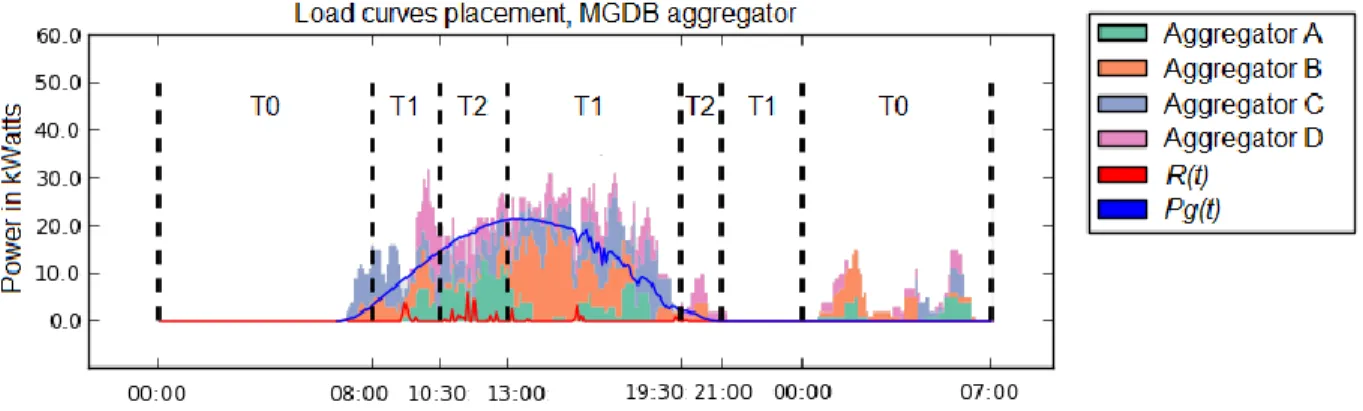
Given the architecture defined in Fig. 1, we have implemented a set of simulations for the scheduling of 143 loads, while considering a tariff with 3 price periods (T0=0.0955 €, T1=0.1642 € and T2=0.2066 €) and a power generation curve obtained from a solar photovoltaic plant with a peak production of 25 kW.
At 7:00 a.m., the lower level MCDs gradually start requesting the scheduling of the loads, representing a total demand of 275 kWh. T in equation (2) was set to 5 minutes,
Fig. 3. Load placement resulting from the distributed scheduling algorithm considering 143 load requests after 7 a.m.
Whenever the MCD receives a scheduling request, it will execute a Genetic Algorithm with a population of 128 individuals, 40 generations, an 1D integer list representation (schedule hours are converted into and from an integer value representation), the roulette wheel crossover operator (with 0.9 crossover probability), and a fitness function which takes into consideration the data received through the described communication process (tariff prices and generation), penalizing scheduled overloads. Furthermore, with 0.1 mutation probability, the Genetic Algorithm uses the swap mutator and a special mutator which moves the charges to the lowest tariffs intervals.
Fig. 3 presents one of the scheduling solutions obtained by the algorithm, together with the tariff periods and generation curve. As can be observed, the algorithm is able to schedule most of the loads to the phase where generation was available, while avoiding more costly tariffs.
Using the same parameters, systematic tests with 20 executions were performed comparing the proposed algorithm with a scenario without load scheduling. The associated average and standard deviation results are shown in Table I.
TABLE I. COST RESULTS OF THE PERFORMED SYSTEMATIC TESTS
Electricity Cost (€)
Evaluation Parameter Without Load Scheduling
With Load Scheduling
Average 17.01 7.98
95% Confidence Interval 17.01 ± 0.67 7.98 ± 0.98
The results of these tests demonstrate that on average the proposed distributed load scheduling mechanism was able to achieve a reduction of 53.1% in the electricity costs, when compared with non-optimized load distribution.
V. CONCLUSIONS
This paper presented and evaluated a new Micro Grid Resource Management Protocol. The proposed system is based on a distributed computational environment where each agent communicates with others to achieve an optimal scheduling for the electrical loads. Among other features, behind the optimization is a Genetic Algorithm which locally optimizes the referred schedule, taking into account the tariff prices, the loads from other objects and the generated power from renewal
energy sources. The results show that significant electricity cost reductions can be achieved using this methodology.
Acknowledgments. This work was partly supported by the Portuguese Foundation for Science and Technology (FCT), project LARSyS PEst-OE/EEI/LA0009/2013 and project MTI QREN I&DT, n. 30260. We would also like to thank the project leader Certigarve [www.certigarve.pt].
REFERENCES
[1] OMI-Polo Español S.A. (OMIE), Available: http://www.omie.es/files/ flash/ResultadosMercado.swf. Accessed: April, 1st, 2014.
[2] Utility-Scale Smart Meter Deployments, Plans & Proposals, Institute for Electric Efficiency, Sep. 2011.
[3] P. L. Joskow and C. D. Wolfram, “Dynamic pricing of electricity,” The American Economic Review, vol. 102, no. 3, pp. 381–385, 2012. [4] J.-P. Vasseur and A. Dunkels, Interconnecting smart objects with ip: The
next internet. Morgan Kaufmann, 2010.
[5] Smart Energy Profile 2, Application Protocol Standard, Zigbee public document 13-0200-00 ed., ZigBee Alliance, Apr. 2013.
[6] IEEE Standard for Ubiquitous Green Community Control Network Protocol, IEEE Std 1888 Std., Apr. 2011.
[7] OpenADR 2.0. Profile Specification. A Profile, OpenADR Alliance, 2012.
[8] "Electrical installation guide 2013, According to IEC international standards", Schneider Electric, 2013.
[9] J. Monteiro, P.J.S. Cardoso, R. Serra, L. Fernandes, "Evaluation of the Human Factor in the Scheduling of Smart Appliances in Smart Grids", 16th Int.. Conf. on Human-Computer Interaction, Jun. 2014, Greece. [10] Y. Shoham and K. Leyton-Brown, Multiagent systems: Algorithmic,
game-theoretic, and logical foundations. Cambridge Univ. Press, 2009. [11] “OASIS Energy interoperation version 1.0”, Feb. 2012.
[12] R. Braden, L. Zhang, S. Berson, S. Herzog, S. Jamin, “Resource ReSerVation Protocol (RSVP)”, IETF RFC2205, Sept. 1997.
[13] J. Wroclawski, “The Use of RSVP with IETF Integrated Services”, IETF RFC2210, Sept. 1997.
[14] Eduardo, J., Cardoso, P., Monteiro, J., “Gestão de Cargas numa Micro Grid Utilizando Algoritmos Genéticos”, 13ª Conferência sobre Redes de Computadores (CRC'13), pp. 13-18. Portugal, 14-15 Nov. 2013. [15] E. Argente, J. Palanca, G. Aranda, V. Julian, V. Botti, A. GarciaFornes,
and A. Espinosa, “Supporting agent organizations,” in MultiAgent Systems and Applications V. Springer, 2007, pp. 236–245.
[16] M. E. Gregori, J. P. C ´ amara, and G. A. Bada, “A jabber-based multiagent system platform,” in Proceedings of the fifth international joint onference on Autonomous agents and multiagent systems. ACM, 2006, pp. 1282–1284.