__________________________________________________________________________________________ 34
Management Control Review, v. 5, n. 1, Jan/Jun, pp. 34-46, 2020. ISSN 2526-1282.
BALANCED SCORECARD (BSC) "CAUSE-AND-EFFECT" ANALYSIS: A CASE STUDY IN A FUEL DISTRIBUTOR COMPANY
Recebido em: 11/05/2020 Aprovado em: 09/06/2020 Ayane Maria Gonçalves da Silva
Universidade Federal de Pernambuco Brasil
ORCID: 0000-0002-3226-8904 E-mail [email protected]
ABSTRACT
The main objective of this work is to verify whether there is a cause-and-effect relationship, evidenced in the literature, among the variables belonging to the Balanced Scorecard (BSC) applied in a fuel distributor company. The importance of this research is that the alignment of these relationships is considered one of the main conditions for achieving the organization's mission. Therefore, in order to achieve this objective, Pearson's correlation was used to verify the correlations between the variables studied and the regression technique was used in order to verify the link of causality between the perspectives adopted in the BSC, in the exercise of 2016 to 2017, through statistical inferences. Statistically, there was a weak or moderate cause-and-effect relationship between the BSC's strategic objectives in the period studied, and it may be listed as reasons that would justify this fragile relationship, as was also evidenced in studies by Barros and Wanderley (2016) , the lack of customization of the BSC at the moment of its implementation, the difficulty of the board to disassociate from the financial information present in the financial statements for the decision making and the own corporate structure of the investigated company, which is backed by the family management model.
Keywords: Balanced Scorecard. Cause-and-effect Relationship. Statistical Analysis.
__________________________________________________________________________________________ 35
Management Control Review, v. 5, n. 1, Jan/Jun, pp. 34-46, 2020. ISSN 2526-1282. 1 INTRODUCTION
The dissatisfaction of the traditional measurement practices, according to (Richartz, Krüger, Borger & Petri, 2012), evidenced in the literature in the 1980s, coupled with the need to monitor the business and consequently of its strategy, according to Oliveira, Perez Jr and Silva (2015), led to the emergence of the Balanced Scorecard (BSC) model. This measurement model was created by Kaplan and Norton in the 1990s through a one-year research project that was applied to 12 companies.
The BSC is composed of four perspectives, namely: financial, customer, internal processes and learning/growth. A good BSC, according to its idealizers, consists of a combination of the results and the factors driving performance. Also according to Kaplan and Norton, by providing management information from four different perspectives, the BSC reduces information overload, thus limiting the number of used measures (Kaplan & Norton, 1992).
As a dynamic measurement model, there must be a cause-and-effect relationship between the indicators that compose the BSC perspectives, so that the performance achieved by an indicator in a given period influences the other indicators that make up the four perspectives of this measurement model. (Patzlaff & Patzlaff, 2015). However, it may be possible that practical difficulties in establishing the limited number of performance metrics which the literature suggests leads to expected performance (Callado & Jack, 2018), as well as a balanced approach between financial and non-financial metrics (Callado & Jack, 2016) and the definition of the ideal number of performance indicators to be considered (Callado, 2016).
The use of both financial and non-financial performance indicators might be related to both managerial focus and size of specific companies (Callado, Callado & Almeida, 2009; Sá & Amorim, 2018). Montenegro and Callado (2018) point out that the literature presents several contributions from the plurality of studies regarding BSC. Future research still is needed ir order to provide further understanding about specific issues related to BSC (Cajaiba & Dias, 2019).
According to Kardec, Flores and Seixas (2002), the BSC assumes that the choice of indicators is related to the different perspectives within the organization, so that the performance of one index impacts the results of the others. Therefore, the cause-and-effect relationship between the perspectives is one of the advantages of the BSC. This relationship can be demonstrated through the strategic map. Therefore, the vectors that indicate cause-and-effect relations show how much the performance achieved in a strategic objective can boost the objective of the adjacent perspectives, in a chain relationship (Serra, Gasparetto, Torres, Cupertino, Souza & Nascimento, 2006).
Given the above, this article aims to verify whether there is, in fact, the cause-and-effect relationship, as evidenced in the literature, among the variables belonging to the BSC. To this end, a case study was applied to a fuel distributor (liquids, solids and gaseous), known for confidentiality reasons, as Companhia Petrolífera, whose area of operation comprises the North and Northeast regions of Brazil, using, as statistical technique, the Pearson Correlation and Regression.
In this context, the relevance of the theme, according to Dias, Souza, Souza, Reina and Ensslin (2008), is justified by the fact that the analysis of the cause-and-effect relationship can be used as an aid to the manager to understand the dynamics resulting from the influences originating from the strategic decisions in the strategic map, besides being, according to these authors, an absence of scientific work to study the cause-and-effect relationship between the BSC indicators.
__________________________________________________________________________________________ 36
Management Control Review, v. 5, n. 1, Jan/Jun, pp. 34-46, 2020. ISSN 2526-1282.
It is worth mentioning that this company was already studied in the paper by Barros and Wanderley (2016) when implementing the BSC in order to analyze and explain its adaptation from the theoretical model of Ansari, Fiss and Zajac (2010). Therefore, based on the data obtained in this research, it is possible to observe the BSC, in the Petroleum Company, also under the prism of its execution and verify new positions regarding this important performance measurement tool.
2 LITERATURE REVIEW
The BSC was created with the purpose of solving problems related to performance measurement, previously linked only to financial indicators. According to Kaplan and Norton (1992), managers needed a balanced presentation of financial and operational (non-financial) measures, thus emerging the need to create a "balanced" system of measurement.
The BSC, in this context, has in its structure the translation of mission, vision and strategy into objectives and measures, in a "balanced" way organized through indicators. It is understood as a mission, according to Tachizawa and Rezende (2002), the reason of being of an organization, both in its internal and external relations. The vision, according to these authors, can be defined as:
a dream mix, utopia and desires of a person or group that has to be socialized to serve as a master line for the group of participants and to be the point of convergence of the energy of all elements of the organization (Tachizawa & Rezende , 2002, pp. 39-40).
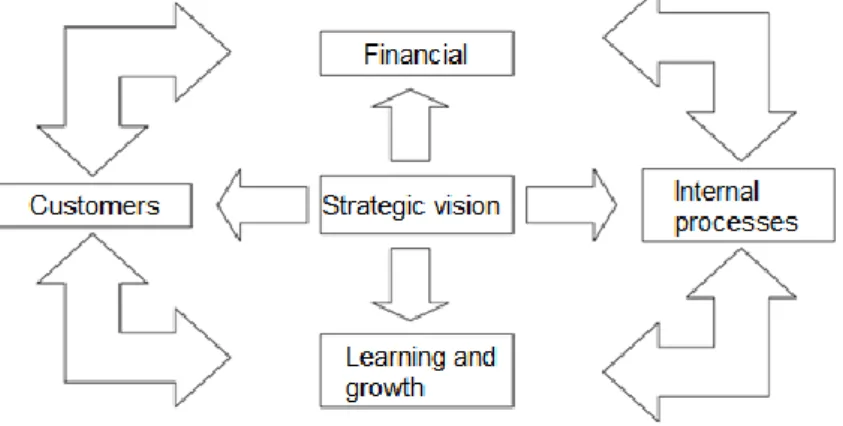
The BSC, according to its idealizers, proposed to group the performance indicators into four distinct perspectives, namely: financial, customers, internal processes and learning / growth. According to Kaplan and Norton (1992), the BSC provides answers to four basic questions: (1) How do customers see us? (Customer perspective); (2) What should we stand out in? (Internal perspective); (3) Can we continue to improve and create value? (learning / growth perspective); and (4) How do we look at shareholders? (financial perspective).
According to Croce Filho and Costa (2009, p.6), "these four perspectives allow the balance of all stakeholders, as some of these indicators look to the present, while others look to the future." In this context, "the main objective of the BSC is the alignment of strategic planning with the actions that will reach the strategic objectives" (Grave & Salles, 2007, p.9).
In Figure 1, the four perspectives of BSC are graphically explained, according to Kaplan and Norton (1997):
Figure 1. The four perspectives of the BSC
__________________________________________________________________________________________ 37
Management Control Review, v. 5, n. 1, Jan/Jun, pp. 34-46, 2020. ISSN 2526-1282.
From a financial point of view, there is evidence of tangible organizational results and it is verified that the company's strategy is contributing to its financial health and the achievement of its financial objectives. For Kaplan and Norton (2000), in this perspective there is evidence of the strategy of growth, profitability and risk of the business, from the perspective of the shareholder.
From a client perspective, the focus is on the analysis of key customer factors. Therefore, "BSC requires managers to translate their overall customer service mission statement into specific measures that reflect the factors that really matter to customers" (Kaplan & Norton, 1992, p. 5). According to Borgert (1999), some of these factors are: time, quality, performance and service. Therefore, its conception is the measurement of the strategy of creating value and differentiation from the perspective of the client.
Internal processes are related to the internal processes that contribute both to the reach of the clients perspective, as well as to the reach of the financial perspective. Being, according to Kaplan and Norton (2000), highlighted, in this perspective, the strategic priorities of various internal business processes that create satisfaction for customers and shareholders.
In the learning and growth perspective, the emphasis is on the entity's ability to innovate, improve, learn continuously, excel, and, according to Wernke and Bornia (2001), relate to maximizing company value. According to Borget (1999), the infrastructure needed to achieve the objectives addressed in this perspective comes from three basic sources: people, systems and organizational procedures.
According to Greve and Salles (2007, p.10), the four BSC perspectives relate with each other in a cause-and-effect relationship and can be evidenced through a strategic map. For these authors:
strategy execution requires strategic programs to be actively managed and supported by a strategic map that provides a complete description of how business value is created in relation to the four perspectives.
In this sense, it is possible to define the strategic map as one of the instruments used for the detailing of the strategy, being composed of a set of assertions created from an abstract vision in which the causal relationships between the results achieved by the organization in its strategic objectives are evidenced.
The indicators, in the strategic maps, are the cause-and-effect vectors in the BSC perspectives. According to Walton (1989, p 104), "effect is a desirable or undesirable situation, condition, or event brought about by a system of causes." Therefore, the existence of cause and effect among certain elements is similarly understood as a causal relation.
According to the logic of Simons (2000), if a manager can not understand the cause-and-effect relationship between a process and the results that are sought to achieve effectively, what would be, for the manager, the utility of a measurement system performance? In the model proposed by Kaplan and Norton, the causal relationship is evidenced in this order: learning and growth measures, which impact on internal process measures, falling on measures from the perspective of clients and ending with financial measures.
According to Johanson, Skoog, Backlund and Almqvist (2006) strategies need to be translated into congruent goals at each level of the organization. If this is done and if a cause-and-effect analysis is performed, it is theoretically easier to direct the organizational nuances in the market. According to Silva (2014, p.27):
every indicator selected for a BSC should be part of a chain of cause and effect relationships that ends in objectives that represent strategic aspects to the
__________________________________________________________________________________________ 38
Management Control Review, v. 5, n. 1, Jan/Jun, pp. 34-46, 2020. ISSN 2526-1282.
business unit. Thus, each measure that is improved will also impact the performance of another measure, forming links between them.
For Chenhall (2005), this system of measures aims to identify cause-and-effect links that describe how operations are related to the organization's strategy. In view of the above, the cause-and-effect relationship, evidenced by Kaplan and Norton (1997) and adapted by Silva (2014), is shown in figure 2.
Figure 2. Cause-and-effect relationship between BSC perspectives Source: Kaplan and Norton (1997) apud Silva (2014).
Under this analysis, and based on this causal relationship, improvement in the learning and growth perspective, such as employee empowerment, would result in improved service delivery, improving the perspective of internal processes, which would make clients more satisfied and would increase the profitability of the operation, impacting, respectively, from the customers and financial perspectives.
In the literature, however, it is possible to find some criticisms of this causal relationship proposed by Kaplan and Norton. Norreklit (2003), for example, argues that the BSC is the most popular framework for designing a measurement system, but it lays some structural flaws in its design. Within these shortcomings, according to this author, there is the absence of empirical evidence that ratifies the existence of the cause-and-effect relationship, since such relationships are only suggested on a logical basis.
Other authors argue that this cause-and-effect relationship would not be characterized as deterministic, as argued by Kaplan and Norton (and therefore would not be causal), but rather probabilistic, thus lacking the proposed cause-and-effect relationship. In this context, according to Pace and Basso (2001), a causal relationship must constitute an asymmetrical relationship. The relationship proposed by Kaplan and Norton is a symmetrical relation. Still according to these authors, among the requirements to have an asymmetric relationship, one has: the cause precedes the effect; control and predictability. Therefore, these authors conclude that the relation proposed by Kaplan and Norton is of purpose (where an action is the way to an end, and the end causes action) and not causal.
3 METHODOLOGY
This research is characterized as descriptive, that, according to Gil (2002, p. 42) "have as their primary objective the description of the characteristics of a given population or
__________________________________________________________________________________________ 39
Management Control Review, v. 5, n. 1, Jan/Jun, pp. 34-46, 2020. ISSN 2526-1282.
phenomenon or else the establishment of relationships between variables," and a quantitative approach, being permitted, by this approach, "the measurement of opinions, reactions, habits and attitudes in a universe through a sample that represents statistically" (Terence & Son, 2006, p. 3).
The object of study was a limited company (LTDA) fuel distributor (solid, liquid and gaseous), referred to in this study as Companhia Petrolífera. Data were collected through document analysis, such as access to the strategic map, the BSC structure, mission / vision and values of the organization, in addition, the screens Bunisses Intelligence (BI), which in this case is used ClikView BI, containing the percentage of reach of the strategic objectives with the stipulated goals, belonging to the four perspectives of the BSC (Financial, Client / Market, Processes and People), from January to September of 2016 and January to September of 2017.
Data analysis aimed to verify whether, or not, the cause-and-effect relationship between the BSC perspectives of the Companhia Petrolífera. For this purpose, the Pearson correlation test was used, with the statistical software Gretl version 3, and the statistical technique called Regression Analysis. According to Moore (2007, p.100 / 101), Pearson's Correlation "measures the direction and degree of the linear relationship between two quantitative variables." And, according to Barbetta (2007: 267), "regression analysis is usually done under a theoretical framework that justifies the adoption of some mathematical causality relation."
Companhia Petrolífera has more than 20 years of experience in the market and operates in the North and Northeast regions of Brazil. It has more than 190 dealerships serving more than 190 cities in the fuel segment. Companhia Petrolífera currently has three storage bases located in Suape / PE, Cabedelo / PB and Guamaré / RN and has been chosen among the 150 best companies to work in Brazil (Revistas Você S / A and Exame) and among the 5 best companies of the state of Pernambuco (Great Place to Work Institute - GPTW Award) for 6 consecutive years.
In 2015, 10% of the fuel sold in Suape came from Companhia Petrolífera and the state of Pernambuco represents 10% of the national fuel consumption. Among the determining factors for the choice of the case study company has: (a) the use of the BSC as a performance measurement system, (b) significant market share, (c) the presence in the company of a structured and active controllership sector, and (d) the accessibility of the researcher to obtain the desired data.
__________________________________________________________________________________________ 40
Management Control Review, v. 5, n. 1, Jan/Jun, pp. 34-46, 2020. ISSN 2526-1282.
Figure 3. Strategic Map of Companhia Petrolífera Source: Strategic map provided by Companhia Petrolífera
The mission of Companhia Petrolífera is to distribute fuels in an efficient manner, meeting the clients' needs and maximizing shareholder returns. Based on its mission and based on its strategic map composed of 16 elements among strategic objectives and critical success factors, it was possible to verify the cause-and-effect between the four perspectives adopted by the company: Finance, Customers / Market, Processes and People. Figure 3 shows the details of the strategic map, as well as the perspectives adopted by Companhia Petrolífera and the proposed cause-and-effect relationships.
It is clear, based on Figure 3 - Oil Company's Strategy Map, that in the four perspectives adopted, there is a total of 16 strategic objectives detailed below:
Financial: Maximize shareholder return (MRA); Working Capital Efficiency (SECG) and Optimization of Expenditure (DO);
Customer / Market: Increase Sales (AV), Increase Networks (AR), Increase Customer Satisfaction (ASC), Renewal of New Contracts (RNC) and Customer Complaint (RC); Processes: Increase process productivity (APP); Loss Reduction (RP), Standardization
of processes (PP) and Be efficient in logistics (SEL);
People: Increase employee satisfaction (ASCo), Personal Capacity (CP), talent development (DT) and Attract, Identify and retain talent (AIRT).
Therefore, based on the strategic map, it was verified the relations of dependence and independence of the variables that compose it, as shown in Table 1- Variables of BSC of Companhia Petrolífera.
__________________________________________________________________________________________ 41
Management Control Review, v. 5, n. 1, Jan/Jun, pp. 34-46, 2020. ISSN 2526-1282.
Table 1. Variables BSC of Companhia Petrolífera
Variables Type of Variable Related Variables Type of Variable
MRA Dependent OD Independent
SECG Independent
AV Dependent RNC Independent
AR Dependent RNC Independent
ASC Dependent RC Independent
APP Dependent RP Independent
PP Independent
SEL Dependent RP Independent
PP Independent
ASCo Dependent CP Independent
DT Independent
AIRT Dependent CP Independent
DT Independent
Source: Prepared by the authors 4 ANALYSIS OF RESULTS
Statistical inferences were used as a means to reach the objective proposed in the study that is to verify the existence or not of the cause-and-effect relationship between the BSC perspectives pointed out in the literature. Data were collected from January to September 2016 and from January to September 2017, based on the strategic map and the variables that compose it, whether dependent or independent.
To verify the correlation between these variables, the Pearson Correlation test was used, applied on the percentage of reach of the indicators of each perspective of the BSC. It is shown in Figure 4 - Correlation matrix, the evidence of these correlations applied to the strategic objectives present in the BSC studied. It is worth mentioning that in the correlation matrix the values were rounded to one decimal place.
Figure 4. Correlation matrix Source: Research Data
__________________________________________________________________________________________ 42
Management Control Review, v. 5, n. 1, Jan/Jun, pp. 34-46, 2020. ISSN 2526-1282.
In order to interpret the coefficients found in this correlation, the guidelines proposed by Bisquerra, Sarriera and Martinez (2014, p.147) were used, as shown in Table 2 - Interpretation of Correlations.
Table 2. Interpretation of Correlations
Coeficient Interpretation r=1 Perfect correlation 0,8 < r < 1 Very high 0,6 < r < 0,8 High 0,4 < r < 0,6 Moderate 0,20 < r < 0,40 Low 0 < r < 0,2 Very low r= 0 Null
OBS: For the negative coefficients the interpretation is identical.
Source: Bisquerra et al. (2004, p. 147)
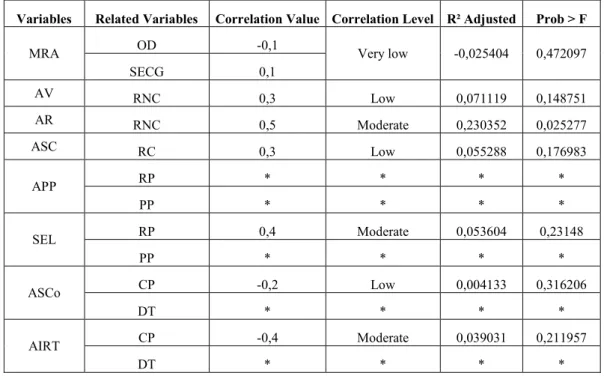
By consolidating the information in Figure 4 with those provided in Table 2, it is verified that the values of the correlations closer to 1, the higher their level of correlation. Therefore, for the purposes of this study, the correlations related to the strategic objectives included in the BSC model of the company studied were analyzed. After verifying these correlations, it was sought to identify their correlation level within the proposed BSC model, between dependent and independent variables, as well as their adjusted R² and Prob (F). These data were summarized in Table 3 - Summary of the statistical analysis of the strategic objectives of BSC of Companhia Petrolífera.
Table 3. Summary of the statistical analysis of the strategic objectives of the BSC
Variables Related Variables Correlation Value Correlation Level R² Adjusted Prob > F
MRA OD -0,1 Very low -0,025404 0,472097
SECG 0,1 AV RNC 0,3 Low 0,071119 0,148751 AR RNC 0,5 Moderate 0,230352 0,025277 ASC RC 0,3 Low 0,055288 0,176983 APP RP * * * * PP * * * * SEL RP 0,4 Moderate 0,053604 0,23148 PP * * * * ASCo CP -0,2 Low 0,004133 0,316206 DT * * * * AIRT CP -0,4 Moderate 0,039031 0,211957 DT * * * *
* Variable without movement in the studied period.
__________________________________________________________________________________________ 43
Management Control Review, v. 5, n. 1, Jan/Jun, pp. 34-46, 2020. ISSN 2526-1282.
In the analysis of the results, it was noticed that some variables, such as AAP (Process productivity increase) and PP (Standardization of processes), both from the perspective of BSC processes, as well as DT (talent development) from People perspective, did not move during the analyzed period, making their analysis impossible in this study.
Pearson's correlation test showed that the correlations were mostly low (0.20 <r <0.40) or moderate (0.4 <r < <0.6). Therefore, the relation of cause and effect present in the BSC studied, for the period of analysis, from the point of view of statistical analysis, is a weak or moderate causal relationship.
As for the adjusted R² coefficient, according to Downing (1998), it measures the percentage of the variation of the dependent variable. Therefore, the closer to one, the greater its explanatory power is to the regression model analyzed. However, it can be seen that the adjusted R² of the BSC variables studied are relatively low, having the highest value in the variable "Increase networks (AR)" with the variable "Renewal of new contracts (RNC)" within the prospects / Market of the Companhia Petrolífera.
In this regard, the statistical technique could be used with a tool when preparing the BSC in order to verify possible correlations among the variables that compose it. Corroborating this idea, Dias et al. (2008, p.14), proposed to verify the importance of cause and effect relationships between the performance indicators used to measure the achievement of the strategic objectives implemented by the BSC, and argue that:
The use of statistical techniques as an aid to the construction of performance indicators can strengthen the significance of their outcome, due to the fact they will be expressing a more faithful causal relationship, avoiding to the maximum the bias of a personal judgment of the managers and / or designers.
However, if we analyze the implementation of BSC in Companhia Petrolífera, according to the study by Barros and Wanderley (2016, p.12), we realize that "the BSC was copied from the literature, but in reality it does not work as a strategy monitoring system, but rather as a set of isolated metrics related to a performance measurement system. "
The lack of customization of the model can be seen as one of the reasons to justify the weak or moderate cause-and-effect relationship present in its strategic objectives pointed out in this study. According to Qu, Cooper and Ezzamel (2010) one of the reasons that lead the BSC to be successful in the practical environment is the possibility of users adapting it according to their needs. Therefore, as there was no such customization in the model studied, this could also be a factor that would justify the weak or moderate cause-and-effect relationship between its perspectives.
In addition, Barros and Wanderley (2016) also verified, at the time of the implementation of the BSC at Companhia Petrolífera, that there was some resistance from some directors regarding its adoption and use. It was seen that the organizational culture was still very focused on analyzing results from the economic-financial reports. Therefore, "the change of focus to accounting based on managerial information has caused some discredit in some members of the board, who resist using the information extracted from the BSC" (Barros and Wanderer, 2016, p.12).
In addition to the foregoing, since this is a company based on the family management model, this factor can also be considered as a justification for the weak or moderate relation of the BSC perspectives evidenced in this study, since such corporate constitution compromises the adoption of a more technical and more formal management.
__________________________________________________________________________________________ 44
Management Control Review, v. 5, n. 1, Jan/Jun, pp. 34-46, 2020. ISSN 2526-1282. 5 CONCLUSION
This research aimed to verify if there is, in fact, the cause-and-effect relationship, evidenced in the literature, among the variables belonging to BSC. In order to achieve this objective, a fuel distributor, known as Companhia Petrolífera, was used as the case study. This company was already studied at the time of implementation of the BSC by Barros and Wanderley (2015) and they aimed to analyze / explain the adaptation of the Balanced Scorecard (BSC), based on the theoretical model of Ansari et al. (2010).
The period of observation of this study comprised the months of January to September of 2016 and January to September of 2017, totaling a period of 18 months. The strategic objectives present in the strategic map of the organization studied were made available in percentage terms, regarding the level of achievement of the stipulated monthly goals. It is worth mentioning that one of the limitations of this study is the impossibility of generalizations of the data obtained, since these are restricted to the sample studied.
Regarding the correlation analysis, based on the application of the Pearson's correlation test and the application of the Regression technique, it was observed that the cause-and-effect relationships, present in the model studied, are weak or moderate. It is proposed, as a means to intensify the cause-and-effect relationship between the perspectives, from the statistical point of view, the use of these techniques at the moment of the creation of the model.
It was verified that in the company studied, at the time of the implementation of the BSC by Companhia Petrolífera, there were some problems, which were evidenced in the studies of Barros and Wanderley (2015), which may have culminated in this weak or moderate cause-and-effect relationship present this research, among them there are: the lack of customization of the model according to the needs of the organization, resistance of the organizational culture to dissociate itself from the restricted analysis of financial values present in the financial statements and the company's own corporate formation, based on a family structure compromising more technical and formal management.
In view of the above, it is suggested, for future research, the continuity in other exercises of the statistical analysis proposed in this study, in order to verify if the weak or moderate cause-and-effect relationship evidenced in the studied company persists in the long term and propose, based on statistical inferences, possible changes in the Companhia Petrolífera's strategic map that could intensify the cause-and-effect relationship present in the BSC's perspectives.
REFERENCES
Ansari, S. M.; Fiss, P. C.; Zajac, E. J. (2010). Made to fit: how practices vary as they diffuse. Academy of Management Review, 35(1), 67-92.
Barbetta, P. A. (2007). Estatística aplicada às ciências sociais. 7. ed. Florianópolis: Ed. da UFSC.
Barros, O. J. E.; Wanderley, C.A. (2016). Adaptação do Balanced Scorecard: Estudo de Caso em uma Empresa Distribuidora de Combustível. R. Cont. Fin. – USP, São Paulo, v. 27, n. 72, p. 320-333, set./out./nov./dez.
Bisquerra, R.; Sarriera, J. C.; Martínez, F. (2004). Introdução à estatística: enfoque informático com o pacote estatístico SPSS. Porto Alegre: Artmed.
__________________________________________________________________________________________ 45
Management Control Review, v. 5, n. 1, Jan/Jun, pp. 34-46, 2020. ISSN 2526-1282.
Borgert, A. (1999). Construção de um sistema de gestão de produtos à luz de uma metodologia construtivista multicritério. UFSC: Florianópolis. tese (doutorado).
Callado, A. A. C. (2016). Relações entre o número de indicadores de desempenho utilizados e fatores contingenciais: evidências do contexto de uma cadeia agroalimentar de
suprimentos. Contabilidade Vista & Revista, 27(2).
Callado, A. A. C.; Callado, A. L. C.; Almeida, M. A. (2009). Determinando Padrões de Utilização de Indicadores de Desempenho: Um estudo em micro e pequenas empresas da Cidade de João Pessoas. Contabilidade, Gestão e Governança, 11(1-2).
Callado, A. A. C; Jack, L. (2017) Balanced scorecard metrics and specific supply chain roles, International Journal of Productivity and Performance Management, 64(2).
Callado, A. A. C; Jack, L. (2017) Relations between usage patterns of performance indicators and the role of individual firms in fresh fruit agri-food supply chains, Journal of Applied Accounting Research, 18(3).
Cajaiba, K. da S.; Dias, C.A. (2019). Controladoria: perfil bibliométrico da produção científica nacional, entre 2012 e 2016. Custos e @gronegócio on line, 15(1).
Chenhall, R. H. (2005). Integrative strategic performance measurement systems, strategic alignment of manufacturing, learning and strategic outcomes: an exploratory study. Accounting, Organizations and Society 30, 395-422.
Croce Filho, J.; Costa, H.G. (2009). Balanced scorecard (BSC) e seus efeitos positivos e negativos. Revista Eletrônica da Faculdade Metodista Granbery, N° 7.
Dias, J. dos S.; Souza, J. V. de; Souza, M. P. de; Reina, D.; Ensslin, L. Balanced Scorecard: uma análise estatística das relações de causa e efeito. Anais… XV Brazilian Congress of Costs - Curitiba - PR, Brazil, November 12 to 14, 2008.
Greve, J.T; Salles, J.A.A. (2007). A gestão de estratégias com o uso do Balanced Scorecard garante o alcance dos objetivos estratégicos? Revista Gestão Industrial. 3(2).
Gil, A. C. (2002). Como elaborar projetos de pesquisa. 4. ed. São Paulo: Atlas.
Johanson, U ; Skoog, M .; Backlund, A .; Almqvist. (2006). Balancing dilemmas of the balanced scorecard. Accounting, Auditing & Accountability Journal. 19(6).
Kardec, A.; Flores, J.; SEIXAS, E. (2002). Gestão estratégica e indicadores de desempenho. Rio de Janeiro: Qualitymark.
Kaplan, R. S. Norton, D. P. (2000). Organização orientada para estratégia: como as empresas que adotam o Balanced Scorecard prosperam no novo ambiente de negócios. Rio de Janeiro: Campus.
Kaplan, R. S. Norton, D. P. (1997). A estratégia em ação: balanced scorecard. 4 ed. Rio de Janeiro: Campus.
Montenegro, F. R. M. S.; Callado, A. L. C. (2018). Uma análise bibliométrica sobre o Balanced Scorecard no período de 2000 a 2016. Custos e @gronegócio on line. 14(2). Moore, D. S. (2007). The Basic Practice of Statistics. New York, Freeman.
Norreklit, H. (2003). The balanced scorecard: what is the score? A rhetorical analysis of the balanced scorecard, Accounting, Organizations, and Society, 28, 591-619.
__________________________________________________________________________________________ 46
Management Control Review, v. 5, n. 1, Jan/Jun, pp. 34-46, 2020. ISSN 2526-1282.
Oliveira, L.M; Perez JR., J.H; Silva, C.A.S. (2015). Controladoria Estratégica: Texto e Casos Práticos com Solução. 11ª Edição, Editora Atlas.
Pace, E. S. U.; Basso, L. F. C. (2002). Uma Análise Crítica da Direção da Causalidade no BSC. São Paulo. RAE.
Paztlaff, A. C.; Paztlaff, P. M. G. (2015). Análise da relação “causa e efeito” do balanced scorecard: um estudo aplicado no terceiro setor. Revista Faro, 1(21).
Porter, M. E. (2004). Estratégia Competitiva: Técnicas para análises de indústria e da concorrência. São Paulo. Campus.
Qu, S. Q., Cooper, D. J., and Ezzamel, M. (2010). Creating and popularizing a global management accounting idea: the case of the balanced scorecard. Research Executive Summary Series, 6 (13), 1-5.
Richartz, F .; Krüger, L.M; Borgert, A.; Petri, S.M. (2012). Balanced Scorecard as a strategic management tool at a Federal University. Revista GUAL, Florianópolis, v. 5, n. 3, p. 01-22, dez.
Sá, E. G. L.; Amorim, T. N. G. F. (2018). Uso e importância de indicadores de desempenho em empresas atacadistas do ramo alimentício a partir das perspectivas do Balanced Scorecard. Custos e @gronegócio on line. 14(3).
Serra, A. R.; Gasparetto, A. S.; Torres, A. P.; Cupertino, C. M.; Souza, J. V.; Nascimento, V. M. (2006). Balanced Scorecard: analisando as relações de causa e efeito. Anais... SLADE Brasil 2006 & Encontro Luso-Brasileiro de Estratégia, Camboriu, Santa Catarina.
Silva, R.C. (2014). As relações de causa e efeito entre os objetivos das perspectivas do Balanced Scorecard: o caso da empresa brasileira de infraestrutura aeroportuária – INFRAERO. UFPE: Recife. Dissertação (mestrado).
Silva, E.M; Dias, L.M.A. (20110. O Balanced Scorecard como Ferramenta Estratégica para a Tomada de Decisões na Empresa Microboard. Anais... VIII Simpósio de excelência em Gestão e Tecnologia- SEGET, Rezende- RJ.
Simons, R. (2002). Performance Measurement and Control Systens for Implementing Strategy - Text and Cases. New Jersey: Prentice Hall.
Tachizawa, T.; Rezende, W. (2002). Estratégia Empresarial. Tendência e Desafios: Um enfoque na realidade brasileira. São Paulo. Makron Books, p. 39-40.
Terence, A.C.F; Filho, E.E. Abordagem quantitativa, qualitativa e a utilização da pesquisa-ação nos estudos organizacionais. Anais... XXVI ENEGEP - Fortaleza, CE, Brasil, 9 a 11 de Outubro de 2006.
Walton, M. (1989). O Método Deming de Administração. Rio de Janeiro: Marques Saraiva. Wernke, R; Bornia, A.C. (2001). Balanced scorecard: considerações e comentários. Anais...