Jury Members:
President: Doctor Ana Lúcia Monteiro Durão Leitão Examiners: Doctor Fernando José Cebola Lidon
Doctor Ana Cristina Martins Ramos
Supervisor:
Doctor Fernando José Cebola Lidon Professor, FCT/UNL
Co-supervisor:
Doctor Ismail Cakmak
Professor, FENS – Sabancy University
Graduate in Biochemistry
Catarina de Vasconcelos Pereira
Study of Salt Stress Tolerance in Spelt
Thesis submitted for the Degree of Master in Food Technology and Safety
iii
Study of Salt Stress Tolerance in Spelt
(
Triticum aestivum var. Spelta
)
Copyright © Catarina de Vasconcelos Pereira, FCT/UNL
The Faculty of Sciences and Technology and the New University of Lisbon have the right,
perpetual and without geographic boundaries, to file and publish this dissertation through
printed copies in paper or in digital format, or by any other known means or yet to be
invented, and to disclose it through scientific repositories and to allow its copy and distribution
with educational purposes or for investigation, non-commercial, provided credit is given to the
author and editor.
Estudo da Tolerância da Espelta sob Stress Salino
(
Triticum aestivum var. Spelta
)
Direitos de cópia © Catarina de Vasconcelos Pereira, FCT/UNL
A Faculdade de Ciências e Tecnologia e a Universidade Nova de Lisboa têm o direito, perpétuo
e sem limites geográficos, de arquivar e publicar esta dissertação através de exemplares
impressos reproduzidos em papel ou de forma digital, ou por qualquer outro meio conhecido
ou que venha a ser inventado, e de a divulgar através de repositórios científicos e de admitir a
sua cópia e distribuição com objectivos educacionais ou de investigação, não comerciais,
desde que seja dado crédito ao autor e editor.
The Author:
Catarina de Vasconcelos Pereira
A Autora:
v
Acknowledgements
Nestes meus quase 11 meses na Universidade de Sabancı tive o prazer de trabalhar e aprender
num ambiente sem igual. Por tudo o que vivi nos últimos 318 dias quero agradecer a todas as
pessoas que o possibilitaram.
Ao Professor Fernando Lidon em primeiro lugar, que sem ele não seria possível, pela
oportunidade, orientação e disponibilidade.
Ao Professor Ismail Çakmak, pelo seu acolhimento e oportunidade, conhecimentos
transmitidos e orientação.
A todas as pessoas do laboratório, á Özge, à Sinem, ao Hussein. Um obrigado muito especial ao
Yusuf, ao Atilla e à Yasemin que tanto se dedicaram e me ajudaram.
E porque na base de tudo está a minha família, quero agradecer, toda paciência, apoio e amor
que me foi dado, não só agora mas sempre.
Um Obrigado muito especial para o meu João por estar sempre comigo nesta viagem por
vii
Abstract
World population is increasing at an alarming rate while food productivity is decreasing due to
the effect of various abiotic stresses. Soil salinity is one of the most important abiotic stress
and a limiting factor for worldwide plant production. In addition to its important effects on
yield, salt stress affects numerous cellular activities, including cell wall composition,
photosynthesis, protein synthesis, ions and organic solutes. Up to 20% of the irrigated arable
land in arid and semiarid regions is already salt affected and is still expanding. Improving salt
tolerant varieties is of major importance, and efforts should be focused on finding adaptive
mechanisms which are involved in salinity tolerance. In this study, several spelt wheat
(Triticum aestivum var. Spelta) genotypes and one cultivar of modern bread wheat were used to screen them for salt tolerance. Spelt is an old-European cereal crop currently attracting
renewed interest as a food grain because it is said to be harder than wheat and requires less
fertilizer. Spelt wheat is also becoming very attractive genetic source by plant breeders due to
its wide adaptation ability to various stressful conditions such as soil salinity. In this study
morphological parameters (e.g., leaf appearance; shoot elongation), dry matter production,
mineral nutrients (especially Na and K), and activity of antioxidative enzymes were measured
to select superior genotypes of spelt for salt tolerance. The results showed that Spelt genotype
Sp41 is a salt sensitive genotype and genotypes Sp69, Sp96 and Sp912 are good candidates for
salt tolerant genotypes.
ix
Resumo
A população mundial está a crescer a um ritmo elevado, e por outro lado, a produtividade de
alimentos está a baixar devido ao efeito de vários stresses abióticos. A salinidade dos solos é
um desses stresses que causa mais limitações para a produção agrícola em todo o mundo.
Além dos seus efeitos a nível de rendimento, o stress salino afecta inúmeras actividades
celulares, incluindo a composição da parede celular, a fotossíntese, a síntese de proteínas, iões
e solutos orgânicos. Até 20% da terra arável irrigada em regiões áridas e semi-áridas já foi
afetada pelo sal (e esta percentagem continua a crescer). Melhorar espécies para que estas
sejam tolerantes ao sal é de grande importância, e investigação deve ser feita na procura de
mecanismos adaptativos envolvidos na tolerância à salinidade. Neste trabalho, vários
genótipos de espelta (Triticum aestivum var. Spelta) e um cultivar de trigo moderno foram estudados para encontrar genótipos com tolerância ao sal. A Espelta é um cereal cultivado na
Europa antiga que está actualmente a voltar a atrair interesse como alimento para cultivo, pois
a espelta é dita ser mais resistentes (a factores externos) do que o trigo e exige menos
fertilizantes. Está também a atrair atenções a nível genético para melhoramentos de outros
cultivares, devido à sua grande capacidade de adaptação a várias condições de stresse, como a
salinidade dos solos. Neste estudo, parâmetros morfológicos (por exemplo, aparecimento de
folhas; comprimento das folhas), produção de matéria seca, nutrientes minerais
(principalmente sódio e potássio), e a actividade de enzimas antioxidantes foram medidos para
seleccionar genótipos de Espelta com maior aptidão para a tolerância à salinidade. Os
resultados mostraram que o genótipo Sp41 é um genótipo sensível à salinidade e os genótipos
Sp69, Sp96 e Sp912 são bons candidatos para a tolerância à salinidade.
xi
Table of Contents
Acknowledgements ... v
Abstract ... vii
Resumo ... ix
List of Figures ... xiii
List of Tables ... xv
Abbreviations ... xvii
1. Introduction... 1
1.1. Background ... 1
1.2. The Importance and Origins of Agriculture... 2
1.2.1. Wheat ... 3
1.2.2. Spelt ... 4
1.3. Nowadays Agriculture ... 5
1.4. Plant Nutrition in Adverse Soil Conditions ... 6
1.4.1. Soil Salinity ... 6
1.5. Saline Stress and Plant Response ... 7
1.5.1. Salt Tolerance ... 9
1.5.1.1. Salt Movement Through Plants ... 10
1.5.1.2. Mechanism of Salt Tolerance ... 10
2. Materials and Methods ... 13
2.1. Plant Culture and Treatments ... 13
2.1.1. 1st Experiment ... 13
2.1.2. 2nd Experiment ... 13
2.1.3. 3rd Experiment ... 14
2.2. Determination of Dry Matter Production ... 14
2.3. Determination of Mineral Nutrients ... 14
2.4. Determination of Enzymatic Activity ... 15
3. Results and Discussion ... 17
Conclusions and Future Prospects ... 29
References ... 31
xiii
List of Figures
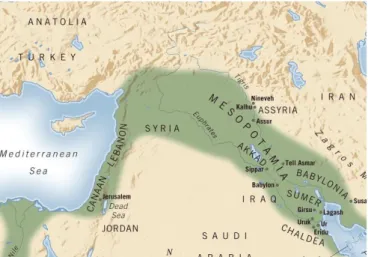
FIG. 1.1- ‘FERTILE CRESCENT,’ IN GREEN (A REGION OF SOUTHWEST ASIA COMPRISING THE VALLEYS OF THE
TIGRIS, EUPHRATES AND JORDAN RIVERS.). FROM SAYRE, 2013. ... 2
FIG. 1.2 - THE EVOLUTION OF WHEAT.[1] ... 3
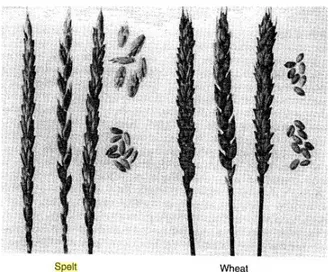
FIG .1.3- DIFFERENCES BETWEEN SPELT AND WHEAT. FROM CAMPBELL, 1997. ... 4
FIG. 1.4 THE EFFECT OF SOIL SALINITY ON THE GROWTH OF WHEAT. ... 5
FIG. 1.5 - EFFECTS OF SALINE SOIL ON PLANTS. ADAPTED FROM EVELIN ET AL., 2009. ... 7
FIG. 1.6 - SALINITY EFFECTS ON RELATIONSHIP BETWEEN PERCENT GERMINATION AND TIME AFTER WATER ADDITION AT LOW, MODERATE AND HIGH SALINITY. FROM OLIVEIRA, ET AL., 2013. ... 8
FIG. 1.7 - GROWTH RESPONSES TO SALT STRESS FROM OLIVEIRA, ET AL., 2013. ... 8
FIG. 1.8 – A SCHEMATIC SUMMARY OF THE STRESSES THAT PLANTS SUFFER UNDER HIGH SALINITY GROWTH CONDITION AND THE CORRESPONDING RESPONSES THAT PLANTS USE IN ORDER TO SURVIVE THESE DETRIMENTAL EFFECTS. FROM HORIE ET AL., 2012. ... 9
FIG. 3.1 - SALT EFFICIENCY FROM FIRST EXPERIMENT. ... 17
FIG. 3.2 - K/NA RATIO FROM ALL GENOTYPES TESTED FROM THE FIRST EXPERIENCE UNDER CONTROL CONDITIONS. ... 18
FIG. 3.3 - K/NA RATIO FROM ALL GENOTYPES TESTED FROM THE FIRST EXPERIENCE UNDER SALT STRESS CONDITIONS. ... 18
FIG. 3.4 - SALT EFFICIENCY FROM SECOND EXPERIMENT. ... 20
FIG. 3.5 - K/NA RATIO FROM ALL GENOTYPES TESTED FROM THE SECOND EXPERIENCE UNDER CONTROL CONDITIONS. ... 20
FIG. 3.6 - K/NA RATIO FROM ALL GENOTYPES TESTED FROM THE SECOND EXPERIENCE UNDER SALT STRESS CONDITIONS. ... 21
FIG. 3.7 - EFFICIENCY VS K/NA FROM THE RESULTS FROM THE FIRST EXPERIMENT FOR SALT STRESS CONDITIONS. ... 22
FIG. 3.8 - EFFICIENCY VS K/NA FROM THE RESULTS FROM THE SECOND EXPERIMENT FOR SALT STRESS CONDITIONS. ... 22
FIG. 3.9 - WORST GENOTYPES IN SALT STRESS CONDITIONS WITH RESPECTIVES CONTROLS. ... 23
FIG. 3.10 - BEST GENOTYPES IN SALT STRESS CONDITIONS WITH RESPECTIVE CONTROLS. ... 23
FIG. 3.11 - WORST GENOTYPES VS BEST GENOTYPES IN SALT STRESS CONDITIONS. ... 24
FIG. 3.12 - SALT EFFICIENCY FROM THIRD EXPERIMENT. ... 24
FIG. 3.13 - K/NA RATIO FROM ALL GENOTYPES TESTED FROM THE THIRD EXPERIENCE UNDER CONTROL CONDITIONS. ... 25
FIG. 3.14 - - K/NA RATIO FROM ALL GENOTYPES TESTED FROM THE THIRD EXPERIENCE UNDER SALT STRESS CONDITIONS ... 25
xv
List of Tables
xvii
Abbreviations
AA Ascorbic Acid
APX Ascorbate Peroxidase
CAT Catalase
EC Dehydroascorbate Reductase
FENS Faculty of Engineering and Natural Sciences
FW Fresh Weight
GR Glutathione Reductase
GSSG Oxidized Glutathione
ICP Inductively coupled plasma
ICP-OES Inductively coupled plasma optical emission spectrometry
NADP+ Nicotinamide Adenine Dinucleotide Phosphate
NADPH Nicotinamide Adenine Dinucleotide Phosphate Oxidase
NBT p-nitro blue tetrazolium chloride
POD Peroxidase
ROS Reactive Oxygen Species
Introduction
1
1.
Introduction
1.1.
Background
In Earth’s ecosystem, humans are consumers and consume primarily plants. In the future, human population will continue to rise (Mahajan and Tuteja, 2005) and also their standard of
living had increased; nowadays they consume more animals and animal products. Such diets
consume more agricultural resources. During the past 10,000 years agricultural production has
become gradually more intense (Chrispels and Sadava, 2003). Also, the growth and
productivity of plants are greatly affected by various environmental stresses (Moud and
Maghsoudi, 2008). The effect of these environmental stresses on crop plants is a topic that is
receiving increasing attention because of the potential impacts of climate change on rainfall
patterns, temperature extremes and salinization of agricultural lands by irrigation and the
overall need to maintain or increase agricultural productivity on marginal lands (Oliveira, et al., 2013). Crop response to stress situations further depends on the intensity and duration of
stress, plant genotype, developmental stage and environmental factors that cause stress
(Aliyev, 2012). Among these, soil salinity is one of the most important abiotic stress and
limiting factor for worldwide plant production (Moud and Maghsoudi, 2008; Xiong et al.,
2002). Nearly 20% of the world’s cultivated area and nearly half of the world’s irrigated lands
are affected by salinity. Processes such as seed germination, seedling growth and vigour,
vegetative growth, flowering and fruit set are adversely affected by high salt concentration,
ultimately causing diminished economic yield as well as the quality of the related products
(Sairam and Tyagi, 2004).
Improving salt tolerant varieties on the other hand, is of major importance, and efforts should
be focused on finding adaptive mechanisms which are involved in salinity tolerance. This may
lead to find gene sources as well as morphological and physiological parameters for screening
large number of genotypes for salt tolerance. Hence, a detailed understanding of the basic
mechanisms involved in the plant salt tolerance is an important prerequisite to improve the
performance of crop plant in saline soils.
In this context the aim of this study was to select superior genotypes of spelt for salt tolerance
Introduction
2
1.2.
The Importance and Origins of Agriculture
Domestication of plants and animals is the major factor underlying human civilization and is a
gigantic evolutionary experiment of adaptation and speciation, generating incipient species
(Peng et al, 2011). All people on earth today are sustained by agriculture and no other species is a farmer. Essentially all of the arable land in the world is under cultivation. Yet agriculture
began just a few thousand years ago, long after the appearance of anatomically modern
humans (Chrispels and Sadava, 2003). The beginning of agriculture around 10 000 years ago
has repeatedly been seen as the major transition in the human past, a changeover from the
natural environment in control of humans, to humans in control of the natural environment.
Before agriculture, humans were hunter-gatherers, dependent on wild resources for their
nutritional requirements, which led to a largely nomadic lifestyle dictated by the annual cycle
of animal and plant availability. The cultivation of plants and the husbandry of animals enabled
humans to exert a measure of control over their food resources, protecting them from climatic
and environmental uncertainty(Brown et al., 2008).
The modern human diet is very different from that of closely related primates and, almost
certainly, early hominids (Gordon 1987). Though there is controversy over what humans ate
before the development of agriculture, the diet certainly did not include cereals in appreciable
quantities. The storage pits and processing tools necessary for significant consumption of
cereals did not appear until the Neolithic (Chrispels and Sadava, 2003).
Agriculture began independently in several parts of the world at about the same time (Brown
et al., 2008). Ample phytogeographical, molecular, archeobotanical, and genetic evidence
points to a small ‘core area’ in
southeastern Turkey and northern Syria
as the cradle of agriculture (Peleg et al., 2011).
It is known that the fourth major centre
of domestication was the ‘Fertile
Crescent,’ a region of southwest Asia comprising the valleys of the Tigris,
Euphrates and Jordan rivers and their
adjacent hilly flanks (Fig. 1.1) (Sayre,
2013; Brown et al., 2008)
Introduction
3
1.2.1.
Wheat
Wheat is a major cereal crop in many parts of the world and it is commonly known as king of
cereals. It belongs to Poaceae family and globally wheat is the second most produced food among the cereal crops (Datta et al., 2009). It is one of the most important grain crops in the world and consists mainly of two types: common wheat and durum wheat. Common or bread
wheat (Triticum aestivum) accounts for some 95% of all the consumed wheat in the world today; the other five percent is durum or hard wheat (Triticum durum), used in macaroni and low-rising bread (Peng et al, 2011).
Wheat is one of the Neolithic founder crops, domesticated alongside other cereals. Today,
wheat is the world’s most important food crop, providing about one-fifth of the calories consumed by man, with approximately 620 million tons in 2006 and 681 million tons in 2011
produced worldwide (Dubcovsky and Dvorak, 2007; Brenchley et al., 2012; Peleg et al., 2011). The consumption of wheat increases each year, it is estimated that global wheat production
between 2010 and 2020 will rise by 40% (Aliyev, 2012).
Bread and durum wheat are both domesticated forms of wild emmer wheat. Bread wheat (T. aestivum) originated from a cross between domesticated emmer wheat (T. dicoccum) and the goat grass (Aegilops tauschii). Wild emmer wheat has the same genome formula as durum wheat and has contributed two genomes to bread wheat, and is central to wheat
domestication (Fig. 1.2) [1] (Peng et al, 2011).
Introduction
4
1.2.2.
Spelt
Spelt (Triticum aestivum var. Spelta) is an old-European cereal crop preceded only by Emmer (T. dicoccum) and Einkorn (T. monococcum) (Campbell, 1997; Neeson, 2011).
For many years, it was believed that bread wheat had evolved from spelt by mutations that
changed the form of the ear. Newer scientific research now suggests that it evolved
independently about 8 500 years ago but from the same two ancestors, Cultivated Emmer and
a Goat Grass (Fig. 1.2) (Marcussen et al., 2014). This created a free-threshing hybrid that differed from Spelt by the ear being roughly square in section, with more grains and a tougher
rachis [1].
In Fig .1.3 it is possible to see the differences between spelt wheat and bread wheat
(Campbell, 1997).
Spelt is currently attracting renewed interest as a food grain in Europe and also in North
America. Although spelt was one of the major feed and food grains of ancient Europe, it is now
considered a minor crop (Campbell, 1997). In the 20th century, spelt was virtually replaced by
wheat, which produces higher yields and is easier to thresh. However, since spelt is said to be
harder than wheat and requires less fertilizer organic farmers made it more popular again
towards the end of the century. It is now mainly grown in Central Europe and Northern
America and has found a new market as a health food, because of its richness in diverse of
nutritional compounds (Neeson et al., 2011). The most common use for spelt is as a substitute for wheat flour in breads, pasta, cookies, crackers, breakfast cereal, cakes, muffins, mixes for
breads, pancakes and waffles, and in animal feedstuffs. Spelt has high protein content and
makes high-quality bread. It can also be used for making beer and for spelt rice.
(Neeson,2011). Spelt wheat is also becoming very attractive genetic source by plant breeders
Introduction
5 due to its wide adaptation ability to various stressful conditions such as soil salinity (Neeson et al., 2011). The main European spelt producing countries are Italy, France, Germany and Spain.
1.3.
Nowadays Agriculture
During the past 10,000 years agricultural production has become gradually more intense
(Chrispels and Sadava, 2003). As the world population continues to grow, the availability of
renewable freshwater resources for agriculture will decrease, and simultaneously the area of
irrigated land will increase in the attempt to satisfy the need for more food (Jaarsma et al., 2013). Irrigation systems are particularly prone to salinization (Munns, 2002), once that when
the plants use the water, the salts are left behind in the soil and eventually begin to
accumulate soils (Oliveira et al., 2013). About half the existing irrigation systems of the world are under the influence of salinization, alkalization or waterlogging(Munns, 2002). The area of
salt affected soils will rapidly expand in the near future (Jaarsma et al., 2013).
Fig. 1.4The effect of soil salinity on the growth of wheat. From Chrispels and Sadava, 2003
Soil salinity is a major constraint to food production because it limits crop yield and restricts
use of land previously uncultivated (Fig. 1.4) (Yokoi et al., 2002).The saline accumulation in the soil it is due to some processes such as: the combined effect of meager rainfall, high
evaporation, the presence of salt-bearing sediments, and in many places, particularly river
valleys and other low-lying areas, the occurrence of shallow, brackish groundwater which gives
rise to saline soils (Oliveira, et al., 2013) and as already mentioned irrigation systems. However, salinization can be managed by changed farm management practices. In irrigated
Introduction
6
employed. In rain-fed agriculture, practices such as rotation of annual crops with deep-rooted
perennial species may restore the balance between rainfall and water use, thus preventing
rising water tables bringing salts to the surface. All such practices will rely on a high degree of
salt tolerance, not only of the perennial species used to lower a saline water table, but also of
the crops to follow, as some salt will remain in the soil (Munns, 2002).
Increased salt tolerance of crops is needed to sustain food production in many regions in the
world. In irrigated agriculture, improved salt tolerance of crops can lessen the leaching
requirement, and so lessen the costs of an irrigation scheme (Munns, 2006).
1.4.
Plant Nutrition in Adverse Soil Conditions
Plant nutrition refers to the need for basic chemical elements for plant growth. Plant growth requires not only carbon dioxide and oxygen from the air but also water and mineral nutrients
from the soil. Soil has been called the "placenta of life," because it supplies essential nutrients
to all land plants, and the plants in turn feed all the terrestrial ecosystems (Chrispels and
Sadava, 2003).
Poor management of natural resources (deforestation and misuse of agricultural land) has led
to extensive soil degradation all over the world. Soil degradation is defined as a decline in soil
quality that impairs the soil`s current or potential capacity to produce crops. It includes
physical, chemical, and biological deterioration. Soils have been and are being degraded by
erosion, salinization, compaction, nutrient losses, pollution, and biological deterioration. Three
quarters of the area degraded by inappropriate agricultural practices, overgrazing, and
deforestation are in the developing world (Chrispels and Sadava, 2003). Near 40% of the
agricultural land has been affected by soil degradation (Cakmak, 2002).
1.4.1.
Soil Salinity
Soil salinity is a prevalent abiotic stress that limits the productivity and geographical
distribution of plants (Radi et al., 2013). The term “salinity” refers to the presence in soil and water of electrolytic mineral solutes in concentrations that are harmful to many agricultural
crops (Oliveira et al., 2013), which means that high concentrations of soluble salt in the soils is a major constraint to crop productivity, especially in the arid and semi-arid areas of the world
Introduction
7 indispensable for cells to maintain growth and vital cellular functions (namely, photosynthesis
and metabolisms) (Horie et al., 2012).
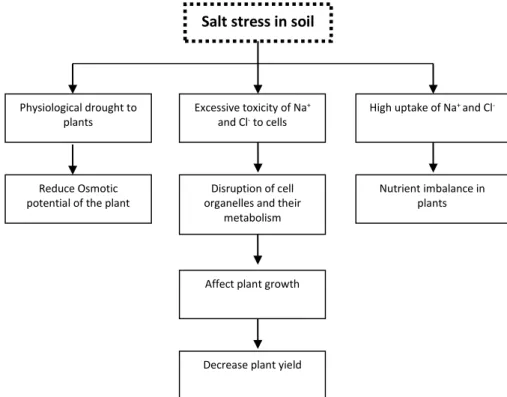
The Fig. 1.5 is showing that deleterious effects of salinity on plant growth are associated with
low osmotic potential of soil solution, nutritional imbalance, specific ion effect, or a
combination of these factors (Evelin et al., 2009).
1.5.
Saline Stress and Plant Response
As already mentioned salt stress is one of the common abiotic stress threats to agriculture and
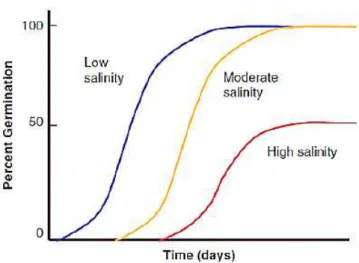
can significantly reduce crop productivity (Wang et al., 2013), once that salt stress reduces water potential and causes ion imbalance or disturbances in ion homeostasis and toxicity. This
altered water status leads to initial growth reduction (Fig. 1.6) and limitation of plant
productivity (Parida et al., 2004). Also, since high salinity causes both hyperionic and hyperosmotic stress (Radi et al., 2013) growth suppression is directly related to total concentration of soluble salts or osmotic potential of soil water (Parida et al., 2004) and can lead to plant demise (Radi et al., 2013). In general salt stress affects numerous cellular activities, including cell wall composition, photosynthesis, protein synthesis, ions and organic
solutes content (Russo et al., 2000; Moud and Maghsoudi, 2008) which results in a reduction in
Physiological drought to plants
Excessive toxicity of Na+
and Cl- to cells
High uptake of Na+ and Cl
-High uptake of Na+ and Cl
-Reduce Osmotic potential of the plant
Disruption of cell organelles and their
metabolism
Nutrient imbalance in plants
Affect plant growth
Affect plant growth
Decrease plant yield
Decrease plant yield
Salt stress in soil
Introduction
8
biomass production, a decrease in shoot length (Fig. 1.7), induction of senescence response or
earlier plant death (Moud and Maghsoudi, 2008; Jaarsma et al., 2013).
Under salt stress, plants have to
cope with stress imposed by the low
external water potential and with
ion toxicity due to accumulation of
ions inside the plants (Tammam et al., 2008). It is necessary to know whether plant´s growth is being
limited by the osmotic effect of the
salt in the soil, or the toxic effect of
the salt within the plant. In the
simplest analysis of the response
of a plant to salinity stress, the reduction in shoot growth occurs in two phases: a rapid
response to the increase in external osmotic pressure, and a slower response due to the
accumulation of Na+ in leaves (ionic stress) (Table 1.1) (Munns, 2008).
Table 1.1 - The effects of salinity stress on plants.
The former stress immediately comes over plants
in accordance with a rise in salt levels outside the
roots, which leads to inhibitions of water uptake,
cell expansion and lateral bud development. The
latter stress phase develops later when toxic ions
such as Na+ accumulate in excess in plants
particularly in leaves over the threshold, which
leads to an increase in leaf mortality with chlorosis
and necrosis, and a decrease in the activity of
essential cellular metabolisms (Horie et al., 2012).
Effect of stress
Osmotic stress
Ionic stress
Speed of onset Rapid Slow
Primary site of visible effect
Decreased new shoot Growth
Increased senescence of older leaves
Fig. 1.6 - Salinity effects on relationship between percent germination and time after water addition at low, moderate and
high salinity. From Oliveira, et al., 2013.
Introduction
9 The plant response to salinity consists of numerous processes that must function in
coordination to alleviate both cellular hyperosmolarity and ion disequilibrium (Yokoi et al., 2002).
The need to develop crops with high salinity tolerance has increased considerably within the
last few decades (Ashraf and O'leary, 1996).
1.5.1.
Salt Tolerance
Salt tolerance is the ability of plants to grow and complete their life cycle on a substrate that
contains high concentrations of soluble salt (Parida et al., 2004). Plants that can survive on high salt medium and grow well are called halophytes but most of the plants are glycophytes
and cannot tolerate salt-stress (Sairam and Tyagi, 2004).Many plants develop biochemical and
molecular mechanisms either to exclude salt from their cells or to tolerate its presence within
the cells. Biochemical strategies include (i) selective accumulation or exclusion of ions, (ii)
control of ion uptake by roots and transport into leaves, (iii) compartmentalization of ions at
the cellular and whole-plant levels, (iv) synthesis of compatible solutes, (v) change in
photosynthetic pathway, (vi) alteration in membrane structure, (vii) induction of antioxidative
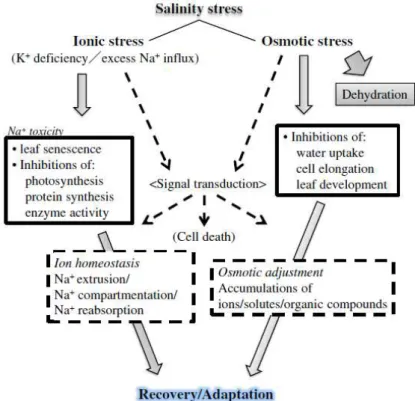
enzymes, and (viii) induction of plant hormones (Parida et al., 2004). In Fig. 1.8 it is represented a schematic summary of the stresses that plants suffer under high salinity growth
condition and the corresponding responses that plants use in order to survive these
detrimental effects.
Introduction
10
1.5.1.1. Salt Movement Through Plants
Dissolved in solution, salt reduces the availability of water to the plant (Lockhart, 2013).
Movement of salt into roots and to shoots is a product of the transpirational flux required to
maintain the water status of the plant. Unregulated, transpiration can result in toxic levels of
ion accumulation in the aerial parts of the plant (Hasewaga, 2000).
In the long distance water transport from roots to shoots, evaporation is one of the main
motive forces for the water movement. Salinity/osmotic stress directly or indirectly via
hormonal regulation induces a stomatal closure, which leads to a reduction in the evaporation
and overall water transport (Horie et al., 2012).
1.5.1.2. Mechanism of Salt Tolerance
The mechanisms of salinity tolerance fall into three categories:
1. Tolerance to osmotic stress. The osmotic stress immediately reduces cell expansion in root tips and young leaves, and causes stomatal closure (Munns, 2008). Under osmotic
stress, an important consideration is to accumulate osmotically active compounds
called osmolytes in order to lower the osmotic potential. These are referred to as
compatible metabolites because they do not apparently interfere with the normal
cellular metabolism (Sairam and Tyagi, 2004).
2. Na+ exclusion from leaf blades. Na+ exclusion by roots ensures that Na+ does not
accumulate to toxic concentrations within leaves. A failure in Na+ exclusion manifests
its toxic effect after days or weeks, depending on the species, and causes premature
death of older leaves (Munns, 2008). Under salt stress, tolerant species may limit Na+
uptake but maintain high foliar K+ levels. High foliar K/Na ratio was suggested as an
indication of salinity tolerance (Alhagdow et al., 1999).
3. Tissue tolerance: In order to avoid Na+ toxicity, the plant cell may either transport the
ions outside the cell or store them inside the vacuole, processes mediated by
specialized proteins. Some of them belong to the family of Na+/H+ exchangers, which
can be located in the plasma membrane or vacuole. Na+/H+ antiporters have been
identified in several mammals, bacteria and plants. These transporters play roles in
pumping out Na+ from the cytoplasm by exchanging it for H+ at the expense of the
Introduction
11 This mechanism allows plant cells to accumulate Na+ in the vacuole and therefore
maintain the appropriate ion concentration in the cytoplasm (Baltierra, 2013) thereby
protecting the cytoplasm from ion toxicity and avoiding buildup in the cell wall which
would cause dehydration. Ion compartmentalization in the vacuole requires
energy-dependent transport which is the cost to the plant of coping with stress (Leksungnoen,
2012).
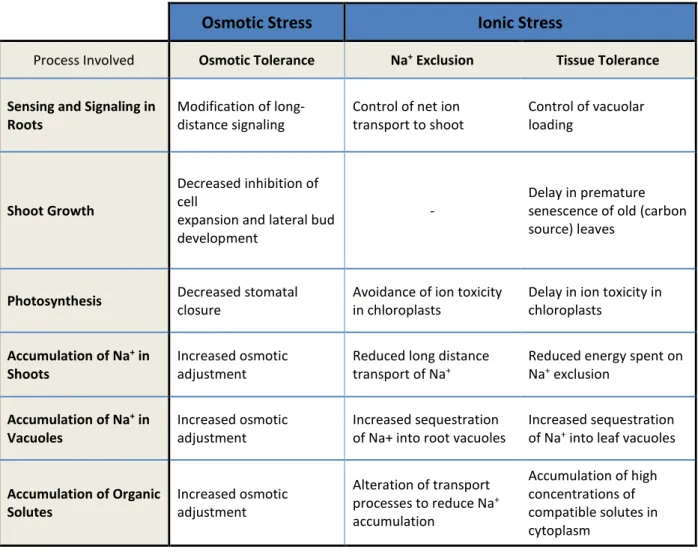
In the following table (Table 1.2) you can see some mechanisms of salinity tolerance, organized
by plant processes and their relevance to the three components of salinity tolerance (Munns,
2008):
Table 1.2 - Mechanisms of salinity tolerance.
Osmotic Stress
Ionic Stress
Process Involved Osmotic Tolerance Na+ Exclusion Tissue Tolerance
Sensing and Signaling in Roots
Modification of long-distance signaling
Control of net ion transport to shoot
Control of vacuolar loading
Shoot Growth
Decreased inhibition of cell
expansion and lateral bud development
-
Delay in premature senescence of old (carbon source) leaves
Photosynthesis Decreased stomatal
closure
Avoidance of ion toxicity in chloroplasts
Delay in ion toxicity in chloroplasts
Accumulation of Na+ in Shoots
Increased osmotic adjustment
Reduced long distance transport of Na+
Reduced energy spent on Na+ exclusion
Accumulation of Na+ in Vacuoles
Increased osmotic adjustment
Increased sequestration of Na+ into root vacuoles
Increased sequestration of Na+ into leaf vacuoles
Accumulation of Organic Solutes
Increased osmotic adjustment
Alteration of transport processes to reduce Na+
accumulation
Accumulation of high concentrations of compatible solutes in cytoplasm
In addition, soil salinity stress causes in-planta accumulation of reactive oxygen species (ROS),
which can result in oxidative stress and cellular damage. (Lockhart, 2013) ROS such as
superoxide radical (O2 -), hydrogen peroxide (H
2O2) and hydroxyl radical (OH) are responsible
for the damage to membranes and other essential macro-molecules such as photosynthetic
Introduction
12
deleterious effects, plants have developed antioxidant enzymes such as superoxide dismutase
(SOD), ascorbate peroxidase (APX), glutathione reductase (GR), catalase (CAT), peroxidase
(POD) and non-enzymatic scavengers like glutathione, ascorbic acid and carotenoids
(Mandhania et al., 2006).
The primary scavenger is SOD, which converts O2 - to H
2O2. This toxic product of SOD reaction
is eliminated by APX in association with dehydroascorbate reductase (EC) and GR, the later
two help in regeneration of ascorbic acid (AA). H2O2 is also scavenged by CAT, though the
enzyme is less efficient than APX/GR system (Sairam and Srivastava, 2002). Glutathione
reductase is important to scavenge and remove these toxic products before cellular damage
occurs because it plays an essential role in the protection of chloroplasts against oxidative
damage by oxidation of essential thiol groups, inactivating these enzymes (Gamble and Burke,
Materials and Methods
13
2.
Materials and Methods
All experiments were conducted in greenhouse of Faculty of Engineering and Natural Sciences
of Sabancı University, Tuzla/Istanbul, Turkey. The soil used was collected from Central Anatolia
region of Turkey. This soil is characterized as highly calcareous and semi-arid, because this area
is the driest region in Turkey, with an annual precipitation of 325 mm (Cakmak et al., 1996). Is also known to have deficiency in lot of nutrients (Bagci et al., 2007; Cakmak, 2008). All experiments had completely randomized and full factorial designs.
2.1.
Plant Culture and Treatments
Three experiments were conducted as described below:
2.1.1.
1
stExperiment
Eight spelt wheat genotypes (Sp2, Sp41, Sp492, Sp563, Sp732, Sp757, Sp804 and Sp912) and
one cultivar of modern bread wheat (cv. Adana99) from the germoplasm bank of Sabancı
University, Tuzla/Istanbul, Turkey, were used in screening studies for salt tolerance. The
reason why cv. Adana99 will be used as reference genotype was because is one of the most
used seeds in Anatolian soil, due to have better growth rates and high yields in this type field
(Mazid et al., 2009). Two different treatments (salt tolerance and the respective control) were applied and each genotype was cultivated in 3 independent pots by using about 10
randomized seeds per pot. Each pot was filled with about 2.2Kg of soil and the soils were
fertilized with 200 ppm of N, 100 ppm of P, 5 ppm of Zn and 5 ppm of Fe by using Ca(NO3)2,
KH2PO4, ZnSO4, and FeEDTA, respectively. To study salt tolerance, 2500 ppm of NaCl was added
to the pots used for salt stress treatment. Then, plants were grown with limited and sufficient
water supply for 30 days, thereafter harvested (e.g., after 50 days of growth under
greenhouse conditions).
2.1.2.
2
ndExperiment
Eight spelt wheat genotypes (Sp53, Sp67, Sp69, Sp92, Sp96, Sp225, Sp382 and Sp801) and one
cultivar of modern wheat (Adana99), used as reference genotype, from the germoplasm bank
of Sabancı University, Tuzla/Istanbul, Turkey, were selected to screen them for salt tolerance.
The experimental procedure used in the first experiment was also used in this experiment with
the following differences: Before sowing, the seeds of all genotypes were vernalized for 3
weeks at 3-40C in order to achieve better germination and seedling growth. Since the 2500
Materials and Methods
14
ppm NaCl was used. Vernalization is the process by which prolonged exposure to cold
temperatures promotes flowering (Amasino, 2004). Optimum vernalization temperatures, with
some exceptions, range from 3-8 °C and the time required for complete vernalization depends
of the specie. The length of vernalization treatment required for complete vernalization is
related to whether a species has an obligate or facultative vernalization requirement. Many
crops of the biennial plants stay vegetative without cold exposure; the cold requirement is
therefore called obligatory. On the other hand, for some species, vernalization has only a
furthering effect on flower induction. The cold requirement for those is called facultative
(Kaymak and Güvenç, 2010).
2.1.3.
3
rdExperiment
The genotypes showing best and lowest performance under salt stress treatments of the 1st
and 2nd experiments were selected and used in this 3rd experiment. These genotypes were as
following: Sp41, Sp67, Sp69, Sp92, Sp96, Sp563, Sp732 and Sp912. The treatments used in this
3rd test were the same of the treatments applied in the 2nd test.
2.2.
Determination of Dry Matter Production
At harvest, only shoot samples were collected, washed in deionized water, placed in paper
bags and storage inside the oven at 50°C during 3 days. Then, each sample was weighed
(Sartorius CP3202S, d=0.01g) to determination of dry matter.
2.3.
Determination of Mineral Nutrients
Whole shoot and root samples were dried at 70 °C. Dried samples were milled to fine powders
in an agate vibrating cup mill (Pulverisette 9; Fritsch GmbH; Germany) during around 1 minute
at 750rpm, digested and sent to ICP analysis for determination of macro (K, Ca, Na, P, S and
Mg) and micronutrients (Zn, Fe, Mn, Cu, B and Al).
To digest, each sample were weighed (0.30g ± 0.10g) and transferred to a digestive tube,
which was filled with 2mL of 30% H2O2 and 5mL of 65% HNO3, and then all samples were acid
digested in a closed-vessel microwave system, (MarsExpress; CEM Corp., Matthews, NC, USA)
After this process, 13mL of double-deionized water were added in each tube (total volume
=20mL) and then all samples were filtered and storage. A blank was added to our set of
samples, and also a reference of Tomato Leaf (NIST 1573a) (0.20g ± 0.00g). Inductively coupled
plasma optical emission spectrometry (ICP-OES; Vista-Pro Axial; Varian Pty Ltd, Mulgrave,
Materials and Methods
15 were checked by using certified standard reference materials obtained from the National
Institute of Standards and Technology (Gaithersburg, MD, USA).
2.4.
Determination of Enzymatic Activity
A sample of approximately 0.5g (Sartorius CP3202S, d=0.01g) of fresh leaves were collected
from each pot and kept at -80 °C. All samples were milled with help of liquid nitrogen and
quartz powder in a porcelain mortar. Then, 5 mL of 50 mM potassium phosphate (K-P) buffer
solution was added to the samples. The K-P buffer was prepared by mixing 50 mM KH2PO4 and
50 mM K2HPO4 and the pH was adjusted to 7.6. Then, 0.1 mM EDTATitriplex-III was added to
this mixture for the homogenization step. The homogenates were then centrifuged at 15000g
for 30 min, and the supernatants were used for protein and enzyme analysis. Protein
concentrations in the crude extracts were measured by using the Bradford assay as described
by Bradford (1976). Superoxide dismutase activity was measured by a slightly modified version
of the photochemical method described by Giannopolitis and Ries (1977). This assay is based
on the inhibition of the photochemical reduction of p-nitro blue tetrazolium chloride (NBT) by
SOD and its spectroscopic measurement at 560 nm. One tube of reaction mixture contains 500
μL 50 mM Na2CO3, 500 μL 12 mM Lmethionine, 500 μL 75 μM NBT and 500 μL 2 μM riboflavin
as well as enzyme extracts (50–150 μL). The total volume was brought up to 5 mL with K-P (pH
7.6) containing 0.1 mM Na-EDTA. The reaction was started by adding the riboflavin to the
mixture and placing the vials under the lights in growth chamber for about 8 min. One unit of
SOD activity is defined as the SOD activity that results in a 50 % decrease in the NBT reduction.
Glutathione reductase activity was determined by recording the oxidation of nicotinamide
adenine dinucleotide phosphate (NADPH) at 340 nm according to Foyer and Halliwell (1976)
with a few modifications. The 1-mL reaction mixture consisted of 100 μL of 0,5 mM oxidized
glutathione (GSSG), 100 μL of 0.12 mM NADPH, 50–150 μL of the enzyme extract and 650–750
μL of 50 mM K-P buffer (pH 7.6) with 0.1 mM Na-EDTA. Results were adjusted for the non-enzymatic oxidation of NADPH by observing the decrease of absorbance at 340 nm in the
absence of GSSG. Ascorbate peroxidase activity was measured according to Nakano and Asada
(1981) by monitoring the decrease in absorbance of ascorbic acid at 290 nm. The 1-ml reaction
mixture contained, 100 μL of 12 mM H2O2, 100 μL of 0.25mM ascorbic acid, 50–150 μL of the
enzyme extract in addition to 650–750 μL of 50mMK-P buffer (pH 7.6) containing 0.1 mM
Na-EDTA. Catalase activity was determined by monitoring the decrease in the absorbance of H2O2
Materials and Methods
16
Results and Discussion
17
3.
Results and Discussion
Germination of spelt cultivars was significantly affected by the salt stress and morphologically
it was quite easy to choose which ones were the best candidates to this stress. For the first
experiment, the best one was Sp912. The worst was Sp804 in salt stress conditions.
Then, the efficiency was calculated by dividing the stress dry matter, by the respective
control's dry matter.
These results are showed in the follow charts (Fig. 3.1):
These results shows that the genotypes Sp732 (55%) and Sp563 (37%), have better efficiency
when compared with the reference genotype. However only these results doesn’t prove that
the previously spelt genotypes hold some traits that confer resistance to salt stress.
Then the mineral content was determined by ICP (for data details see Appendix 1). Nutrient
disturbances under salinity reduce plant growth by affecting the availability, transport, and
partitioning of nutrients but also an increased nutrient supply will not improve plant growth
when the nutrient is already present in sufficient amounts in the soil and when the salt stress
is severe (Hu and Schmidhalter, 2005). It is important analyze what salt causes in terms of
mineral nutrients. In this way, another concern is that the nutrient content of the soil should
be sufficient such that addition of salt does not cause nutrient deficiency by decreasing the
activity of other ions (Verslues et al., 2006). In the first table of Appendix 1 dry matter results, 30
19 16
26
37
55
26 30
18
0 10 20 30 40 50 60
Adana99 Sp2 Sp41 Sp492 Sp563 Sp732 Sp757 Sp804 Sp912
E
ff
ici
e
n
cy
(%
)
Results and Discussion
18
efficiency data and the concentrations of the most important minerals for the study of salt
stress (K+, Ca2+ and Na+) are shown. It is the interplay of these ions, which brings homeostasis
in the cell (Mahajan and Tuteja, 2005). Potassium is an essential factor in protein synthesis,
glycolytic enzymes, and photosynthesis; an osmotic mediating cell expansion and turgor-driven
movements; and a competitor of Na+ under saline conditions. High Na+ concentrations in the
external solution cause a decrease in both K+ and Ca2+ concentrations in the tissues of many
plant species (Hu and Schmidhalter, 2005). So, after determination of mineral content, the
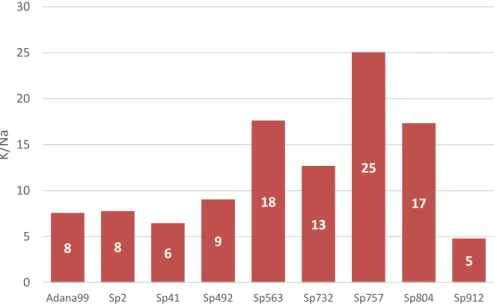
ratio K/Na was calculated (Fig. 3.2; Fig. 3.3). Because under salt stress K/Na ratio is too
different between control and stress condition, charts were drawn separately:
617 681 696 335 443 398 448 604 575 0 100 200 300 400 500 600 700 800
Adana99 Sp2 Sp41 Sp492 Sp563 Sp732 Sp757 Sp804 Sp912
K/Na
8 8 6 9
18 13 25 17 5 0 5 10 15 20 25 30
Adana99 Sp2 Sp41 Sp492 Sp563 Sp732 Sp757 Sp804 Sp912
K/Na
Fig. 3.2 - K/Na ratio from all genotypes tested from the first experience under control conditions.
Results and Discussion
19 The response of the genotypes tested is clearly different when submitted to stress. In control
conditions, the genotype Sp2, Sp41 and Sp912 have a better K/Na ratio than reference
genotype, but when submitted to salt stress these three have the lowest ratio, on the other
hand, the remaining genotypes have higher ratio than reference genotype. This results prove
that most of spelt genotypes used in this experiment have better K/Na ratio and possibly the
genotypes Sp563, Sp732 and Sp804 have better growth efficiency in salt stress conditions.
A high cytosolic K/Na ratio is very important because intracellular K+ and Na+ homeostasis is
important for the activities of many cytosolic enzymes, and for maintaining membrane
potential and an appropriate osmotic for cell volume regulation (Zhu, 2003). The results shows
that Na+ contents increased under saline condition, and this increase results in a decrease of
K/Na ratio in all genotypes studied (Fig. 3.2; Fig. 3.3).
In 2003, Zhu described that Na+ stress disrupts K+ uptake by root cells, and when Na+ enter in
the cells and accumulates to high levels, it becomes toxic to enzymes. To prevent growth
cessation or cell death, excessive Na+ has to be expelled or compartmentalized in the vacuole
(Zhu, 2003). Plant vacuoles constitute 40–90% of the total intracellular volume of a mature
plant cell and, in concert with the cytosol, generate the cell turgor responsible for growth and
plant rigidity (Gaxiola et al., 2001). This compartmentation system not only lowers Na+
concentration in the cytoplasm but also contributes to osmotic adjustment to maintain water
uptake from saline solutions (Zhu, 2003), which means that increased vacuolar solute
accumulation could confer salt tolerance (Gaxiola et al., 2001). Other organelles, such as plastids and mitochondria, may also accumulate some Na+ (Zhu, 2003).
Plants limiting the uptake of toxic ions or maintaining normal nutrient ion contents could show
greater tolerance (Khan, et al., 2009) which is the case of some genotypes already mentioned in the present study.
The capacity to store Na+ in vacuoles can explain why the genotypes Sp563, Sp732 and Sp804
have better salt efficiency than Sp757 even having lower K/Na ratio (Fig. 3.2; Fig. 3.3), because
if the capacity of the plant to store is very high, its metabolic activity is not so affected by Na+
toxicity, however when we milling, all salt inside the vacuoles will be released and mixed in the
sample. However, due to problems of seed germination in this experiment, it is not possible to
state with certainty that the results reflect reality. For this reason in the second experiment all
seeds were vernalized before sowing. Other genotypes were selected for this experiment to
extend our range of genotypes. We also concluded that 2500ppm of salt had a severe effect on
seed germination and on plant's development, then we decided reduce for 2000ppm on the
Results and Discussion
20
In the second experiment, seed germination was successful. Yet a high rate of germination
under salt stress is not well correlated with salinity tolerance at later developmental stages
(Verslues et al., 2006). This time, morphologically, the best two genotypes were Sp92 and Sp96 for salt stress. The worst were Sp53 and Sp801 for salt stress.
As in the first experiment, the efficiency was calculated and it’s shown below (Fig. 3.4):
This time, the genotypes Sp53 (31%), Sp69 (34%), Sp92 (38%), Sp96 (42%), Sp225 (35%), Sp382
(38%) and Sp801 (37%) had better efficiency when compared with the reference genotype for
salt stress.
Again, after determination of mineral content (Appendix 2), the ratio K/Na was calculated and
it is shown on the next two figures (Fig. 3.5 and Fig. 3.6):
30 31
23
34 38
42
35 38 37
0 5 10 15 20 25 30 35 40 45
Adana99 Sp53 Sp67 Sp69 Sp92 Sp96 Sp225 Sp382 Sp801
E ff ici e n cy (% ) 304 627 591 575 575 846 731 630 356 0 100 200 300 400 500 600 700 800 900
Adana99 Sp53 Sp67 Sp69 Sp92 Sp96 Sp225 Sp382 Sp801
K
/Na
Fig. 3.4 - Salt efficiency from second experiment.
Results and Discussion
21 As in the first experiment, a negative correlation in K/Na ratio was observed between the
control and salt stress genotypes studied (Fig. 3.5 and Fig. 3.6). In both control and salt stress
conditions, all genotypes studied have higher K/Na ratio than modern wheat and, excluding
the genotype Sp67, which have lower biomass yield (salt efficiency) than modern wheat, all of
them are probably more resistant to salt stress conditions than modern wheat.
While table 1 and 3 from Appendix 1 and 2, respectively, shows the concentrations of the most
important minerals for this study, table 2 and 4 (from Appendix 1 and 2, respectively) reveals
the concentrations of P, S, Mg and some micronutrients (Zn, Fe, Mn, Cu, B and Al). The
availability of micronutrients in saline soils depends on the solubility of the micronutrients, the
pH and pE of the soil solution, and the nature of the binding sites on the organic and
inorganic-particle surfaces. Thus, salinity can differentially affect the micronutrient concentrations in the
plant, depending upon the crop species and the salinity level (Hu and Schmidhalter, 2005). In
case of spelt the results in terms of micronutrients were different between the first and
second experiment. In the first experiment (table 2, Appendix 1) was verified a significant
increase of almost all micronutrients when under salt stress (except for B), while for the
second experiment (table 4, Appendix 2) this general increase does not occurred. At nutritional
level the results from first experiment were very good, once shows that spelt genotypes had
more capacity for absorb the micronutrients than the reference (Adana99), which showed a
decrease in almost all micronutrients (except for Zn) when compared with control condition. In
second experiment the micronutrients % does not increase from control condition to salt
stress conditions, but does not decrease, was not observed a significant difference between
control and salt stress conditions. These results are also good once that high salt deposition in
5 13 7 10 6 11 7 5 8 0 2 4 6 8 10 12 14
Adana99 Sp53 Sp67 Sp69 Sp92 Sp96 Sp225 Sp382 Sp801
K/Na
Results and Discussion
22
the soil generate a low water potential zone in the soil making it increasingly difficult for the
plant to acquire both water as well as nutrients (Mahajan and Tuteja, 2005).
For better evaluation of our results, the efficiency vs K/Na chart was drawn for first (Fig. 3.7)
and second (Fig. 3.8) experiment:
The previous charts allow a conclusion about which genotypes could come to be more
resistant under salt stress. Using this information we can say that from the first experiment
genotypes Sp563, Sp732 and Sp757 are good candidates for salt stress. From the second
experiment the genotypes Sp69, Sp96 and Sp53 for salt stress are good candidates for these
stresses. Adana99 Sp2 Sp41 Sp492 Sp563 Sp732 SP757 Sp804 Sp912 14 18 22 26 30 34 38 42 46 50 54 58
4 6 8 10 12 14 16 18 20 22 24 26
E ff ici e n cy (% ) K/Na Adana99 Sp53 Sp67 Sp69 Sp92 Sp96 Sp225 Sp382 Sp801 20 25 30 35 40 45
4 5 6 7 8 9 10 11 12 13 14
E ff ici e n cy (% ) K/Na
Fig. 3.7 - Efficiency vs K/Na from the results from the first experiment for salt stress conditions.
Results and Discussion
23 For the third experiment, we select the best and worst genotypes for both salt tolerance from
the previous experiments. The genotypes selected as good for salt tolerance were the Sp69,
Sp92, Sp96, Sp563 and Sp732 and the bad ones were the Sp41, Sp67 and Sp912.
Unfortunately the genotypes Sp53 and Sp757, which were the better candidates as it can be
seen in our results, it could not be selected for this experiment due to the lack of stock of
seeds in our bank of seeds.
In the next two figures (Fig. 3.9; Fig. 3.10) it is possible see the morphological aspect of the two
worst and two best genotypes from the 3rd experiment:
For the worst genotype was chosen the genotype Sp41, and for second worst the genotype
Sp67 as it can be seen in Fig. 3.9.
Fig. 3.10 - Best Genotypes in salt stress conditions with respective controls.
Results and Discussion
24
For the best genotype were chosen two genotypes: Sp96 and Sp912 as it can be seen in Fig.
3.10. In Fig. 3.11 it is possible compare the two best with the two worst genotypes
In the previous figures we can realize that under salt stress the leaves become darker and
thinner when compared with the control, especially for the two worst genotypes (Fig. 3.9). For
the two best genotypes the leaves are still thin compared with control, but the differences in
color are not so notable (Fig. 3.10). In terms of biomass production is clearly that occurred a
significant reduction under salt stress, especially in genotype Sp41 and Sp67.
In relation to efficiency the worst genotype was the genotype Sp41 with 15% of efficiency,
which is according to morphologically analysis. The best genotype is also according with
morphologically analysis – genotype Sp912 with 49% efficiency – as it can be seen in the
following graph (Fig. 3.12).
Fig. 3.11 - Worst Genotypes vs Best Genotypes in salt stress conditions.
26 15
37 33 44 34 34 36
49
0 10 20 30 40 50 60
E
ff
ici
e
n
cy
(%
)
Results and Discussion
25 For those two genotypes (the best and the worst) it is verified a significant difference
comparing with the others. In terms of efficiency the second bad spelt genotype was Sp69 and
the second good one was genotype Sp92, contradicting the morphological analysis results.
The mineral content from third experiment was determined (Appendix 3), and was obtained a
good result at nutritional level once again. After that the ratio K/Na was calculated and it is
shown on the next two figures (Fig. 3.13; Fig. 3.14):
Fig. 3.13 - K/Na ratio from all genotypes tested from the third experience under control conditions.
Fig. 3.14 - - K/Na ratio from all genotypes tested from the third experience under salt stress conditions As was expected the ratio K/Na had a significant decrease when under salt stress conditions,
what already occurred in the previous experiments. The K/Na ratio from genotypes Sp41, Sp92
Sp732 is too low (6). In case of genotype Sp41 this fact was expected and this result reinforces
what was already noticed from efficiency results, morphological results and also from first
experiment (Fig. 3.3) that genotype, Sp41, is a bad genotype in salt stress conditions. In case of
genotype Sp92 the K/Na ratio from third experiment is the same from the second experiment
556 640 747 733 603 730 475 451 606 0 100 200 300 400 500 600 700 800
Adana99 Sp41 Sp67 Sp69 Sp92 Sp96 Sp563 Sp732 Sp912
K /Na 6 5 21 10
7 7 5
4 7 0 5 10 15 20 25
Adana99 Sp41 Sp67 Sp69 Sp92 Sp96 Sp563 Sp732 Sp912
K
Results and Discussion
26
(Fig. 3.6), what confirms that Sp92 does not have a good mechanism of Na+ exclusion from leaf
blades, since his Na+ content in the plant should be very high which causes a high K/Na ratio.
However Sp92 efficiency`s (Fig. 3.12) was the second highest and was also high on second
experiment (Fig. 3.4), which means that his capacity to store Na+ in vacuoles should works very
well, in this way its metabolic activity is not so affected by Na+ toxicity. However when we
milling, all salt inside the vacuoles will be released and mixed in the sample, and the K/Na ratio
obtained is high. For Sp732 genotype third experiment K/Na ratio results are not according
with the previous experiment (Fig. 3.3), so, we can´t conclude anything about this genotype.
This time genotype Sp67 had the highest K/Na ratio what was not expected based on
morphologic results and second experiment results (Fig. 3.6). Zhu et al., (2001) found that plants are able to tolerate moderately saline environments with a greater ability to exclude
Na+ from shoot or at least the leaf blade and concurrently maintain high level of K+. Similarly
the K+ content in shoots is an index of osmotic adjustment. Tammam et al. (2008) records that
high K/Na ratio is more important for many species than simply maintaining a low
concentration of Na+.
For third experiment the chart of Efficiency vs K/Na (Fig. 3.15) was also drawn:
Fig. 3.15 - Efficiency vs K/Na from the results from the first experiment for salt stress conditions
Looking to this chart (Fig. 3.15) is clearly that genotype Sp41 is not a salt tolerant genotype as
already has been showed. Based on this chart the genotype Sp912, Sp69 and Sp67 are the best
candidates for salt tolerant genotypes. Adana99 Sp41 Sp67 Sp69 Sp92 Sp96 Sp563 Sp732 Sp912 10 15 20 25 30 35 40 45 50
2 4 6 8 10 12 14 16 18 20 22 24
Results and Discussion
27 One approach to understanding the ROS-scavenging systems in plant stress tolerance is to
manipulate the levels of antioxidant enzyme activities (Yousuf et al., 2012) , so this time it was determined the enzymatic activity of the plant in genotypes Sp41, Sp67, Sp92, Sp96 and Sp912
(appendix 4). It was calculated the protein concentration, SOD Activity, GR Activity, CAT
Activity and APX Activity. In general protein concentration had a slight increase under salt
stress conditions (except genotype Sp41). It is expected that under salt stress conditions occurs
fragmentation of proteins due to toxic effects of reactive oxygen species which results in a
reduction of protein content and also activity of protease or other catabolic enzymes results in
protein degradation (Mafakheri et al., 2011). Nevertheless Tammam et al. (2008) relates that the increase in soluble protein in shoots might indicate the superiority of shoots over roots to
alleviate the imposed salt stress. As well, Datta et al. (2009) reports an increase in protein content of leaves in the salt concentrations as compared with the control. Also, to fight against
ROS, plants produce various proteins, as enzymes. As we can see in Appendix 4 almost all
production of enzymes increases under salt stress conditions (except production of CAT and
GR for genotypes Sp41 and Sp67). The results show as genotypes Sp92, Sp96 and Sp912 have a
better mechanism to combat reactive oxygen species than genotypes Sp41 and Sp67, once
these genotypes (Sp92, Sp96 and Sp912) can produce more antioxidant enzymes. Minimization
of reactive oxygen species as a result of inhibition of photosynthesis and maximization of their
Conclusions and Future Prospects
29
Conclusions and Future Prospects
Despite the fact that research efforts have produced an enormous amount of information, it is
difficult to asserting with certainty which are the salt sensitive or tolerant genotypes. Only a
few components have been the subject in this study, being obtained some contradictory
results.
This study on effect of salt in several Spelt Wheat genotypes showed that first of all salinity
causes a significant reduction on plant shoot length. High level of salinity may have also inhibit
the root and shoot elongation due to slowing down the water uptake for overall osmotic
adjustments of the plant under high salt stress condition. In this study was found that
genotype Sp41 is a salt sensitive genotype as seen in the data about morphological analyses, as
well as in terms of efficiency and low K/Na ratio. Based on second experiment and on
morphological analysis from third experiment was expected that genotype Sp67 were also a
salt sensitive genotype, however in third experiment this genotype obtained a high K/Na ratio,
and a high K/Na ratio is more important for many species than simply maintaining a low
concentration of Na+, consequently a high K/Na ratio is an indicator of salt tolerance. Based on
this inconsistent result more studies may be focused on this genotype. Also in stress tolerance
the results remains controversial, once that in third experiment the genotype Sp912 has
revealed as a salt tolerant genotype, but the results were different in first experiment. The
genotypes Sp69 and Sp96 are good candidates for salt tolerance, once shows consistent results
in the two experiments. A good result obtained in this study were that almost all Spelt Wheat
genotypes (except Sp41) get better results than the Wheat genotype used as reference,
Adana99. Thus, it is concluded that Spelt crops are more resistance than Bread Wheat crops
under salt stress conditions. Future works should be focused in study more parameters (for
example: carbohydrates content, transpiration rate, membrane integration, photosynthetic
pigments) to get more consistent data. Also, it is crucial continue to study Spelt genotypes in
order to find resistant genotypes to be used in breeding programs, once that agricultural
![Fig. 1.2 - The evolution of wheat. [1]](https://thumb-eu.123doks.com/thumbv2/123dok_br/16635210.740979/21.892.303.629.716.1066/fig-evolution-wheat.webp)