Journal of Coastal Research SI 64 pg - pg ICS2011 (Proceedings) Poland ISSN 0749-0208
Acacia saligna (Labill.) H. Wendl in the Sesimbra County: invaded
habitats and potential distribution modeling.
F. Gutierres†, A. Gil‡, E. Reis†, A. Lobo∞ , C. Neto†, H. Calado§ and J. C. Costa§§
† Institute of Geography and Territorial Planning (IGOT), University of Lisbon, 1600-214 Lisbon, Portugal [email protected], [email protected], [email protected] ‡, CITA-A (Azorean Biodiversity Group), University of the Azores, 9501-801 Ponta Delgada, Portugal [email protected] ∞ Institute of Earth
Sciences Jaume Almera (ICTJA), E-08028 Barcelona, Spain, [email protected] § CIBIO (Azores Unit), University of the Azores, 9501-801 Ponta Delgada, Portugal [email protected] §§ Superior Institute of Agronomy - Technical University of Lisbon (TULisbon), 1349-017 Lisbon, Portugal [email protected] ABSTRACT
Gutierres, F.; Gil, A.; Reis, E.; Lobo, A.; Neto, C; Calado, H. and Costa, J.C. 2011. Acacia saligna (Labill.) H. Wendl in the Sesimbra Council: Invaded habitats and potential distribution modeling. Journal of Coastal Research, SI 64 (Proceedings of the 11th International Coastal Symposium), pg – pg. Szczecin, Poland, ISSN 0749-0208
The aim of this study is to establish the spatial pattern of colonization and spread of Acacia saligna by predictive modeling, susceptibility evaluation and to perform a cost-effective analysis in two sites of community importance (Fernão Ferro/Lagoa de Albufeira and Arrábida/Espichel) in the Sesimbra County. The main goal is to increase the knowledge on the invasive process and the potential distribution of the Acacia saligna in Sesimbra County, namely in the Natura 2000 sites. The Artificial Neural Networks model was developed in Open Modeller to predict the potential of occurrence of A. saligna, and is assumed to be conditioned by a set of limiting factors that may be known or modeled. The base information includes a dependent variable (present distribution of specie) and several variables considered as conditioning factors (topographic variables, land use, soils characteristics, river and road distance), organized in a Geographical Information System (GIS) database. This is used to perform spatial analysis, which is focused on the relationships between the presence or absence of the specie and the values of the conditioning factors. The results show a high correspondence between higher values of potential of occurrence and soils characteristics and distance to rivers; these factors seem to benefit the specie’ invasion process. According to the conservation value of each cartographic unit, related to natural habitats included in Habitats Directive (92/43/EEC), the coastal habitats (2130, 2250 and 2230) were the most susceptible to invasion by A. saligna. The predicted A. saligna distribution allows for a more efficient concentration and application of resources (human and financial) in the most susceptible areas to invasion, such as the local and national Protected Areas and the Sites of Community Importance, and is useful to test hypotheses about the specie range characteristics, habitats preferences and habitat partitioning.
ADDITIONAL INDEX WORDS:Species Distribution Model, GIS, Conservation
INTRODUCTION
Invasions by alien species are widely recognized as a significant component of global environmental changes caused by human action, often resulting in a relevant loss in economic value, biological diversity and functions of invaded ecosystems (Mooney & Hobbs, 2000). The biological invasion by exotic species is considered the second leading cause for the global loss of biodiversity, being exceeded only by habitat destruction. However, most of these invasive species are introduced after a new habitat become harmful and causes serious problems, including economic, ecological and social (Rodríguez-Echeverría
et al., 2009). The basic factor that characterizes the ecology of
species invasion is its connection to human activities. Anthropic influence on vegetation has been occurring for at least 10 thousand years (since the Neolithic period), when men as primitive agriculturalist started to manage the landscape. At the beginning, the human impact was low and local but the acceleration of cultural development led to unprecedented change in the dynamics of species exchange. We talk about invasions when the accelerated development changes the rate of species exchange (Hrázský,
2005). Secondly, a less evident but typical trait of ecological invasion is its impact on native species (especially in the Natura 2000 network) and expenses related to the suppression of invader, e.g. for conservation or economic purposes. Indeed, the habitats of Natura 2000 network in Portugal require the development of management plans and their implementation to respond effectively to various threats (Costa et al., 2007). According to Peters et al. (2004), the researchers and stakeholders need to use local measurements to assess change at landscape and habitats, and statistical or simulation models are often used to extrapolate environmental data in space. Species distribution modelling (SDM) allows the development of models for environmental assessment and biodiversity conservation. According to Franklin (2009) SDM is “geographical modelling of biospatial patterns in the relation to environmental gradients”. With SDM, it is possible to extrapolate species distributions data in space and time, usually based on a statistical model (Guisan and Zimmermann, 2000). SDMS are increasingly used in ecological modelling, landscape modelling of plants community dynamics, such as forest succession and in invasive species risk assessment. The growing
Gutierres et al.
use of the SDM is to determine locations where an invasive species is likely to become established. In SDM, one frequently links species location data (entities) with environmental maps (fields) to produce a new field-view of species occurrence, the distribution map (Ferrier, 2002). In this context, the potential of occurrence (PO) maps are required to prioritize or target areas for protected status, to assess threats to those areas, and to design reserves. When applied to maps of environmental variables or predictors, SDM is said to predict the species potential geographical distribution. The aim of this study is to determine the relationship between Acacia saligna (Labill.) Wendl. and its abiotic and biotic environment based on observations for the purpose of ecological inference in two Sites of Community Importance (SIC) - “Fernão Ferro/Lagoa de Albufeira” – “Arrábida/Espichel” in Sesimbra County. A. saligna, a phanerophyte native to the Southwestern corner of Australia was introduced in Sado Estuary, mainly in coastal areas, for forestation; at present, it is considered naturalized becoming invasive in sand dune habitats. Acacia species were probably introduced 50-60 years ago, to prevent dune erosion in the south of Tróia Peninsula. Furthermore, it is regarded as an invasive weed in Chile, Spain, Italy, Cyprus and South Africa. Until recently A. saligna was regarded as the most important invasive weed in the Capensis floristic region of South Africa, where it appears to alter N-cycling regimes through long-term invasions (Yelenik et al. 2004). Finally, based on the predictive map of PO of A. saligna we evaluated the conservation value of each cartographic unit, corresponding to natural habitats as described in Annex I of EU Habitats Directive (92/43/EEC).
MATERIAL AND METHODS
Study Area
The study area consists of an ecological corridor with 10,370 hectares resulting from the aggregation and overlap of 4 important ecological sites: Arrábida Natural Park (ANP) (National Protected Areas Network); Costa da Caparica Fossil Cliff Protected Landscape (PPAFCC) (National Protected Areas Network); Sites of Community Importance (SCI) “Fernão Ferro/Lagoa de Albufeira” (Natura 2000 Network); Sites of Community Importance (SCI) “Arrábida/Espichel” (Natura 2000 Network) (Figure 1). Despite its ecological importance, the Sesimbra County has faced various threats to the sustainability of plant communities, the pressure induced by urban development and increasing economic activities on coastal areas and many areas showing evidence of coastal erosion.
Data Sets
We chose an extensive model area to capture the natural variability of the geographical patterns of A. saligna. Concerning the training data of the Artificial Neural Networks (ANN) (single layer perceptron) model, 486 surveys of species presence were analysed. There are two sources of A. saligna invaded sites locations: Institute for Nature Conservation and Biodiversity database (ICNB) (456) and collected by author (30). Considering the rules of ANN model, we need to consider the absence data. The subset of absence data (486 surveys) was based on interpretation of orthophotos from Portuguese Geographic Institute (IGP)) and Land Use Map (COS90). The absence of A.
saligna can be caused by history of invasion process or
unsuitability of site conditions. According to Jiménez-Valverde et
al. (2009), the sample size of each event (presences or absences)
and the completeness of the representation of the environmental gradient, provided by the training data, arise as important factors affecting the likelihood of obtaining reliable models. According to
Franklin (2009) and Jiménez-Valverde et al. (2009), prevalence is a term that has been widely used for the frequency (proportion) of events, records of species presence, in a presence/absence sample. In this paper, we consider a prevalence value of 1. In this sense, we used the same number of absences and presences to fit the model, despite the availability of a higher number of absence points. These techniques are of special importance to model the potential of occurrence of A. saligna, which occupy a small proportion of a study´s spatial extent, so absences are necessary to include the restrictions within model predictions.
Figure 1. Location of the study area.
Environmental Data
The information about the independent variables (predictors) was collected from several sources and integrated in a GIS database. Only indirect factors that are known to causally affect the invasion process of A. saligna were included as potential predictors. Indirect gradient factors have no direct effect on species distribution or abundance, and so are always distal variables (related to resources or regulators, proximal factors). Two categorical variables (land use and soils characteristics) and four quantitative variables (elevation, exposure, distance to roads (national and highways) and distance to rivers) (main rivers and tributaries) were considered. The hierarchical framework of factors affecting the A. saligna distribution is based on local extent range. In this context we assumed a fine-scale, spatial resolution of 100 m2, when those factors act at the finer scale. Table 1 describes the basic characteristics of the environmental dataset.
Species Distribution Modeling (SDM)
According to Franklin (2009), the SDM applied to A. saligna and predictive mapping follows three steps:
a) Pre-analysis X2 test to independent variables. The X2 test
with minimal p-level < 0.01 was computed using SPSS v. 18 software.
b) Presence and pseudo-absence datasets of the specie were mapped, using a GIS (ArcGIS 9.2), and linked to digital maps that represent the spatial distribution of environmental predictors.
c) An ANN describing the relationship between species occurrence and environmental data was developed. These are the most commonly used ANNs in ecology (Olden et al., 2008). The predictions were performed using statistical software Open Modeller v. 1.0.10.
d) Model evaluation. We applied the train-test ratio of 75:25. We performed the Receiver Operating Characteristics (ROC) curve analysis with an independent dataset. According to Franklin (2009), the ROC plot is a graph of the false-positive error (Specificity) versus the true positive rate (Sensitivity) based on each possible value of threshold
GIS and Remote Sensing Applications
probability (i.e. every probability value predicted by the model for the data). The area under the ROC curve (AUC) is often used as a single threshold-independent measure for model performance.
We used the Pearson correlation coefficient to evaluate the predictive accuracy of A. saligna distribution with independent variables.
Table 1: Characteristics of variables used as environmental predictors.
Variable Scale Unit: Description and Data Source
Altitude Ratio m Calculated for grid with 10 m cell side. 5 intervals: 35, 82,143, 254, 500. Geographic Institute of the Army (IGeoE).
Exposition Interval
Calculated in GIS from altitude. 9 intervals: Flat (-1), North (0-22.5), Northeast (22.5-67.5), East (67.5-112.5), Southeast (112.5-157.5), South (157.5-202.5), Southwest (202.5-247.5), West
(247.5-292.5), Northwest (292.5-337.5). Distance to
rivers Ratio m
Calculated for grid with 10 m cell side. 5 intervals: 117, 352, 746, 1354, 2730. Geographic Institute of the Army (IGeoE).
Distance to
roads Ratio m
Calculated for grid with 10 m cell side. 5 intervals: 771, 2029, 3815, 6006, 10390. Geographic Institute of the Army (IGeoE).
Soil
characteristics Ordinal
Diagnostic soil characteristics calculated with10 m cell side. 12 levels of constraints for forestry development in ascending order: 1 - No limitations, 2 - expandability, 3 - Active lime, 4 - textural discontinuity, 5 - Vertic characteristics, 6 - Soil salinity, 7 - External drainage, 8 - Internal drainage, 9
- Sandy texture, 10 - Effective thickness, 11 - Rocky outcrop and soil without productivity, 12 – Social area. Diagnostic soil characteristics from data prepared by Gutierres (2004). Institute for
Hydraulics, Rural Engineering and Environment IHERA.
Land use Factorial 5 levels of Land use: Forest; Aquatic lands; Buildings, infrastructures, urban green spaces and unproductive areas; Semi Natural areas; Agricultural areas. IGP.
Relationship between habitats of the Natura 2000
network and Potential of Occurrence of Acacia
saligna
We investigated relationships between the habitats of the Natura 2000, located in Sesimbra County and the PO using Gini coefficient and Lorenz Curve. These two measures of statistical dispersion allow us to analyse the invasion behaviour of A. saligna along several habitats. The Gini coefficient is a measure of the inequality of a distribution, a value of 0 expressing total equality and a value of 1 maximal inequality. The Lorenz curve is also useful in describing inequality, where the cumulative proportion of PO is plotted against cumulative proportion of habitats. Additionally, we performed a spatial analysis with GIS tools to identify and quantify the most vulnerable habitats (with the greatest PO) to invasion of A. saligna.
RESULTS
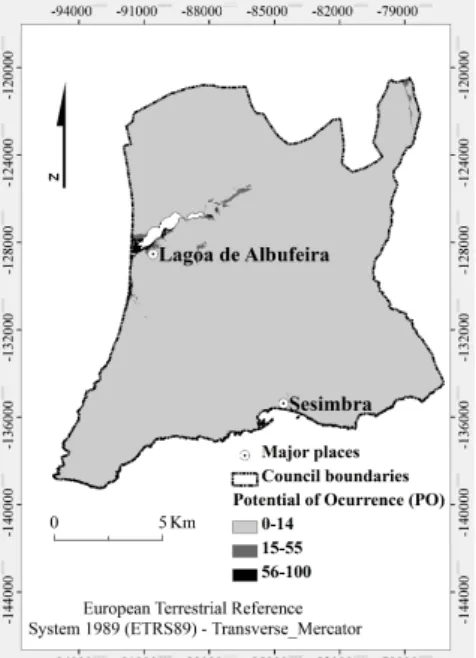
Figure 2 shows the probability maps produced for the PO of A.
saligna in Sesimbra County using the ANN method.
The Chi-square test for independence (X2 test) applied to all variables showed that the difference was not significant. The Pearson correlation between the independent variables and PO showed that the soil characteristics (r = 0.471, <0.01 level) and distance to rivers (r = 0.444, <0.01 level) have medium positive correlation with the phenomena and are the best predictors. However, the others variables have a relative importance in the ANN model (Table 2). The predictive performance was better than we expected, confirmed by the high similarity of ROC curve and by the Total Area Under Curve (AUC) (0.93) (Figure 3).
Results from the Gini coefficient (0.81) and Lorenz curve (Figure 4) show the high inequality of a distribution of the PO in habitats of Natura 2000 network in the studied area.
These stress the importance of coastal dune systems in the study area. The invasiveness and expansion of the specie has been detected and recognized as threatening the habitats: fixed coastal dunes with herbaceous vegetation (grey dunes) (2130), coastal
dunes with Juniperus spp. (2250), Malcolmietalia dune grasslands (2230), Atlantic decalcified fixed dunes (Calluno-Ulicetea) (2150) and Cisto-Lavenduletalia dune sclerophyllous scrubs (2260) (Table 3). It is interesting to note that 2130, 2150 and 2250 are considered a priority habitat for conservation.
Figure 2. Potential of occurrence of Acacia saligna at Sesimbra County.
Gutierres et al. 0 0,2 0,4 0,6 0,8 1 0 0,2 0,4 0,6 0,8 1 S en si ti v it y Specificity ROC curve AUC = 0.93
Figure 3. ROC curve.
0 10 20 30 40 50 60 70 80 90 100 0 20 40 60 80 100 C u m u la ti v e sh a re o f P O ( % )
Cumulative share of habitats (%)
Lorenz curve
Lorenz curve Perfect equality line
Figure 4. Lorenz curve to habitats of the Natura 2000 versus PO at Sesimbra County.
Table 2: Potential occurrence of variables considered as predisposing factors to invasion of Acacia saligna in Sesimbra County.
Variable Classes PO (%) Area (ha)
Altitude (m) 0-35; 36-82; 83-143; 144-254; 255-500 1-100; 1-49; 1-24; 1-24; 1-24
246,049; 912,604; 427,656; 326,962; 20,920
Exposition Flat; North; Northeast; East; Southeast; South; Southwest; West; Northwest
100; 100; 100; 74; 74; 74; 74; 1-100; 1-100 595,361; 226,826; 172,362; 132,441; 109,985; 110,912; 142,000; 188,706; 255,598 Distance to rivers (m) 0-117; 117-352; 353-746; 747-1354; 1355-2730 1-100; 1-100; 1-49; 1-24; 1-24 1,264,546; 501,378; 91,594; 57,738; 18,929 Distance to roads (m) 0-771; 772-2029; 2030-3815 1-100; 1-49; 1-24 1,145,086; 647,158; 141,909 Soil characteristics
No limitations; Expandability; Active lime; Textural discontinuity; Vertic characteristics; External drainage; Internal drainage; Sandy texture;
Effective thickness; Social area
1-89; 1-24; 1-49; 1-24; 1-24; 1-89; 1-74; 1-100; 1-24; 1-100 845,079; 83,721; 153,458; 14,893; 4,548; 72,115; 69,975; 468,598; 138,736; 82,927 Land use
Forest; Aquatic lands; Buildings, infrastructure, urban green spaces and unproductive areas; Semi
Natural areas; Agricultural areas
89; 100; 100; 1-100; 1-89
974,851; 2,928; 128,693; 377,651; 448,120
Table 3: Habitats most susceptible to invasion by Acacia saligna in Sesimbra County.
Habitat Code Designation Potential of Occurrence (%) Area (ha)
2130 *Fixed coastal dunes with herbaceous vegetation (grey
dunes) (priority habitat) 75-89 8
2250 * Coastal dunes with Juniperus spp. (priority habitat) 50-74 1
2230 Malcolmietalia dune grasslands 25-49 80
2150 * Atlantic decalcified fixed dunes (Calluno-Ulicetea) 1-24 29,682
2260 Cisto-Lavenduletalia dune sclerophyllous scrubs 1-24 24,051
DISCUSSION
The localized occurrence, with high incidence in Western part of the SCI “Fernão Ferro/Lagoa de Albufeira”, means that the A.
saligna is found in specific locations where there is a greater PO.
The high specificity of occurrence seems to indicate that the species is in equilibrium with the area’s ecosystem, as supported by its spread, during the last decades, over some dune systems to promote dune fixation. The SDM applied to A. saligna indicates which classes of independent variables provide a better explanation for the phenomenon. The analysis of the Figure 2 shows the existence of zones, within the ecological corridor of Sesimbra County, with a PO above 50% (moderate to high potential), especially in the transition area between the PPAFCC and SCI “Fernão Ferro/Lagoa de Albufeira”. The areas with higher PO are distributed mainly between 0 and 35 meters, on the cooler and humid slopes with greater temperature fluctuations (North and West). In regard to soil characteristics, the external drainage and sandy texture are favourable to A. saligna. It seems
that this species tends to spread out in situations of potential water accumulation on the soil surface (alluvial and colluvial soils) and inadequate capacity of water storage (psammitic regosols soils). Such aspects show the invasive nature of A. saligna. The specie prefers semi natural areas, lowlands, agricultural and transformed lands, aquatic lands (margins of lakes and lagoons), beaches, dunes and soil without vegetation cover. The increase of the distribution of A. saligna in the Sesimbra County depends on its growth and reproduction rate, on the efficiency of the dispersal mechanisms and the characteristics of the invaded habitat. It highlights the presence of sandy and psammitic soils, margins of water lines for a distance up to 352 meters and margins of roads for a distance up to 771 meters. For several types of rivers high variability processes (flow and sediment regime) promote physical heterogeneity (morphological complexity), considerably influencing biological factors. According to Mehta (2000), riparian habitats are particularly sensitive to invasion. They provide easy access to moisture and periodic disturbances, such as floods, which disperse seed, prepare them for germination,
Gutierres et al.
provide a seed bed, and remove competing plants. Thus, with plenty of disturbance and little competition, A. saligna rapidly and heavily invades margins of water lines. Finally, according to Forman and Deblinger (2000), determining the ecological road-effect zone for roads is a central part of the evaluation of invasive plant spread. This zone is the area over which significant ecological effects extend outward from a road. The road-effect zone is highly asymmetric, due to nature´s directional flows and the spatial patterns on opposite sides of a road, and has convoluted boundaries. Road networks that cross landscapes cause local hydrologic and erosion effects, whereas stream networks and distant valleys receive major peak-flow and sediment impacts. Chemical effects occur mainly near roads. Road networks interrupt horizontal ecological flows, alter landscape spatial pattern, and therefore inhibit important interior species (natural vegetation). Indeed, a distance up to 1000 m tends to reduce plant species richness and favour the invasion by A. saligna.
CONCLUSION
This study puts forward an explanation of the physical and biological conditions that lead to a greater PO of the A. saligna. This knowledge is very useful to those responsible for management and protection of classified areas (national protected areas and Natura 2000 Sites), as it leads to a better concentration and application of resources (human and financial) in areas most susceptible to invasion by A. saligna. For instance the area between the North Western areas of PPAFCC and SCI “Fernão Ferro/Lagoa de Albufeira”. SDM has proven very useful for estimating first-order relationships between specie distribution and environmental factors. The applied SDM showed that soil characteristics and distance to rivers are the best predictors to perform the modeling of the potential of occurrence of A. saligna. The gains in accuracy from using ANN models (“black box”) may be cancelled out by the loss of ability to interpret to model parameters for ecological meaning. The results obtained by these models provide a general trait of the ecological patterns and potential impacts of invasive species on the territory and its biodiversity. In this sense, because of its preference for permanently moist sites, A. saligna in Sesimbra County is commonly associated with aquatic lands, lowlands, agricultural and transformed lands, and dunes. In the boundaries of aquatic, namely the “Albufeira” lagoon and the riparian lands are particularly sensitive to invasion. They provide easy access to moisture and periodic disturbances such as floods, which disperse seed, prepare them for germination, provide a seed bed, and remove competing plants. The plantation of A. saligna in sand dune system started at in the beginning of 20th century (1920) to stabilize the dunes. The coastal habitats in Sesimbra County are very threatened by the expansion of A. saligna, and have a great potential loss. It is mainly the Natura 2000 habitats 2130, 2250 and 2230 that need more protection and restoration to assure their dynamic equilibrium. The most important thing to remember in the restoration of an A. saligna-invaded system is that the restoration problem is not only the seed bank, but also the soil nutrient changes and the above ground structure of the invaded habitats. This existing seed bank of coastal plant communities, mainly in Malcolmietalia dune grasslands (2230), is of utmost importance to the successful restoration of these habitats. The ecological management may also maintain roadside native-plant communities in areas of intensive agriculture, reduce the invasion of A. saligna, attract or repel animals, enhance road drainage, and reduce soil erosion. It was also possible to expand the knowledge of environmental factors involved in the processes of invasion of
A. saligna. SDM is being used increasingly to extrapolate species
distribution in time and space in order to predict the risk of species invasions, the spread of disease organisms, and the impact of climate change on biodiversity. In conclusion, we believe this study is useful to define monitoring strategies (particularly in the most vulnerable Nature 2000 Network Habitats in Sesimbra County), based on biophysical and biological patterns, to promote the eradication and mitigation of impacts of biological invasions.
LITERATURE CITED
Costa, J.C.; Monteiro-Henriques, T.; Neto, C.; Arsénio, P. and Aguiar, C., 2007. The Application of the Habitats Directive in Portugal. Fitosociologia, 44(2), 23-28.
Ferrier, S., 2002. Mapping spatial pattern in biodiversity for regional conservation planning: where to from here?.
Systematic Biology, 51, 331-363.
Forman, R.T.T. and Deblinger, R.D. 2000. The ecological road-effect zone of a Massachusetts (USA) suburban highway.
Conservation Biology, 14: 36-46.
Franklin, J., 2009. Mapping species Distributions: Spatial
Inference and Prediction. New York: Cambridge University
Press, 320p.
Guisan, A. and Zimmermann, N.E., 2000. Predictive habitat distribution models in ecology. Ecological modeling, 135, 147-186.
Gutierres, F., 2004. Modelo de Dados para Avaliação das Potencialidades Agro-Florestais no Concelho de Vendas Novas. University of Évora, Licenciatura thesis, 126p. Hrázský, Z., 2005. Acer negundo L. in the Czech Republic:
Invaded habitats and potential distribution modeling. Czech Republic, University of South Bohemia, Faculty of Biological Sciences, Master's thesis, 48p.
Jiménez-Valverde, A.; Lobo, J.M. and Hortal, J. 2009. The Effect of prevalence and its interaction with sample size on the reliability of species distributions models. Community
Ecology, 10, 196-205.
Mehta, Smita. 2000. The Invasion of South African Fynbos by an Australian Immigrant: The story of Acacia saligna.
Restoration and Reclamation Review, 6(5), 1-10.
Mooney, H.A. and Hobbs, R.J., 2000. Invasive species in a
changing world. Washington, DC: Island Press, 439 p.
Olden, J.D.; Lawler, J.J. and Poff, N.L. 2008. Machine learning methods without tears: A primer for ecologists. Quarterly
Review of Biology, 83, 171-193.
Peters, D.P.C.; Herrick, J.E.; Urban, D.L; Gardner, R.H. and Breshears, D.D., 2004. Strategies for ecological extrapolation.
Oikos, 106, 627-636.
Rodríguez-Echeverría, S.; João, J.A.; Nabais, C. and Freitas, H., 2009. Belowground mutualists and the invasive ability of Acacia longifolia in coastal dunes of Portugal. Biological
Invasions, 11(3), 651-661.
Yelenik, S.G.; Stock, W.D. and Richardson, D.M. 2004. Ecosystem Level Impacts of Invasive Acacia saligna in the South African Fynbos. Restoration Ecology, 12, 44–51.
ACKNOWLEDGEMENTS
The current research is part of the PhD Project «Structure and dynamics of habitats and landscapes of Sado Estuary and Comporta/Galé Places». The PhD Scholarship (SFRH/BD/45147/2008) is funded by the Portuguese Foundation for Science and Technology (FCT). The authors wish to thank the staff of Institute for Nature Conservation and Biodiversity (ICNB) for supporting the research.