Upward Altitudinal Shifts in Habitat
Suitability of Mountain Vipers since the Last
Glacial Maximum
Masoud Yousefi1, Mohsen Ahmadi1,2, Elham Nourani1,3, Roozbeh Behrooz4, Mehdi Rajabizadeh5,6,7, Philippe Geniez4, Mohammad Kaboli1*
1Department of Environmental Sciences, Faculty of Natural Resources, University of Tehran, Tehran, Iran, 2Department of Natural Resources, Isfahan University of Technology, Isfahan, Iran,3Graduate School of Fisheries Science and Environmental Studies, Nagasaki University, Nagasaki, Japan,4CEFE UMR 5175, CNRS—Université de Montpellier—Université Paul-Valéry Montpellier–EPHE, laboratoire Biogéographie et écologie des vertébrés, 1919 route de Mende, 34293 Montpellier cedex 5, France,5Evolutionary Morphology of Vertebrates, Ghent University, Ghent, Belgium,6Department of Biodiversity, Institute of Science and High Technology and Environmental Sciences, Graduate University of Advanced Technology, Kerman, Iran,7Iranian Plateau Herpetology Research Group (IPHRG), Faculty of Science, Razi University, Kermanshah, Iran
Abstract
We determined the effects of past and future climate changes on the distribution of the Mon-tivipera raddeispecies complex (MRC) that contains rare and endangered viper species limited to Iran, Turkey and Armenia. We also investigated the current distribution of MRC to locate unidentified isolated populations as well as to evaluate the effectiveness of the cur-rent network of protected areas for their conservation. Present distribution of MRC was modeled based on ecological variables and model performance was evaluated by field vis-its. Some individuals at the newly identified populations showed uncommon morphological characteristics. The distribution map of MRC derived through modeling was then compared with the distribution of protected areas in the region. We estimated the effectiveness of the current protected area network to be 10%, which would be sufficient for conserving this group of species, provided adequate management policies and practices are employed. We further modeled the distribution of MRC in the past (21,000 years ago) and under two scenarios in the future (to 2070). These models indicated that climatic changes probably have been responsible for an upward shift in suitable habitats of MRC since the Last Glacial Maximum, leading to isolation of allopatric populations. Distribution will probably become much more restricted in the future as a result of the current rate of global warming. We con-clude that climate change most likely played a major role in determining the distribution pat-tern of MRC, restricting allopatric populations to mountaintops due to habitat alterations. This long-term isolation has facilitated unique local adaptations among MRC populations, which requires further investigation. The suitable habitat patches identified through model-ing constitute optimized solutions for inclusion in the network of protected areas in the region.
OPEN ACCESS
Citation:Yousefi M, Ahmadi M, Nourani E, Behrooz R, Rajabizadeh M, Geniez P, et al. (2015) Upward Altitudinal Shifts in Habitat Suitability of Mountain Vipers since the Last Glacial Maximum. PLoS ONE 10(9): e0138087. doi:10.1371/journal.pone.0138087
Editor:Ulrich Joger, State Natural History Museum, GERMANY
Received:September 1, 2014
Accepted:August 26, 2015
Published:September 14, 2015
Copyright:© 2015 Yousefi et al. This is an open access article distributed under the terms of the
Creative Commons Attribution License, which permits unrestricted use, distribution, and reproduction in any medium, provided the original author and source are credited.
Data Availability Statement:All relevant data are within the paper and its Supporting Information files.
Funding:The authors received no specific funding for this work.
Introduction
Global climate change is responsible for large-scale alterations in geographic distributions of animal and plant species worldwide [1,2]. The magnitude of such changes is expected to increase with latitude, putting mountain-dwelling species especially at risk in the face of future climatic changes [1]. Climate-induced habitat alterations are particularly severe for reptiles [3– 5]. In fact, occurrence of reptiles has been highly impacted by climatic changes throughout his-tory, mainly due to their limited dispersal ability [6].
In general, current geographic distributions of taxa can be explained by the patterns of past climate changes, especially relative to glacial periods [7,8]. The ice ages became especially severe through the Pleistocene [7] and the most recent glaciation reached a peak about 18,000–
21,000 years ago [9]. In the Iranian plateau, the resulting shifts in the snowline in mountainous regions reshuffled the geographic distribution of many taxa [10].
TheMontivipera raddeispecies complex (MRC) contains rare species with small allopatric populations [11–13] that are distributed in highland habitats of Iran-Anatolian plateau and the lesser Caucasus Mountains [14]. Following Rajabizadeh (2013), MRC consists of four taxa: Montivipera kuhrangica[11],M.latifii[15],M.raddei raddei[16], andM.raddei albicornuta [17]. The whole complex faces severe threats that make it highly vulnerable to extinction [11,12,18]. Habitat loss is indeed the major threat, especially toM.kuhrangica,M.r. albicor-nuta, andM.latifii, which are endemic to Iran and exceptionally rare [11,19]. Illegal collection-especially ofM.r.albicornutaandM.latifii- for antivenin production [20] is also taking a toll on these vulnerable species.
The distribution of MRC has not been thoroughly investigated and factors limiting its distri-bution are not understood. It is known however, that MRC populations appear in small iso-lated patches [11,12,21]. The recent identification ofM.kuhrangica, as the most southern distribution among this complex in Zagros Mountains [11] indicates the possibility that within the matrix of seemingly unsuitable habitats for MRC, patches of suitable habitat occupied by isolated and relict populations have remained unidentified.
Ecological Niche Models (ENMs) are fundamental tools for conservation and management of species [22,23], especially those that are rare, poorly documented [24], and are consequently in higher risk of extinction [25]. Species distribution modeling increases our knowledge on dis-tribution of species, highlights factors that are most important in shaping their disdis-tribution, and aids to make predictions about their potential distribution in the future [26–28]. Compar-ing ENMs with the current system of nature reserves can have great implications for conserva-tion of threatened species.
Materials and Methods
Predictor variables
Explanatory variables were prepared for two modeling approaches; a general model to predict the current potential distribution of MRC, and climate-only models to evaluate possible changes on bioclimatic niche under climate change scenarios. For the general model, we used three categories of eco-geographic factors, including climate, topography and land-cover (Table 1) that have a direct interaction with the species and were chosen based on ecological theory [31]. Climate variables were obtained from WorldClim dataset [32] as interpolated cli-mate data layers created by collecting large amounts of weather station data. We used climatic variables as the most important factors describing the species thermal tolerance as well as water availability throughout the year, temperature and precipitation in May, when vipers wake up from hibernation in our study area.
Because of the high autocorrelation between climatic variables, we extracted values for these variables from occurrence points of the species and screened them to low-correlated (r<0.8)
variables. Using the Shuttle Radar Topography Mission (SRTM) elevation model, three topo-graphic explanatory variables were compiled: elevation and slope as the most important factors describing topographic context, as well as Solar Radiation Index (SRI), calculated for a period between April to June to depict total amount of incoming solar insolation (WH/m2year). We considered SRI because the regarded period coincides with MRC post-hibernation, when receiving thermal energy is an important factor affecting these species. SRI was calculated in ArcGIS 9.3 Spatial Analyst Tools using the Digital Elevation Model (DEM) of the study area.
Table 1. Eco-geographic factors used for modeling the distribution ofMontivipera raddeispecies complex in Iran, Turkey and Armenia. Variables in bold type were used in climate change scenarios and were prepared with 2.5 arc-second resolution.
Variable Description (abbreviation) Unit
Topographic Altitude: Elevation above sea level (altitude) m
Slope steepness (slope) %
Solar Radiation Index (sri) WH/m2year
Cover Distance to rainfed croplands (crop_dis) Degrees
Distance to mosaic vegetation/cropland (crop_veg_dis) Degrees
Distance to broadleaved deciduous forest /woodland (forest_dis) Degrees Distance to mosaic forest or shrubland / grassland (frst_shrb_dis) Degrees Distance to mosaic grassland (50–70%) / forest or shrubland (gras_shrb_dis) Degrees Distance to closed to open (>15%) shrubland (shrub_dis) Degrees Distance to closed to open herbaceous vegetation (herb_dis) Degrees Distance to sparse (<15%) vegetation (sprs_veg_dis) Degrees
Bioclimatic Annual precipitation (anulprc) mm
Precipitation in the driest month (driest) mm
Precipitation in the wettest month (wettest) mm
Precipitation seasonality (prcseas) adimensional
Annual mean temperature (anulmeantmp) °C
Minimum temperature of coldest month (coldest) °C Maximum temperature of warmest month (warmest) °C
Temperature seasonality (tmpseas) adimensional
Mean temperature of May (tmean5) °C
Maximum temperature of May (tmax5) °C
Minimum temperature of May (tmin5) °C
Precipitation in May (prc5) mm
For land-cover data we used cover types from Globcover v. 2.1 map [33] as a global dataset, which contains 63 cover types (including 19 types for our study area) based on the standard UN Land Cover Classification System (LCCS). We extracted cover types that described the nat-ural background of the landscape. Moreover, to provide continuity, Euclidian distance to near-est cover patch was calculated in ArcGIS 9.3. All eco-geographic variables were prepared with the finest resolution that WorldClim dataset allowed (approximately 1 × 1 km precision).
To assess the possible bio-geographical changes in the climatic niche of the MRC, we traced the distribution of the complex over the Last Glacial Maximum (LGM) (*21 kyr BP), present and future (average for 2061–2080). Herein, we developed an ENM for the present climate con-ditions by using 2.5 arc-second variables and subsequently projected it onto the past and future conditions. The bioclimatic data for the LGM were developed and mapped by Paleoclimate Modeling Intercomparison Project Phase II (PMIP2) based on two different global circulation models, GCM: the Community Climate System Model (CCSM), [34]), and the Model for Inter-disciplinary Research on Climate (MIROC), [35]. Furthermore, distribution of MRC under possible future climate conditions was assessed for the year 2070 (on average for 2061–2080). We used the output from the general circulation model CCSM4 from the Intergovernmental Panel on Climate Change (IPCC) 4th Assessment. Based on different inputs of greenhouse gas emission drivers (i.e. population and economic growth, technological choices), land use changes, environmental policy options and adaptation processes [36], the IPCC recommended four representative concentration pathways (RCPs) which are part of the IPCC fifth assessment report finalized in 2014. Each pathway is defined by a radiative forcing value which describes the change in the amount of energy entering the atmosphere and the quantity that is reflected back, and is expressed in Watts per square meter of surface (W/m2). The radiative forcing lev-els estimated to be reached by the end of the century include 2.6, 4.5, 6.0 and 8.5W/m2 [37]. In this study we considered minimum and maximum values of radiative forcing levels including 2.6 and 8.5 W/m2 that describe a mitigation scenario and high emission scenario, respectively. All bioclimatic variables for the last glacial period, as well as present and future conditions were downloaded from WorldClim dataset (Table 1).
Distribution modeling
techniques, Maxent incorporates the complicated interactions between predictor variables [39,40], and is accordingly less liable to autocorrelation effects than other methods.
The training area of an ENM preferably comprises environmental conditions that are acces-sible for the target species [41]. In this study, for the climate change evaluations we restricted the training range to an area defined by a circular buffer of 200 km enclosing all species rec-ords, and the derived model for the present climate conditions was considered as a baseline model. Next, we projected the baseline model onto the past and future conditions. To avoid negative effects when projecting an ENM onto novel conditions outside the training range of the model [42,43], for all projections we also calculated multivariate environmental similarity surface (MESS) to represent how similar a point is to training background range of the baseline model.
To make better use of the small sample size, we applied the cross-validation method in Max-ent 3.3.3, where the occurrence data was randomly split into 10 equal-sized folds, and training models were created by eliminating each fold in turn. The eliminated folds were then consid-ered to test the performance of the training models using receiver operating characteristic (ROC) plots. We used ROC as a measure of discrimination capacity to represent the models’
ability to predict species presence and absence locations by plotting sensitivity (true positive) against 1–specificity (false positive) [38,44] and used derived Area Under the Cure (AUC) sta-tistic as a measure of overall fit of the models. Since ROC is a threshold-independent method, considering maximum training sensitivity plus specificity logistic thresholds–as a recom-mended suitability threshold [45]—we averaged omission error of cross-validated folds to eval-uate classification accuracy of the ENMs. We also evaleval-uated variable importance for all models by conducting a jackknife analysis. By performing the model repeatedly leaving out one able at a time and computing a model using each variable alone, the importance of each vari-able within the models was determined.
We also generated 1000 random points within the baseline climatic niche, extracted annual mean temperature of climate change scenarios for each point, and averaged this parameter through random points. Doing so helped us get a better understanding of the changes in tem-perature throughout the years.
Overlap with protected area network
Evaluating the level of conservation achieved by protection areas can be done by considering species occurrence data [46–48] or using species distribution models [49,50]. To assess the degree of protection granted to MRC in the conservation areas, we overlaid the Maxent suit-ability map with the map of protected areas of Iran, Turkey and Armenia. The protected area network of Iran, including the newest list of national parks, protected areas and wildlife refuges was derived from Iran Department of Environment and a shape file including protected areas of Turkey and Armenia was downloaded fromhttp://protectedplanet.net.
Results
Ecological niche models for MRC
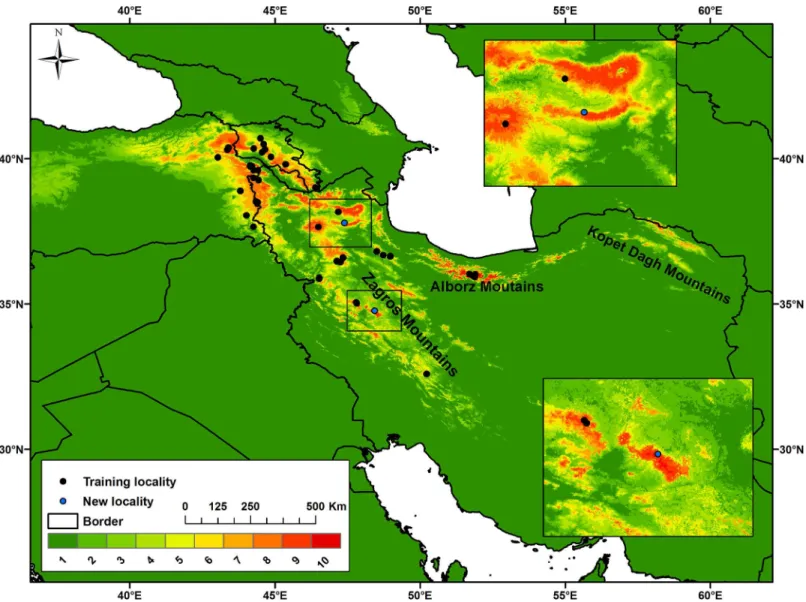
Results of ecological niche modeling showed that suitable habitats of MRC are patchily distrib-uted in higher elevations of the Zagros, Alborz, and Kopet Dagh mountains within Iran, and in Ararat and lesser Caucasus in Turkey and Armenia.
that were predicted in our model but not previously recorded, endorsing the good performance of the model.
The ROC plots indicated high average AUCs and low SD of AUC and omission error, reflecting the high predictive performance of our ENMs. Average AUCs for cross-validated general model and baseline climate change model was 0.969 and 0.981, respectively, where the low SD of AUCs and average omission error of the models reflected high precision (Table 2).
Fig 1. Predicted suitable and unsuitable habitats forMontivipera raddeispecies complex in Iran, Turkey and Armenia.The model includes all eco-geographic variables and was reclassified into 10 equal probability classes in which red colour shows areas with the highest probability of occurrence. Newly confirmed localities of the species are indicated with blue dots.
doi:10.1371/journal.pone.0138087.g001
Table 2. Discrimination capacity and classification accuracy criteria for cross-validated Maxent mod-els ofMontivipera raddeispecies complex in Iran, Turkey and Armenia used for evaluating the perfor-mance of Ecological Niche Models (ENMs).Mean omission error refers to maximum training sensitivity plus specificity logistic threshold.
Model Mean test AUC SD of AUC Mean omission error
General model 0.969 0.015 0.054
Baseline climate change model 0.981 0.009 0.057
Analysis of overlap with protected areas
An overlay of the distribution map resulted from general modeling with the map of national protected areas of Iran, Turkey and Armenia indicated that 7.74% of suitable areas (with a probability of 0.33–0.66) and 2.19% of highly suitable areas (with a probability of 0.66–1) are protected by the existing protected area network.
Main variables in the MRC distribution model
Based on results from the general model, distribution of the threatened MRC is largely deter-mined by bioclimatic variables rather than biophysical variables. The jackknife analysis revealed that, based on the difference between regularized gains of variables, annual mean perature, minimum and mean temperature of past hibernation period (May), minimum tem-perature of coldest month and distance to mosaic grassland (50–70%) / shrubland or forest were the most informative explanatory variables affecting the distribution of MRC in highland territories of the study area. However, the relative contributions of the eco-geographical vari-ables to the general model (S1 Table) indicated that altitude (17.1%), distance to closed to open shrubland (16.6%), minimum temperature of past hibernation period (May) (14.4%), annual mean temperature (14.3%) and distance to mosaic grassland (50–70% cover) / shrubland or forest (10.5%) were the most determinant factors.
The importance of bioclimatic variables under climate change scenarios indicated that ther-mal tolerance is more limiting for MRC distribution than humidity. We found that annual mean temperature was the most important climatic variable followed by minimum tempera-ture of the coldest month, annual precipitation and maximum temperatempera-ture of the warmest month.
MRC distribution under climate change
According to the results of the climate change models, the predicted past, current and future ranges of habitat of MRC are likely to be negatively affected by climate change scenarios (Fig 2). We found that, from the past to the future, MRC have experienced notable declines in the area of suitable habitats. With the expansion of unsuitable and less suitable climatic niches (probability class of 0–0.33) from 93.12% to 95.69% of the whole study area, the highly suitable climatic niche (probability class of 0.33–0.66) will be narrowed with accordance to future cli-mate conditions (Table 3).
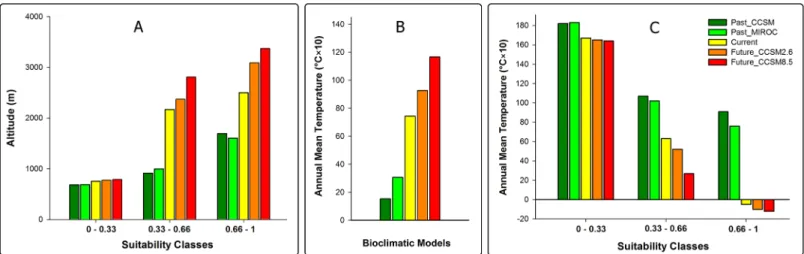
After confirming changes in the bioclimatic niche of MRC, we tested our hypothesis of upward altitudinal shift by tracing the changes of average altitude within probability classes of climatic niche models. As we expected, our results revealed that average altitude within proba-bility classes is higher for future scenarios in comparison with past and current conditions (Fig 3A). By comparing the mean annual temperature of accessible habitats we also found that under climate change scenarios, background space for MRC will shift from cool climate condi-tions to warmer condicondi-tions from the past to the future (Fig 3B) in concordance with the expected influence of global warming. However, under climate change scenarios modeling, our models revealed that MRC will experience a climate niche shift from warmer to colder condi-tions from the past to the future (Fig 3C).
Discussion
Present distribution
Fig 2. Predicted distribution models ofMontivipera raddeispecies complex in Iran, Turkey and Armenia.Models are based on the CCSM (a) and MIROC (b) for the past, present condition (c), and 2.6 (d) and 8.5 (e) scenarios of CCSM that describe mitigation and high emission scenarios of future anthropogenic climate change, respectively. Red colour shows areas with higher probability of occurrence. MESS encompasses non-analogous climate conditions with reference to the training background range of the baseline model.
had initially hypothesized, our results showed that there are various unidentified populations ofMontiviperaspecies across the Zagros, Alborz and Kopet Dagh Mountains in Iran and Ara-rat and lesser Caucasus mountains in Turkey and Armenia. Currently, Lar National Park in central Alborz, home toMontivipera latifii[15], is the westernmost established occurrence location of MRC [12]. However, our model indicated that Kopet Dagh Mountains in the north-east of Iran, some 700 km away from Lar National Park, contain suitable habitats for this spe-cies complex. Although this could be due to modeling weakness, we think it is possible that MRC populations occur in this region, but have not been identified due to poor sampling. Con-firming the occurrence of new populations within the locations predicted by the model requires intensive field work. In fact, our visits to two of these habitat patches (Alvand and Bozgoush regions in the west and northwest of Iran, respectively) resulted in sighting MRC individuals and thus confirming the model’s predictive power. Some individuals found in the newly identi-fied localities showed distinctive morphological characteristics, indicating that MRC popula-tions have undergone unique local adaptapopula-tions.
As expected, historical biogeography of MRC plays a major role in defining the current dis-tribution of this species complex, with altitude identified as the variable that best explains the patchy distribution pattern. In general, apart from topographic and climatic variables, vegeta-tion-related factors contributed substantially to explaining the current distribution of MRC. Vegetation preferred by MRC is mostly monotonous vegetation of pastures above tree-line and artificial forests in mountains [11] as indicated in our analyzes.
Table 3. Percentage cover of climate-only models within the probability classes for the distribution ofMontivipera raddeispecies complex in Iran, Turkey and Armenia.
Probability classes Past_CCSM Past_MIROC Current Future_2.6 Future_8.5
0–0.33 77.12 77.75 92.66 96.69 97. 06
0.33–0.66 14.25 15.17 4.74 2.31 2.10
0.66–1 8.62 6.92 2.6 1 0.84
doi:10.1371/journal.pone.0138087.t003
Fig 3. Altitudinal distribution ofMontivipera raddeispecies complex habitats in the past, present and future (A). Annual mean temperature of accessible habitats forMontivipera raddeispecies complex within different climate niche models (B). Annual mean temperature ofMontivipera raddeispecies complex habitats in the past, present and future (C).Average values were calculated for cells occurring within probability classes of different climate niche models.
Distribution contraction
Montivipera raddeispecies complex has faced continuous habitat contractions throughout its biogeographic history starting from thousands of years ago and continuing well into the future. Modeling the distribution of MRC in the past suggested that the gradual rise in temperature in most of the Iranian plateau after the last Maximal Glacial period [52] forced these species to move to higher altitudes in search for suitable habitats. However our findings reveal that the average temperature of suitable habitats of MRC will be colder in the future compared to the past (Fig 3C). Although this finding seems to contradict the expected influence of climate change, it can be explained as a probable shift in MRC’s habitat and thermal preference. Our findings suggest that in the past, MRC species occupied habitats in lower elevations, even in the bottom of valleys. At that time the higher elevations of the mountains were mostly covered in ice and snow. After the Last Glacial Maximum however, when temperatures increased in MRC's habitat, these species were bound to move to higher elevations (Fig 3A) to seek new habitats. This was in fact their only choice in order to survive. Our niche modeling indicates that although the overall average temperature of the Earth was rising, the local temperature in the new habitats of MRC located in higher elevation was probably lower than MRC’s previous habitats. In a 21000-year time frame, these vipers were able to adapt their thermal preference with the new thermal conditions. This finding is in concordance with the findings of Araujo et al. who stated“evolution of tolerances of terrestrial organisms to cold temperature should be more frequent than the evolution of high temperatures”[53].The upward shift in distribution of MRC has leads to a reduction in the total area of suitable habitat (Table 3), consequently iso-lating the populations in an even more severe patchy distribution (Fig 2).
Although our results clearly indicate that the present distribution of MRC can be related to the response of these species to climate change in the last 21000 years and that alterations in their niche is a response to the general trend of climate change, other factors could have con-tributed to the movement of these species from lowlands to high elevations. A possible alterna-tive explanation for the upward shift from warmer to colder habitats is competition with other species such asMacrovipera lebetinathat occupy lower elevations within the distribution range of MRC. It has been proposed that the presence of this species may have led to upward move-ment of MRC species [30]. Evidence supporting this hypothesis is provided by the geographic distribution and parapatric occurrence ofMacroviperaandMontiviperain much of their range, but locally, as in parts of Armenia and eastern Turkey,Macrovipera lebetinaand MRC are sympatric from 1200 m up to 2000 m asl. [11].
A second alternative explanation concerns anthropogenic activities in the lowland that could have caused local extinctions in MRC populations, leading the remaining populations to move to higher elevations, consequently causing their climatic niche to become colder than the past. However, not all lowland habitats at the distribution range of MRC have experienced alterations by human activities such as agriculture, ruling out this explanation as a prevalent cause of shift in MRC habitat suitability. Some important regions in distribution of MRC with unaltered lowland habitats include Amir-Abad (Takab), Lar National Park and Makoo in Iran and Khosrov and Shikahokh forest reserves in Armenia. The most important anthropogenic effects on MRC are in fact taking a toll on the species today. Illegal collection and overgrazing in the current distribution range takes place in the high elevations and can threaten long-term survival of these species.
altitudinal contractions in the distribution of mountain-dwelling reptiles have been established before (see Results in [57]) and the models that we developed verified our hypothesis that this is also true for MRC. Moreover, the possible reduction in the area of suitable habitats for MRC will lead to the local extinction of populations, leading to a loss of genetic diversity in these spe-cies, similar to what Rödder and Schulte [58] have predicted forLacerta schreiberi.
Integrating molecular studies with ecological niche modeling allows for better understand-ing the evolutionary scenarios and responses of these species to climate change [59]. We sug-gest further researches on habitat shifts in MRC to focus on molecular studies to complement the results of the niche modeling achieved in the present study.
Conservation biogeography
Overlapping the distribution map for MRC with the network of protected areas in the region showed that 10% of suitable habitats are being protected. This seems to be an acceptable cover-age of the distribution range for these species. It must be noted that due to the cryptic nature of MRC, their presence in many of the protected areas in the region is not yet known. Communi-cating our results with the managers of such protected areas will play an important role in the conservation of these species. After confirming the presence of MRC populations within their managed areas, protected area managers will then be able to consider the critical habitats of these species within their management planning.
It is of paramount importance for the conservation of MRC to adopt an adaptive approach to reconsider the network of protected areas in the region. Establishing additional reserves based on suitable habitats identified in our models can considerably increase the effectiveness of MRC conservation. Moreover, according to the distribution pattern of reptiles in the moun-tainous zones of the Iranian plateau, the suitable habitats that we identified overlap with the distribution of syntopic species such asIranolacertagenus [10] which are endemic to Iran. Conservation of the suitable MRC habitats will therefore yield positive outcomes for the con-servation of other groups of reptiles as well.
Establishment of new protected areas, although necessary, will not ensure the viability of MRC populations, unless effective management would be practiced. The vegetative structure of MRC habitats makes them attractive to nomadic herders, exposing these valuable habitats to overgrazing [11]. Such human-caused habitat destruction exacerbates the deleterious effects of climate change [60]. Moreover, presence of herders and tourists in these habitats brings MRC in danger of illegal collection or killing. Therefore, apart from ensuring legal protection status for the MRC habitats, it is vital to promote and monitor effective protection of habitats and individuals within these reserves.
Supporting Information
S1 Table. Estimated relative contribution of eco-geographic variables to the general distri-bution model ofMontivipera raddeispecies complex in Iran, Turkey and Armenia, calcu-lated based on Maxent model.
(DOCX)
Acknowledgments
We would like to thank the rangers of the Iran’s Department of Environment for their coopera-tion and support during fieldwork. We are also grateful to Dr. Claudin Montgelard, Dr. Ulrich Joger, and an anonymous reviewer for providing comments on earlier versions of this
Author Contributions
Conceived and designed the experiments: MY MK. Performed the experiments: MY MA PG RB MR MK. Analyzed the data: MA. Contributed reagents/materials/analysis tools: MY MA PG RB MR. Wrote the paper: EN MY MA. Interpreted the results of analysis: MY MA EN.
References
1. Root TL, Price JT, Hall KR, Schneider SH, Rosenzweig C, Pounds JA, et al. (2003) Fingerprints of global warming on wild animals and plants. Nature 421: 57–60. PMID:12511952
2. Parmesan C, Yohe G (2003) A globally coherent fingerprint of climate change impacts across natural systems. Nature 421: 37–42. PMID:12511946
3. Gibbons JW, Scott DE, Ryan TJ, Buhlmann KA, Tuberville TD, Metts BS, et al. (2000) TheGlobal Decline of Reptiles, DéjàVu Amphibians. BioScience 50: 653–666.
4. Araújo MB, Thuiller W, Pearson RG (2006) Climate warming and the decline of amphibians and reptiles in Europe. Journal of biogeography 33: 1712–1728.
5. Brereton R, Bennett S, Mansergh I (1995) Enhanced greenhouse climate change and its potential effect on selected fauna of south-eastern Australia: A trend analysis. Biological Conservation 72: 339– 354.
6. Schneider S, Root T (1998) Climate change. In: Mac MJ, Opler PA, Haecker CE, Doran PD, editors. Status and trends of the nation's biological resources: US Department of the Interior, US Geological Survey Reston,VA. pp. 89–116.
7. Hewitt GM (1999) Post-glacial re-colonization of European biota. Biological Journal of the Linnean Society 68: 87–112.
8. Lesbarrères D (2009) New insight into an old story: the post-glacial recolonization of European biota. Heredity 102: 213.
9. Ehlers J, Gibbard PL (2004) Quaternary Glaciations-Extent and Chronology, Part III: South America, Asia, Africa, Australia, Antarctica. Amsterdam: Elsevier.
10. Ahmadzadeh F, Carretero MA, Rödder D, Harris DJ, Freitas SN, Perera A, et al. (2013) Inferring the effects of past climate fluctuations on the distribution pattern ofIranolacerta(Reptilia, Lacertidae): Evi-dence from mitochondrial DNA and species distribution models. Zoologischer Anzeiger-A Journal of Comparative Zoology 252: 141–148.
11. Rajabizadeh M, Nilson G, Kami HG (2011) A New Species of Mountain Viper (Ophidia: Viperidae) from the Central Zagros Mountains, Iran. Russian Journal of Herpetology 18: 235–240.
12. Latifi M (2000) The snakes of Iran, 3rd edn. Department of Environment, Tehran [in Farsi]. 13. IUCN (2013) IUCN Red List of Threatened Species. Version 2013.2.
14. Rajabizadeh M (2013) Biodiversity of the snakes in sorthern and western mountains of Iran, with spe-cial emphasis on biodiversity in colubroids [Doctoral dissertation]. Ghent, Belgium: Ghent University. 15. Mertens R, Darevsky IS, Klemmer K (1967)Vipera latifii, eine neue Giftschlange aus dem Iran.
Senck-enbergiana biologica, Frankfurt am Main 48: 161–168.
16. Boettger O (1890) Eine neue Viper aus Armenien. Proceedings of the Zoological Society of London 314: 424.
17. Nilson G, Andren C (1985) Systematics of theVipera xanthinacomplex (Reptilia: Viperidae). I. A new Iranian viper in the raddei species-group. Amphibia-reptilia 6: 207–214.
18. Nilson G (2009)Montivipera latifii. In: IUCN Red List of Threatened Species. Version 2012.2. 19. Behruz R, Rajabizadeh M, kaboli M. Investigation of habitat destruction ofMontivipera latifii(Mertens,
Darevsky and Klemmer,1967) (Reptilia: Viperidae) in Central Alborz, Iran. 15th European Congress of Herpetology; 2009; Kuşadası, Turkey.
20. Kian N, Kaboli M, Karami M, Alizadeh A, Teymurzadeh S, Khalilbeigi N, et al. (2011) Captive Manage-ment and Reproductive Biology of Latifi's Viper (Montivipera latifii) (Squamata: Viperidae) at Razi Insti-tute and Tehran University in Iran. Herpetological Review 42: 535–539.
21. Rajabizadeh M, Kiabi BH, Stumpel N (2007) Taxonomy ofMontivipera raddeispecies group in Iran [Master's thesis]. Tehran, Iran: Shahid Beheshti University.
22. Williams JN, Seo C, Thorne J, Nelson JK, Erwin S, O’Brien JM, et al. (2009) Using species distribution models to predict new occurrences for rare plants. Diversity and Distributions 15: 565–576.
24. Santos X, Brito JC, Sillero N, Pleguezuelos JM, Llorente GA, Fahd S, et al. (2006) Inferring habitat-suit-ability areas with ecological modelling techniques and GIS: A contribution to assess the conservation status of Vipera latastei. Biological Conservation 130: 416–425.
25. Gaston K (1994) Rarity: population and community biology Series, 13. London: Chapman & Hall. 26. Teixeira J, Arntzen J (2002) Potential impact of climate warming on the distribution of the
Golden-striped salamander,Chioglossa lusitanica, on the Iberian Peninsula. Biodiversity and Conservation 11: 2167–2176.
27. Meynecke J-O (2004) Effects of global climate change on geographic distributions of vertebrates in North Queensland. Ecological Modelling 174: 347–357.
28. Penman TD, Pike DA, Webb JK, Shine R (2010) Predicting the impact of climate change on Australia’s most endangered snake,Hoplocephalus bungaroides. Diversity and Distributions 16: 109–118. 29. Ruddiman WF (2000) Earth's Climate: past and future. New York, USA: W. H. Freeman and
Company.
30. Nilson G, Andrén C (1997) Evolution, systematics and biogeography of Palearctic vipers. Symposia of the Zoological Society of London 70: 31–42.
31. Austin M (2007) Species distribution models and ecological theory: a critical assessment and some possible new approaches. Ecological modelling 200: 1–19.
32. Hijmans RJ, Cameron SE, Parra JL, Jones PG, Jarvis A (2005) Very high resolution interpolated cli-mate surfaces for global land areas. International Journal of Climatology 25: 1965–1978.
33. IONIA (2009) Globcover land cover.
34. Kiehl JT, Gent PR (2004) The community climate system model, version 2. Journal of Climate 17: 1666–1669.
35. Hasumi H, Emori S (2004) K-1 coupled GCM (MIROC) description. Center for Climate System Research, University of Tokyo, Tokyo.
36. Moss RH, Edmonds JA, Hibbard KA, Manning MR, Rose SK, van Vuuren DP, et al. (2010) The next generation of scenarios for climate change research and assessment. Nature 463: 747–756. doi:10. 1038/nature08823PMID:20148028
37. Van Vuuren DP, Edmonds J, Kainuma M, Riahi K, Thomson A, Hibbard K, et al. (2011) The representa-tive concentration pathways: an overview. Climatic Change 109: 5–31.
38. Phillips SJ, Anderson RP, Schapire RE (2006) Maximum entropy modeling of species geographic distri-butions. Ecological modelling 190: 231–259.
39. Elith J, Phillips SJ, Hastie T, Dudík M, Chee YE, Yates CJ, et al. (2011) A statistical explanation of Max-Ent for ecologists. Diversity and Distributions 17: 43–57.
40. Phillips SJ, Dudík M (2008) Modeling of species distributions with Maxent: new extensions and a com-prehensive evaluation. Ecography 31: 161–175.
41. Barve N, Barve V, Jiménez-Valverde A, Lira-Noriega A, Maher SP, Peterson AT, et al. (2011) The cru-cial role of the accessible area in ecological niche modeling and species distribution modeling. Ecologi-cal Modelling 222: 1810–1819.
42. Elith J, Kearney M, Phillips S (2010) The art of modelling range-shifting species. Methods in Ecology and Evolution 1: 330–342.
43. Rocchini D, Hortal J, Lengyel S, Lobo JM, Jimenez-Valverde A, Ricotta C, et al. (2011) Accounting for uncertainty when mapping species distributions: the need for maps of ignorance. Progress in Physical Geography 35: 211–226.
44. Fielding AH, Bell JF (1997) A review of methods for the assessment of prediction errors in conservation presence/absence models. Environmental conservation 24: 38–49.
45. Liu C, Berry PM, Dawson TP, Pearson RG (2005) Selecting thresholds of occurrence in the prediction of species distributions. Ecography 28: 385–393.
46. Araújo MB, Lobo JM, Moreno JC (2007) The effectiveness of Iberian protected areas in conserving ter-restrial biodiversity. Conservation Biology 21: 1423–1432. doi:10.1111/j.1523-1739.2007.00827.x PMID:18173466
47. Bergl RA, Oates JF, Fotso R (2007) Distribution and protected area coverage of endemic taxa in West Africa’s Biafran forests and highlands. Biological Conservation 134: 195–208.
48. Parra-Quijano M, Iriondo J, Torres E (2012) Improving representativeness of genebank collections through species distribution models, gap analysis and ecogeographical maps. Biodiversity and Conser-vation 21: 79–96.
50. Chunco AJ, Phimmachak S, Sivongxay N, Stuart BL (2013) Predicting environmental suitability for a rare and threatened species (Lao Newt, Laotriton laoensis) using validated species distribution models. PLOS ONE 8: e59853. doi:10.1371/journal.pone.0059853PMID:23555808
51. Brito JC, Martínez-Freiría F, Sierra P, Sillero N, Tarroso P (2011) Crocodiles in the Sahara Desert: An Update of Distribution, Habitats and Population Status for Conservation Planning in Mauritania. PLOS ONE 6: e14734. doi:10.1371/journal.pone.0014734PMID:21364897
52. Ahmadi H, Feiznia S (2006) Quaternary formations (Aeoretical and Applied Principles in Natural Resources). Tehran, Iran: University of Tehran Press.
53. Araújo MB, Ferri-Yáñez F, Bozinovic F, Marquet PA, Valladares F, Chown SL, et al. (2013) Heat freezes niche evolution. Ecology Letters 16: 1206–1219. doi:10.1111/ele.12155PMID:23869696 54. Lenoir J, Gegout J, Marquet P, De Ruffray P, Brisse H (2008) A significant upward shift in plant species
optimum elevation during the 20th century. Science 320: 1768–1771. doi:10.1126/science.1156831 PMID:18583610
55. Martinez-Meyer E (2005) Climate change and biodiversity: Some considerations in forecasting shifts in species' potential distributions. Biodiversity Informatics 2: 42–55.
56. Walther G-R, Post E, Convey P, Menzel A, Parmesan C, Beebee TJ, et al. (2002) Ecological responses to recent climate change. Nature 416: 389–395. PMID:11919621
57. Pounds JA, Fogden MP, Campbell JH (1999) Biological response to climate change on a tropical mountain. Nature 398: 611–615.
58. Rödder D, Schulte U (2010) Potential loss of genetic variability despite well established network of reserves: the case of the Iberian endemic lizardLacerta schreiberi. Biodiversity and Conservation 19: 2651–2666.
59. Martínez-Freiría F, Argaz H, Fahd S, Brito J (2013) Climate change is predicted to negatively influence Moroccan endemic reptile richness. Implications for conservation in protected areas. Naturwis-senschaften 100: 877–889. doi:10.1007/s00114-013-1088-4PMID:23942550