A Core Filamentation Response Network in
Candida
albicans
Is Restricted to Eight Genes
Ronny Martin1, Daniela Albrecht-Eckardt2, Sascha Brunke3,4, Bernhard Hube3,4,5, Kerstin Hu¨nniger1, Oliver Kurzai1*
1Septomics Research Center, Friedrich Schiller University and Leibniz Institute for Natural Product Research and Infection Biology – Hans Knoell Institute, Jena, Germany, 2BioControl Jena GmbH, Jena, Germany,3Department of Microbial Pathogenicity Mechanisms, Leibniz Institute for Natural Product Research and Infection Biology- Hans Knoell Institute- and Friedrich Schiller University, Jena, Germany,4Center for Sepsis Control and Care, Jena University Hospital, Jena, Germany,5Friedrich Schiller University Jena, Jena, Germany
Abstract
Although morphological plasticity is a central virulence trait ofCandida albicans, the number of filament-associated genes and the interplay of mechanisms regulating their expression remain unknown. By correlation-based network modeling of the transcriptional response to different defined external stimuli for morphogenesis we identified a set of eight genes with highly correlated expression patterns, forming a core filamentation response. This group of genes includedALS3,ECE1, HGT2,HWP1,IHD1andRBT1which are known or supposed to encode for cell- wall associated proteins as well as the Rac1 guanine nucleotide exchange factor encoding geneDCK1and the unknown function open reading frame orf19.2457. The validity of network modeling was confirmed using a dataset of advanced complexity that describes the transcriptional response of C. albicans during epithelial invasion as well as comparing our results with other previously published transcriptome studies. Although the set of core filamentation response genes was quite small, several transcriptional regulators are involved in the control of their expression, depending on the environmental condition.
Citation:Martin R, Albrecht-Eckardt D, Brunke S, Hube B, Hu¨nniger K, et al. (2013) A Core Filamentation Response Network inCandida albicansIs Restricted to Eight Genes. PLoS ONE 8(3): e58613. doi:10.1371/journal.pone.0058613
Editor:Neeraj Chauhan, New Jersey Medical School, University of Medicine and Dentistry of New Jersey, United States of America ReceivedDecember 20, 2012;AcceptedFebruary 5, 2013;PublishedMarch 14, 2013
Copyright:ß2013 Martin et al. This is an open-access article distributed under the terms of the Creative Commons Attribution License, which permits unrestricted use, distribution, and reproduction in any medium, provided the original author and source are credited.
Funding:This work was financed by the German Ministry for Education and Science in the program Unternehmen Region (BMBF 03Z2JN21 to OK). The funders had no role in study design, data collection and analysis, decision to publish or preparation of the manuscript.
Competing Interests:DAE is employed by a company (Biocontrol Jena) specialized in biomathematical services, which has been commissioned for routine analyses of transcriptome data by the Septomics Research Center. This does not alter the authors’ adherence to all the PLOS ONE policies on sharing data and materials.
* E-mail: [email protected]
Introduction
The formation of filaments by Candida albicans is an essential attribute of this species with direct implications for tissue invasion and virulence. An extensive list ofin vitroconditions including pH, temperature, nutrient sources, CO2concentration and serum has
been described to favor growth of C. albicans in either yeast or filamentous morphotype [1,2]. Whereas in early reports filamen-tous forms were described as ‘‘virulent’’ or ‘‘invasive’’ in contrast to the ‘‘commensal’’ yeast morphotype, numerous studies now suggest that morphological plasticity rather than a single morphotype are required during infection. This hypothesis is backed by the observation that mutants locked in either yeast (efg1D/cph1D) or filamentous (tup1D/nrg1D) morphotype show reduced virulence in infection models [3,4]. The central role of the shift towards filamentous growth has been emphasized in studies using mutant strains that retained their switching ability but showed either extended filamentation after derepression ofUME6
from a tet-controlled promotor or induced reversion to yeast morphology due to tet-induced expression of NRG1 [5,6]. Filamentous growth may directly contribute to host damage by invasion of epithelial or dendritic cells [7,8] and modulate the antifungal immune response [9,10]. In addition, among the several genes that have been identified to be expressed in a morphotype dependent manner, ‘‘filament-specific’’ genes and their products
have frequently been characterized as virulence factors. The most prominent examples for this include the adhesin and iron-recruitment protein Als3 [11,12] and the adhesin Hwp1 [13]. However, many other genes described as ‘‘filament-specific’’ have only been studied under selected conditions and the transcriptomic changes associated with filamentation ofC. albicansindependent of the external stimulus have not been fully elucidated.
Two major signal cascades, the cAMP pathway and the MAP kinase cascade and their terminal transcription factors Efg1 and Cph1 control the formation of filaments [14,15,16]. Depending on the external stimulus, other pathways like the pH response cascade may contribute to filamentation, but Efg1 often remains the terminal transcription factor of these pathways [16,17]. Besides activation, derepression is also crucial for the induction of filamentous growth [18]. The major repressor complex consists of the regulator Tup1 and its DNA-binding partner Nrg1 and prevents expression of hyphae-associated genes [4,19,20]. Detach-ment of this complex from target gene promoters is controlled by remodeling of chromatin structures and contributes to filamentous growth [21,22]. Overexpression or constitutive expression of
core filamentation response for this fungal pathogen. Only eight genes were part of a group of genes with highly correlated expression pattern which was up- regulated in hyphae indepen-dent from the environmental condition. Analysis of expression patterns inC. albicansregulatory mutants confirmed that regulation of this core filamentation response is complex and depends on the environmental stimulus.
Results
Filamentous Growth Dynamics inCandida albicans Three well- defined stimuli were used to induce filamentation in stationary phaseC. albicansyeast cells: (i) a shift from pH4 to pH8, (ii) the addition of 10% human AB serum to the medium and (iii) the change of the carbon source from 2% glucose to N-acetylglucosamine (for details see Material and Methods section). Human serum was used to be as close as possible to the natural environment in the human host. In time course experiments, we observed two stages of filamentation for all three shifts, germ tube formation during the first two hours after stimulation followed by hyphal elongation and branching (Figure 1). For transcriptional profiling, filament- inducing conditions were optimized to ensure a maximum comparability of germ tube formation kinetics.
For each condition, 16106 cells/ml from the overnight preculture were transferred into prewarmed medium (at 37uC) which either promoted yeast or hyphal growth. By this, we avoided a temporary shift from 37uC to lower temperatures and back which might delay hyphal development. Using a serum concentration of 10% resulted in kinetics which were most closely related to the pH and GlcNAc shift. For each time point, cells were checked for germ tube formation (Figure 1, 1 h and 2 h) or hyphae with visible septa and/or branches (Figure 1, 3–12 h). Control cultures were checked before RNA isolation for stable yeast morphology.
Serum-induced hyphae reverted to budding filaments and even yeast cells again, whereas reversions were barely detected throughout the observation periods when using the other two protocols (Figure 1, 12 h).
Total RNA was isolated for each of the standardized conditions at five distinct time points (1 h, 2 h, 3 h, 6 h and 12 h) in three independent biological replicates and used for transcriptome analysis. Raw data are available at ArrayExpress (http://www.ebi. ac.uk/arrayexpress/, accession number E-MEXP-3675).
Shift- associated Gene Expression Patterns
To confirm that the three experimental shifts induced specific transcriptional adaptation, overall transcription patterns were analyzed. A total of 704 genes changed their expression in response to pH shift from pH4 to pH8 at the 1 h time point. More than 50% (401 out of 704, Figure 2 A and Table S1) were specific for the pH shift, while 303 genes were also differentially expressed in either the serum or the GlcNAc or both (Figure 2 A). As expected we detected the down- regulation of PHR2, which is known to be expressed at acidic pH [24] and the simultanous up-regulation of PHR1 [25] (Figure 2 B). In addition, the alkaline induced gene PRA1showed an increased expression at 6 h and 12 h (Figure 2 B). In response to the serum shift, 573 genes showed either an up- or a down- regulation at the 1 h time point. Less than half of them (238) were specific for serum- induced germ tubes (Figure 2 A and Table S1).CSA1,DDR48,SAP6andHYR1
were highly up- regulated in serum- stimulated hyphae as reported previously [26,27]. Consistent with reversion to yeast morphology they were no longer expressed or even down- regulated after the hyphae- to yeast reversion at 12 h (Figure 2 C). In total, only 176
genes were differentially expressed 1 h after the carbon source change (Table S1) with 61 genes specific for the GlcNAc shift. Among those were genes associated with uptake and processing of GlcNAc, includingNGT1 (encoding a GlcNac specific transport-er), HXK1 (encoding a GlcNAc- kinase), NAG1 (encoding a Glucosamine-6-phosphate deaminase) andDAC1(encoding a N-acetylglucosamine-6-phosphate deacetylase), which have previous-ly shown to reflect adaptation to GlcNAc [28,29,30] (Figure 2 D). In addition, genesGIG1, GAL1,GAL7 andGAL10were also up-regulated during the GlcNAc shift as shown previously [30,31,32] (Figure 2 D).
Taken together, these analyses clearly show, that each of the three shift induces a highly specific transcriptional adaptation which is predicted to involve several different signaling cascades based on prior knowledge [16].
Transcriptional Landscape Modeling Reveals a Core Filamentation Response Network
For further analyses, we focused on genes which were differentially expressed for all three protocols. For this term, we only took the first 6 hours into account as at the 12 h time point reversion of serum- induced hyphae to yeast cells was observed (Figure 1). For all differentially regulated transcripts we calculated pairwise Pearson correlation coefficients and their significance over all 12 test conditions of the experiment using R software 2.14.1. For visualization, we selected all pairs of transcripts with correlation coefficients larger than 0.75 (all showing a p-value smaller than 0.0013). Visualization was done with Cytoscape 2.8.1 [33] using the edge-weighted spring embedded layout. Based on gene expression correlation, we identified two different networks during the event of germ tube formation. These networks comprise all transcripts that are differentially regulated at 1 h and/or 2 h by all three stimuli. Only genes which were directly linked with each other are shown in the networks. The first network, consisting of down- regulated genes, contains genes that are related to either ribosome function, RNA metabolism or chromatin remodeling and histones (germ-tube formation network [GFN]; Figure 3 B). The central hubs of this network were the C. albicans BRN1
homolog, which encodes a putative condensin I and POL2, encoding DNA polymerase epsilon (Figure 3 B) Interestingly, this network was linked to the first hour of stimulation only, as most of these genes were no longer differentially expressed at later time points. However, some of them were up- regulated at the 12 h time point (Table S1). The second network was character-ized by up- regulated genes which mainly have already been linked to filamentation such as ALS3, ECE1, RBT1 and IHD1
(early filamentation network [EFN], Figure 3 B). Germ tube formation was followed by hyphal elongation, characterized by longer and branching hyphae (Figure 1). In contrast to the earlier stage of hyphal growth, only a single network of up- regulated genes was identified at this stage, which was highly related to the EFN (late filamentation network [LFN], Figure 3 B). The LFN consisted of known hyphae- associated genes including ALS3,
aforementioned networks. The two most prominent examples are
EED1, a regulator of hyphal elongation [35] which was only up-regulated at 6 h (Table S1) and the repressor gene NRG1, the only gene which was down- regulated during hyphal elongation phase in all three shifts (Table S1, 3 h and 6 h). Interestingly, this down- regulation disappeared in serum- stimulated cells during the process of hyphae- to yeast- reversion while it was still down- regulated in pH- and GlcNAc- stimulated hyphae which did not undergo reversion (Table S1, 12 h). A combination of the EFN and the LFN resulted in a minimal set of eight genes which were part of the early filamentation network as well as of the late filamentation network: ALS3, DCK1, ECE1, HGT2, IHD1,
HWP1, RBT1, orf19.2457. All of them could be linked to each other into a network, which was defined as the core filamentation response network (CFR) ofC. albicans(Figure 3 C). This group of
genes was up- regulated in germ tubes and hyphae, indepen-dently from the growth phase as well as the stimulating environmental condition.
IHD1and orf19.2457 are not Essential for Hyphal Development
The genesIHD1and orf19.2457 were central hubs of the core filamentation response network (Figure 3 C). Both not yet characterized ORFs were deleted in a PCR- based gene targeting approach and the resulting homozygous mutants were tested for their ability to develop hyphae or not. Neither the deletion of
IHD1nor orf19.2457 did affect the ability to form hyphae under the tested conditions (Figure 4), indicating none of them is actually required for the yeast to hyphae transition. These findings fit to the fact that previously described mutants lacking CFR genesALS3 Figure 1. Dynamics of filamentous growth inCandida albicans.Cells ofC. albicansSC5314 strain were incubated under filament- inducing conditions in time course experiments for up to 12 h. For pH shift, cells were transferred from a M199 pH4 preculture to M199 pH8. For the other shifts, cells were transferred from a preculture in SDG medium into either SDG with 10% human serum (serum shift) or into SDN medium with 20 g/l N- acetylglucosamine as exclusive carbon source (GlcNAc shift). Note, that precultures were already grown at 37uC over night, so there was no additionally temperature shift effect to stimulate germ tube formation. For later time points, individual hyphae are shown instead of hyphal conglomerates but were identical in average length. Precipitates visible in serum induction regulary occur with human serum, baccterial contaminations were excluded. Scalebar: 20mm.
doi:10.1371/journal.pone.0058613.g001
[36],ECE1[37] andRBT1[38]were still able to form filaments. In contrast, mutants lackingHWP1[39] andDCK1[40,41] displayed defects in hyphal development. No information is available for the effects ofHGT2deletion on filamentation.
Comparison with the Results from Other Transcriptome Studies
To validate our findings, we analyzed the expression of the identified CFR genes in published transcriptome analyzes dealing with filamentation of C. albicans in similar or more complex experimental settings such as the interaction of fungal and human host cells. For that purpose studies using whole genomeC. albicans
expression arrays were identified from PubMed focusing on two groups of datasets: (i) whole- genome approaches dealing with hyphal induction with single, well- defined stimuli such as serum or
cAMP, (ii) transcriptome analyses dealing with more complex conditions during host- pathogen interaction with a clearly defined yeast morphology as starting point and filamentation occurring within the analyzed time-frame. In addition, two recent studies using RNAseq [42] or tiling arrays [43] were included into the analysis.
Wa¨chtler et al. analyzed the transcriptional dynamics of C. albicans during invasion of human oral epithelial cells using the same array as in our analyses [44]. In this study, very early time points of the invasion process (20 and 60 minutes) as well as later time point (180 minutes) were examined. The CFR as defined by our analyses was up- regulated for all time points (Figure 5 A). With only one exception (ADE4), genes of the GFN showed a decreased expression during the early time points 20 and 60 minutes, but were no longer differentially expressed at the later Figure 2. Shift- specific gene expression patterns inCandida albicanshyphae.A summary of the data from the whole genome DNA microarrays used for this study. Genes showing fold changes of at least 1.5 were evaluated for significance (p#0.05) and illustrated in blue for down-regulation and red for up- down-regulation. Genes were marked in yellow as not differentially expressed. (A). Differentially expressed genes for all three shifts at 1 h. (B–D) The expression dynamics of genes closely linked to the pH shift(B), the serum shift (C) or the change of the carbon source from glucose to N- acetylglucosamine (D) are shown. The presented data were taken from the whole genome DNA microarrays used for this study. The fold changes of at least 1.5 were evaluated for significance (p#0.05) and illustrated in blue for down- regulation and red for up- regulation. Genes were marked in yellow as not differentially expressed.
180 time point (Figure 5 A). In addition, all genes of the EFN and LFN except ZDS1 showed strong up-regulation at 60 min post infection(Figure 5 A).
Within the core filamentation response genes, ALS3, ECE1,
HWP1,IHD1andRBT1were mostly found to be up- regulated during the switch from yeast to hyphae in experiments including serum shift, pH shift, cAMP shift, induction via plastic surfaces, biofilms or fungal interaction with oral epithelial cells, blood or caecum cells (Figure 5 B). Fitting best to our findings were the results from a RNA- seq based transcriptional profile of
serum-induced hyphae [42] were all aforementioned CFR genes were up-regulated (Figure 4 B). AsALS3, ECE1,HWP1and RBT1 were long time predicted hyphae- specific genes [16], it was of interest to find out the dynamics of the four additional CFR genes.IHD1
was up- regulated in all analyzed transcriptome studies including an in vivo study with clinical samples from patients with oral candidosis (Figure 5 B) [45].DCK1 was up- regulated in studies analyzing filaments induced by serum [18,42], cAMP [46], contact with plastic surfaces or human oral epithelial cells [35] caecum cells and human blood [43,47], although other studies failed to Figure 3. Transcriptional landscape modeling of Candida albicans hyphae. (A) Based on data from whole genome DNA microarrays, correlation- based networks of gene expression were modeled using the Cytoscape software visualizing the overall transcriptomic response to the three stimuli in the time-course of filamentation. For germ tube formation, only genes which were differentially expressed during 1 h and/or 2 h in all three shifts were used for modeling and only those which were linked directly to each other with high correlation ($0,75) were integrated into the networks, leading to the identification of an upregulated set of early filamentation genes (early filamentation network EFN, B) and a group of genes downregulated during induction of filamentation (germ-tube formation network GFN, B). The same modeling was performed for hyphal elongation with genes which were differentially expressed at 3 h and 6 h in all three shifts, resulting in the description of a single network of upregulated genes (late filamentation network, LFN, B). (C) Integration of the time-point networks defined the core filamentation response consisting of a network of eight genes showing highly correlated expression patterns.
doi:10.1371/journal.pone.0058613.g003
detect a differential expression of this gene (Figure 5 B).DCK1was clearly up- regulated in our study of alkaline- induced hyphae, but not in a previous one [48] (Figure 5 B).In contrast to the other CFR genes,HGT2was only found to up- regulated in one serum study [42] and caecum cells [43], but interestingly also in patients suffering from oral candidosis [45]. In another study, however,
HGT2 was down- regulated in serum- induced hyphae [18] (Figure 5 B).
Regulation of CFR Genes
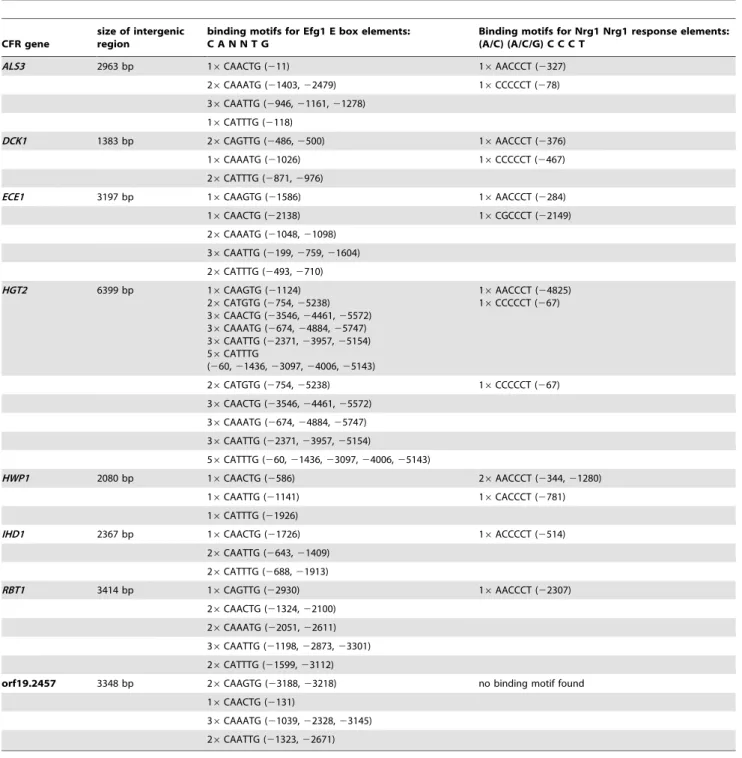
Except for DCK1, all of the CFR genes are characterized by large 59 intergenic regions before the open reading frames with sizes between 2 kb and 6 kb (Table 1). On average, 59intergenic regions including promoters inC. albicansare 500 to 1000 bp [49]. Argimon et al. have previously suggested that 59intergenic regions of hyphae- specific genes are unusually long compared to C.
albicansgenes in general [50]. All of the CFR promoters contained putative binding motifs for transcription factor Efg1 and with the only exception orf19.2457 they also contained Nrg1 response elements (Table 1). Based on these in silico observations, the expression of the CFR genes was analyzed in non- filamentous mutants lacking EFG1(efg1D and cph1D/efg1D) and the hyperfi-lamentous nrg1D mutant. Additionally, we tested the rim101D mutant, which formed wild type- like filaments during the serum and GlcNAc shift, but not after the change from pH4 to pH8. An increased expression of the CFR genes was observed in the wild type after 3 h hyphal growth in all three shifts (Figure 6). Interestingly, ECE1, HWP1, HGT2 and IHD1 were strongly expressed inefg1Dand partially incph1D/efg1Dbut not inrim101D during the pH shift, suggesting that Rim101 is more important for the regulation of these genes under pH inducing conditions than Efg1 (Figure 6). For the two other protocols, there was no Figure 4. Deletion ofIHD1and orf19.2457 did not affect filamentous growth.Cells of the C. albicans wild type strain SC5314 and mutants
ihd1Dand orf19.2457Dwere transferred from an overnight preculture in M199 pH4 grown at 37uC to M199 pH8 and incubated for 2 h or 6 h prior to microscopy. For hyphal growth on solid media in either plates with 20 g/l N-acetylglucosamine as sole carbon source or chocolate agar, 16106cells/
ml from a preculture grown in SDG minimal medium at 37uC overnight, were dropped onto plates and incubated for 2 or 3 days prior to photography. Scalebar: 20mm.
induction of CFR genes in thecph1D/efg1Ddouble mutant. The results suggest an impact of Cph1 on the regulation of bothECE1
and HWP1, as there was still an increase of expression of these genes in efg1D, but not in cph1D/efg1D (Figure 6). In the filamentousnrg1Dmutant, the basic level of CFR gene expression was higher than in wild type and therefore the increase of expression was often not significant. However, some genes were still strongly induced in this mutant in response to filament inducing conditions, such asECE1during serum shift, indicating that a combination of derepression and activation contributes to the high levels of expression (Figure 6).
Discussion
Many different stimuli can induce filamentous growth of C. albicans and a lot of protocolls were used to trigger the morphological change from unicellular yeasts into germ tubes and later hyphae [16]. For this study, we have chosen three well-defined stimuli which require change of only one condition compared to yeast-promoting media. In addition, all three shifts could be performed at a temperature of 37uC which reflects temperature in the natural human habitat ofC. albicans. Dilution of stationary phase culture has previously been described to result in the formation of germ-tubes due to the release of quorum-sensing induced inhibition of filamentation [51]. However, in our experiments, control conditions favoring yeast growth were diluted in an identical way as experimental conditions and no induction of filamentation was observed. In contrast to the aforementioned
study [51] we have not used YPD with a neutral pH as preculture and medium for yeast- like growth which might explain the absence of a quorum- sensing effect. In concordance with a trigger-specific induction of filamentation. C. albicans responded differently to each of the three shifts leading to gene expression pattern which were characteristic for each shift (Figure 2). Of the three shifts we used, human serum was the one where hyphae to yeast reversion occurred at the earliest time point (between 6 and 12 h), whereas this process was barely detected for the other two shifts in the 12 h time course (Figure 1).
A combination of classical transcriptome analysis tools with network modeling led to the identification of a surprisingly small core filamentation response (CFR) in C. albicans which is differentially regulated during the formation of hyphae indepen-dent of the external stimulus. The algorithms employed for network modeling have originally been developed to analyze and visualize large datasets for protein-protein or protein-DNA interaction together with mRNA quantification [52] In the correlation- based networks used for analysis of large-scale transcriptome data in this study, the algorithm allows a clustering of co-regulated genes and – in the setting of different input conditions leading to an identical response (in this case filamenta-tion) – the definition of core gene sets that are directly related to the response and independent of the input condition. Using this approach, only eight genes fulfilled the criteria for a core filamentation response: ALS3, DCK1, ECE1, HGT2, HWP1,
IHD1, RBT1 and orf19.2457. These genes constitute a core filamentation network of co-regulated genes. ALS3, ECE1 and Figure 5. Expression pattern of the core filamentation response genes in selected transcriptome studies.Transcriptional data from selected studies were analyzed for information about the eight core filamentation response network genes. As different technologies and normalization pattern were used, it is only possible to provide information about up (red)- or down- regulation (blue) or a no change of expression (yellow) of the indicated genes. The open reading frame orf19.2457 was partially not part of the microarray design in some studies and were marked absent (black). (A) Expression dynamics for the genes of the early and late filamentation networks as well as of the germ tube formation network during the invasion of human oral epithelial cells (TR146 cell line) withC. albicanswild type SC5314. The dataset were taken from the study of Wa¨chtler and coworkers [44]. (B) Expression dynamics for the core filamentation response genes in different transcriptome studies covering more hyphae- inducing conditions thant those which were used in this study.
doi:10.1371/journal.pone.0058613.g005
HWP1 have long been considered prototypic hyphal associated genes and their identification confirms the validity of our approach [16]. All of those encode for cell-wall/cell-membrane proteins, which is also true forDCK1,HGT2,IHD1andRBT1according to published data or sequence based predictions. Only the protein encoded by orf19.2457 may have no surface localization based on
in silicoanalyses and nothing is known about its function. Hardly any information is available for HGT2, a gene homologous to the high-affinity glucose transporter HGT1. However, the gene is located next to a cluster containing also the galactose metabolism genes GAL10, GAL7 and GAL1 [53],
although it is separated from the other three genes by a very large intergenic region [54]. These genes share similar or equal motifs in their promotor regions suggesting a regulatory function of the transcription factor Cph1 [53]. However, the expression dynamics were quite different. While theGALgenes were very specific for the GlcNAc shift (Figure 2 D, Table S1),HGT2was up- regulated in all three shifts for the majority of time points (Table S1). Therefore, its expression seems to be separately regulated from the
GAL genes and is at least under pH8 inducing conditions independent from Cph1 (Figure 6).
Table 1.In silicopromoter analysis of core filamentation response genes.
CFR gene
size of intergenic region
binding motifs for Efg1 E box elements: C A N N T G
Binding motifs for Nrg1 Nrg1 response elements: (A/C) (A/C/G) C C C T
ALS3 2963 bp 16CAACTG (211) 16AACCCT (2327)
26CAAATG (21403,22479) 16CCCCCT (278) 36CAATTG (2946,21161,21278)
16CATTTG (2118)
DCK1 1383 bp 26CAGTTG (2486,2500) 16AACCCT (2376) 16CAAATG (21026) 16CCCCCT (2467)
26CATTTG (2871,2976)
ECE1 3197 bp 16CAAGTG (21586) 16AACCCT (2284)
16CAACTG (22138) 16CGCCCT (22149)
26CAAATG (21048,21098)
36CAATTG (2199,2759,21604) 26CATTTG (2493,2710) HGT2 6399 bp 16CAAGTG (21124)
26CATGTG (2754,25238) 36CAACTG (23546,24461,25572) 36CAAATG (2674,24884,25747)
36CAATTG (22371,23957,25154) 56CATTTG
(260,21436,23097,24006,25143)
16AACCCT (24825)
16CCCCCT (267)
26CATGTG (2754,25238) 16CCCCCT (267) 36CAACTG (23546,24461,25572)
36CAAATG (2674,24884,25747)
36CAATTG (22371,23957,25154)
56CATTTG (260,21436,23097,24006,25143)
HWP1 2080 bp 16CAACTG (2586) 26AACCCT (2344,21280) 16CAATTG (21141) 16CACCCT (2781)
16CATTTG (21926)
IHD1 2367 bp 16CAACTG (21726) 16ACCCCT (2514)
26CAATTG (2643,21409)
26CATTTG (2688,21913)
RBT1 3414 bp 16CAGTTG (22930) 16AACCCT (22307)
26CAACTG (21324,22100)
26CAAATG (22051,22611) 36CAATTG (21198,22873,23301) 26CATTTG (21599,23112)
orf19.2457 3348 bp 26CAAGTG (23188,23218) no binding motif found 16CAACTG (2131)
36CAAATG (21039,22328,23145)
26CAATTG (21323,22671)
The central hub of the core filamentation response network is the geneIHD1. The function of the encoded protein is unknown so far, although it might be GPI- anchored and therefore should localize on the fungal surface. Previously, IHD1 has been described as a hyphal induced for serum and temperature triggered filamentation [55]. Rbt1 is an adhesin related to Hwp1 and has been involved in mating and biofilm formation [56]. Dck1, a guanine nucleotide exchange factor for the Rac1 GTPase, is dispensable for serum-induced filamentation but required for matrix-embedded induced filamentous growth, a condition that was not tested in our study [41]. Our data indicate that Dck1-Rac1 may have a stimulus independent function in filamentation. AsRAC1itself was not differentially expressed, this might suggest a Rac1- independent function of Dck1. Based on our data,DCK1
andHWP1are the only genes in the core filamention response that are necessary for filamentation at least in certain conditions [39,41] while all other CFR network genes are effectors of a filamentation rather than being required for this morphological process. This is also reflected by the fact that well known regulators of filamentation includingEFG1,HGC1,UME6,CPH1and many others are not part of the CFR.
According to several transcriptome studies from the past decade and to the list of hyphae- induced genes which was published by Sudbery [16], genes likeDDR48,HYR1,SAP4-6andSOD5might have been expected to be part of the core filamentation response. However, none of these genes was included due to the fact that
they were up- regulated in one or two filament- inducing shifts but not simultaneously in all three shifts. All of them were up-regulated during the serum shift and partially the pH (DDR48,
SOD5) or the GlcNAc shift (HYR1andSAP6).DDR48,HYR1and
SOD5 were however not differentially expressed or even down-regulated after serum- induced hyphae reverted to yeasts at the 12 h time point (Table S1). Taken together, these four genes are associated to the filamentation response in a broader meaning, but they are not as stimulus-independent as the aforementioned core filamentation response genes.
Validation of the CFR network with data from other experimental settings confirms that it defines a minimum number of genes which can be used to assess morphogenesis in most if not all experimental settings. This is of potential interest for several applications: Using transcriptional quantification of these genes, newly generated mutants defective in morphogenesis can easily be tested for an expression pattern that resembles yeast or hyphal morphology, aiding in the identification of mutants displaying a dissociation of phenotype from transcriptional pattern as described for theC. albicansDhgc1mutant [57]. Similarily, quantification of genes regulated during early morphogenesis could assist in further elucidating the role of filamentation in interaction of C. albicans
with immune cells by providing a tool for early detection of a switch towards filamentation in the transcriptional program.
Despite the low number of CFR genes, the regulation of these genes is apparently complex. Quantification of CFR expression in Figure 6. Regulation of core filamentation response gene expression.Mutants lacking the transcriptional regulators Efg1, Cph1, Rim101 and Nrg1 were grown for 3 h at 37uC (pH shift: from pH4 to pH8, serum shift: addition of 10% human serum, GlcNAc shift: N- acetylglucosamine as carbon source). Expression of the eight core filamentation response genes was analyzed by quantitative RT PCR in three independent experiments and gene expression was normalized against the housekeeping geneACT1(actin) and a common reference (wild type, 6 h in YPD at 37uC). To calculate the fold change of expression, relative gene expression of hyphae- inducing conditions (e.g. pH8) were compared to yeast promoting conditions (e.g. pH4). The illustrated fold changes were evaluated for significance (p#0.05, student’s t test).
doi:10.1371/journal.pone.0058613.g006
several regulator mutants suggested that CFR expression is governed by overlapping and at least partially redundant molecular mechanisms. In addition, whereas regulation of the CFR genes occurs independent of the external stimulus for filamentation, the regulatory mechanisms leading to induction differ between the stimuli, suggesting that stimulus-dependent contributions of several regulators rather than a universal master regulator govern CFR expression. A prominent example for this is the fact, that Rim101 is absolutely required for induction of all CFR genes in pH-shift induced filamentation, whereas it is dispensable in the other conditions.
Furthermore, the identification of the GFN which is specifically downregulated during the very early phase of hyphal development is consistent with the involvement of chromatin modification in the regulatory processes. Modification of histone proteins has shown to be involved in regulation of morphogenesis [58] and it was recently shown that chromatin remodeling plays an important role in allowing Nrg1 to get access to its target DNA sequences [21,22]. In summary, we could show that correlation-based modeling of transcriptional analyses has proven useful to identify a core set of marker-genes characteristic for the important biological process of filamentation inC. albicans. Therefore, correlation- based network modeling might be suitable tool for further analyses of other processes inC. albicans.
Materials and Methods
Strains, Media and Growth Conditions
AllC. albicans strains used in this study are listed in Table 2. Strains were routinely grown at 37uC in either M199 medium (9.8 g/l M199 powder, PAA; 35.7 g/l HEPES, 2.2 g/l sodium carbonate; adjusted to different pH values with either sodium hydroxide or hydrochloride acid) with pH4 or SDG medium (6.7 g/l YNB without amino acids, DIFCO, 20 g/l glucose). For hyphal induction, 16106 cells/ml were transferred from a stationary phase culture in M199 pH4 to M199pH8 (‘‘pH shift’’) or from a stationary phase culture in SDG to SDG with 10% human serum (PAA, ‘‘serum shift’’) or SDN (6.7 g/l YNB without amino acids, DIFCO, 20 g/l N- acetlyglucosamine, ‘‘GlcNAc shift’’). Cells were then incubated at 37uC for a total of 12 h.
Construction ofC. albicansMutants
The genes GIT2, IHD1, orf19.1344 and orf19.2457 were deleted in the background strain SN87 [59] which is auxotrophic
for histidine and leucine. Gene deletions were performed with a PCR- based strategy using the plasmids CdHIS1 and pFA-CmLEU2 [60]. Transformations of C. albicans strains were performed with the established lithium- acetate method [61].
Microscopy
Routinely, cells were analyzed by DIC microscopy, which was performed on a Zeiss AxioObserver Z.1 (Carl Zeiss, Go¨ttingen and Jena, Germany).
Transcriptome Analysis
Total fungal RNA was isolated by a hot phenol- chloroform method previously described in more detail [35]. Quality and quantity of the RNA were checked by Agilent Bioanalyzer 2100 (Agilent Technologies). For whole genome expression studies, sample RNA was labeled with Cy5-CTP and hybridized with a Cy3- labeled common reference RNA on C. albicans DNA microarrays (ClinEuroDiag, Brussels, Belgium). Slides were hybridized, washed and scanned with a Genepix 4000B (Molec-ular Devices) as described previously [62]. After quality control, arrays were preprocessed using R software version 2.14.1 (http:// www.r-project.org). Printtiploess and Gquantile methods were used for normalization. A linear model was fit to the normalized data. Transcripts were regarded as being significantly differentially expressed when they showed an absolute fold change of larger than 1.5 and an FDR adjusted t-test p-value of less than 0.05. Raw data of the microarrays are available at ArrayExpress (http:// www.ebi.ac.uk/arrayexpress/) with the accession number E-MEXP-3675 for wild type arrays.
Network Modeling
For all significant differentially regulated transcripts we calcu-lated pairwise Pearson correlation coefficients and their signifi-cance over all 15 test conditions of the experiment using R software 2.14.1. For visualization, we selected all pairs of transcripts with correlation coefficients larger than 0.75 (all showing a p-value smaller than 0.0013). Visualization was done with Cytoscape 2.8.1 [33] using the edge-weighted spring embedded layout.
Determination of Gene Expression Levels
Quantitative RT PCR was performed using the Brilliant III Ultra Fast SYBR Green qRT PCR Kit (Agilent Technologies) on
Table 2.C. albicansstrains used in this study.
strain name Genotype source
SC5314 wild type [64]
SN87 leu2D/leu2D, his1D/his1D, URA3/ura3D::imm434, IRO1/iro1D::imm434 [59]
tup1D tup1::hisG/tup1::hisG, RPS10/rps10::CIp10-URA3 [35]
nrg1D nrg1::hisG/nrg1::hisG,RPS10/rps10::CIp10-URA3 [35]
efg1D efg1::hisG/efg1::hisG-URA3-hisG [3]
cph1D/efg1D cph1::hisG/cph1::hisG/efg::hisG/efg1::hisG-URA3-hisG [3]
rim101D rim101::hisG/rim101::hisG-URA3-hisG [65]
IHD1/ihd1 SN87,IHD1/ihd1::CmLEU2 this work
ihd1D SN87,ihd1::CmLEU2/ihd1::CdHIS1 this work
2457/2457D SN87,19.2457/19.2457::CmLEU2 this work
2457D SN87,19.2457::CmLEU2/19.2457::CdHIS1 this work
a Stratagene Mx3005P (Agilent Technologies) with 100 ng/ml
RNA as template. To determine the fold changes of gene expression we used theDDCt method [63]. Gene expression was normalized against ACT1 as housekeeping gene and the aforementioned common reference RNA as control.
Supporting Information
Table S1 Differentially expressed genes during filamentous growth induced by different stimuli. All genes listed in the tables were differentially expressed ($1.5 fold with p#0.05) in at least one condition at one time point. If a gene was differentially expressed in more than one condition, it is listed in the conditions column with "HS_SDG & pH8–pH4". HS_SDG means that the gene is differentially expressed in serum- treated cells (HS for human serum) compared to control cells grown in SDG medium. SDN_SDG means that the gene is differentially expressed in
GlcNAc- treated cells (SDN for medium with GlcNAc as carbon source) compared to control cells grown in SDG. pH8_pH4 means that the gene is differentially expressed in cells grown in M199 medium with pH8 compared to those grown in M199 medium with pH4.
(XLS)
Acknowledgments
We thank Cindy Bu¨chner for excellent technical assistance. We are thankful to Gerald Fink, Alexander Johnson, Alistair Brown, Fritz Mu¨hlschlegel and William Fonzi for kindly providingC. albicansstrains.
Author Contributions
Conceived and designed the experiments: RM OK. Performed the experiments: RM. Analyzed the data: RM DAE KH OK. Contributed reagents/materials/analysis tools: SB BH. Wrote the paper: RM OK.
References
1. Buffo J, Herman MA, Soll DR (1984) A characterization of pH-regulated dimorphism in Candida albicans. Mycopathologia 85: 21–30.
2. Sims W (1986) Effect of carbon dioxide on the growth and form of Candida albicans. J Med Microbiol 22: 203–208.
3. Lo HJ, Kohler JR, DiDomenico B, Loebenberg D, Cacciapuoti A, et al. (1997) Nonfilamentous C. albicans mutants are avirulent. Cell 90: 939–949. 4. Murad AM, Leng P, Straffon M, Wishart J, Macaskill S, et al. (2001) NRG1
represses yeast-hypha morphogenesis and hypha-specific gene expression in Candida albicans. EMBO J 20: 4742–4752.
5. Saville SP, Lazzell AL, Monteagudo C, Lopez-Ribot JL (2003) Engineered control of cell morphology in vivo reveals distinct roles for yeast and filamentous forms of Candida albicans during infection. Eukaryot Cell 2: 1053–1060. 6. Carlisle PL, Banerjee M, Lazzell A, Monteagudo C, Lopez-Ribot JL, et al.
(2009) Expression levels of a filament-specific transcriptional regulator are sufficient to determine Candida albicans morphology and virulence. Proc Natl Acad Sci U S A 106: 599–604.
7. Kurzai O, Schmitt C, Brocker E, Frosch M, Kolb-Maurer A (2005) Polymorphism of Candida albicans is a major factor in the interaction with human dendritic cells. Int J Med Microbiol 295: 121–127.
8. Dalle F, Wachtler B, L’Ollivier C, Holland G, Bannert N, et al. (2010) Cellular interactions of Candida albicans with human oral epithelial cells and enterocytes. Cell Microbiol 12: 248–271.
9. Wheeler RT, Kombe D, Agarwala SD, Fink GR (2008) Dynamic, morphotype-specific Candida albicans beta-glucan exposure during infection and drug treatment. PLoS Pathog 4: e1000227.
10. Wozniok I, Hornbach A, Schmitt C, Frosch M, Einsele H, et al. (2008) Induction of ERK-kinase signalling triggers morphotype-specific killing of Candida albicans filaments by human neutrophils. Cell Microbiol 10: 807–820. 11. Phan QT, Myers CL, Fu Y, Sheppard DC, Yeaman MR, et al. (2007) Als3 is a Candida albicans invasin that binds to cadherins and induces endocytosis by host cells. PLoS Biol 5: e64.
12. Almeida RS, Brunke S, Albrecht A, Thewes S, Laue M, et al. (2008) the hyphal-associated adhesin and invasin Als3 of Candida albicans mediates iron acquisition from host ferritin. PLoS Pathog 4: e1000217.
13. Staab JF, Bradway SD, Fidel PL, Sundstrom P (1999) Adhesive and mammalian transglutaminase substrate properties of Candida albicans Hwp1. Science 283: 1535–1538.
14. Liu H, Kohler J, Fink GR (1994) Suppression of hyphal formation in Candida albicans by mutation of a STE12 homolog. Science 266: 1723–1726. 15. Stoldt VR, Sonneborn A, Leuker CE, Ernst JF (1997) Efg1p, an essential
regulator of morphogenesis of the human pathogen Candida albicans, is a member of a conserved class of bHLH proteins regulating morphogenetic processes in fungi. EMBO J 16: 1982–1991.
16. Sudbery PE (2011) Growth of Candida albicans hyphae. Nat Rev Microbiol 9: 737–748.
17. El Barkani A, Kurzai O, Fonzi WA, Ramon A, Porta A, et al. (2000) Dominant active alleles of RIM101 (PRR2) bypass the pH restriction on filamentation of Candida albicans. Mol Cell Biol 20: 4635–4647.
18. Kadosh D, Johnson AD (2005) Induction of the Candida albicans filamentous growth program by relief of transcriptional repression: a genome-wide analysis. Mol Biol Cell 16: 2903–2912.
19. Braun BR, Johnson AD (1997) Control of filament formation in Candida albicans by the transcriptional repressor TUP1. Science 277: 105–109. 20. Braun BR, Kadosh D, Johnson AD (2001) NRG1, a repressor of filamentous
growth in C.albicans, is down-regulated during filament induction. EMBO J 20: 4753–4761.
21. Lu Y, Su C, Wang A, Liu H (2011) Hyphal development in Candida albicans requires two temporally linked changes in promoter chromatin for initiation and maintenance. PLoS Biol 9: e1001105.
22. Lu Y, Su C, Liu H (2012) A GATA transcription factor recruits Hda1 in response to reduced Tor1 signaling to establish a hyphal chromatin state in Candida albicans. PLoS Pathog 8: e1002663.
23. Park YN, Morschhauser J (2005) Tetracycline-inducible gene expression and gene deletion in Candida albicans. Eukaryot Cell 4: 1328–1342.
24. Muhlschlegel FA, Fonzi WA (1997) PHR2 of Candida albicans encodes a functional homolog of the pH-regulated gene PHR1 with an inverted pattern of pH-dependent expression. Mol Cell Biol 17: 5960–5967.
25. Saporito-Irwin SM, Birse CE, Sypherd PS, Fonzi WA (1995) PHR1, a pH-regulated gene of Candida albicans, is required for morphogenesis. Mol Cell Biol 15: 601–613.
26. Lamarre C, Deslauriers N, Bourbonnais Y (2000) Expression cloning of the Candida albicans CSA1 gene encoding a mycelial surface antigen by sorting of Saccharomyces cerevisiae transformants with monoclonal antibody-coated magnetic beads. Mol Microbiol 35: 444–453.
27. Lane S, Birse C, Zhou S, Matson R, Liu H (2001) DNA array studies demonstrate convergent regulation of virulence factors by Cph1, Cph2, and Efg1 in Candida albicans. J Biol Chem 276: 48988–48996.
28. Kumar MJ, Jamaluddin MS, Natarajan K, Kaur D, Datta A (2000) The inducible N-acetylglucosamine catabolic pathway gene cluster in Candida albicans: discrete N-acetylglucosamine-inducible factors interact at the promoter of NAG1. Proc Natl Acad Sci U S A 97: 14218–14223.
29. Alvarez FJ, Konopka JB (2007) Identification of an N-acetylglucosamine transporter that mediates hyphal induction in Candida albicans. Mol Biol Cell 18: 965–975.
30. Naseem S, Gunasekera A, Araya E, Konopka JB (2011) N-acetylglucosamine (GlcNAc) induction of hyphal morphogenesis and transcriptional responses in Candida albicans are not dependent on its metabolism. J Biol Chem 286: 28671–28680.
31. Gunasekera A, Alvarez FJ, Douglas LM, Wang HX, Rosebrock AP, et al. (2010) Identification of GIG1, a GlcNAc-induced gene in Candida albicans needed for normal sensitivity to the chitin synthase inhibitor nikkomycin Z. Eukaryot Cell 9: 1476–1483.
32. Kamthan M, Mukhopadhyay G, Chakraborty N, Chakraborty S, Datta A (2012) Quantitative proteomics and metabolomics approaches to demonstrate N-acetyl-D-glucosamine inducible amino acid deprivation response as morpho-logical switch in Candida albicans. Fungal Genet Biol 49: 369–378. 33. Smoot ME, Ono K, Ruscheinski J, Wang PL, Ideker T (2011) Cytoscape 2.8:
new features for data integration and network visualization. Bioinformatics 27: 431–432.
34. Banerjee M, Thompson DS, Lazzell A, Carlisle PL, Pierce C, et al. (2008) UME6, a novel filament-specific regulator of Candida albicans hyphal extension and virulence. Mol Biol Cell 19: 1354–1365.
35. Martin R, Moran GP, Jacobsen ID, Heyken A, Domey J, et al. (2011) The Candida albicans-specific gene EED1 encodes a key regulator of hyphal extension. PLoS One 6: e18394.
36. Zhao X, Oh SH, Cheng G, Green CB, Nuessen JA, et al. (2004) ALS3 and ALS8 represent a single locus that encodes a Candida albicans adhesin; functional comparisons between Als3p and Als1p. Microbiology 150: 2415– 2428.
37. Birse CE, Irwin MY, Fonzi WA, Sypherd PS (1993) Cloning and character-ization of ECE1, a gene expressed in association with cell elongation of the dimorphic pathogen Candida albicans. Infect Immun 61: 3648–3655. 38. Braun BR, Johnson AD (2000) TUP1, CPH1 and EFG1 make independent
contributions to filamentation in candida albicans. Genetics 155: 57–67. 39. Sharkey LL, McNemar MD, Saporito-Irwin SM, Sypherd PS, Fonzi WA (1999)
HWP1 functions in the morphological development of Candida albicans downstream of EFG1, TUP1, and RBF1. J Bacteriol 181: 5273–5279.
40. Uhl MA, Biery M, Craig N, Johnson AD (2003) Haploinsufficiency-based large-scale forward genetic analysis of filamentous growth in the diploid human fungal pathogen C.albicans. EMBO J 22: 2668–2678.
41. Hope H, Bogliolo S, Arkowitz RA, Bassilana M (2008) Activation of Rac1 by the guanine nucleotide exchange factor Dck1 is required for invasive filamentous growth in the pathogen Candida albicans. Mol Biol Cell 19: 3638–3651. 42. Bruno VM, Wang Z, Marjani SL, Euskirchen GM, Martin J, et al. (2010)
Comprehensive annotation of the transcriptome of the human fungal pathogen Candida albicans using RNA-seq. Genome Res 20: 1451–1458.
43. Sellam A, Hogues H, Askew C, Tebbji F, van Het Hoog M, et al. (2010) Experimental annotation of the human pathogen Candida albicans coding and noncoding transcribed regions using high-resolution tiling arrays. Genome Biol 11: R71.
44. Wachtler B, Wilson D, Haedicke K, Dalle F, Hube B (2011) From attachment to damage: defined genes of Candida albicans mediate adhesion, invasion and damage during interaction with oral epithelial cells. PLoS One 6: e17046. 45. Zakikhany K, Naglik JR, Schmidt-Westhausen A, Holland G, Schaller M, et al.
(2007) In vivo transcript profiling of Candida albicans identifies a gene essential for interepithelial dissemination. Cell Microbiol 9: 2938–2954.
46. Harcus D, Nantel A, Marcil A, Rigby T, Whiteway M (2004) Transcription profiling of cyclic AMP signaling in Candida albicans. Mol Biol Cell 15: 4490– 4499.
47. Fradin C, Kretschmar M, Nichterlein T, Gaillardin C, d’Enfert C, et al. (2003) Stage-specific gene expression of Candida albicans in human blood. Mol Microbiol 47: 1523–1543.
48. Bensen ES, Martin SJ, Li M, Berman J, Davis DA (2004) Transcriptional profiling in Candida albicans reveals new adaptive responses to extracellular pH and functions for Rim101p. Mol Microbiol 54: 1335–1351.
49. Holton NJ, Goodwin TJ, Butler MI, Poulter RT (2001) An active retro-transposon in Candida albicans. Nucleic Acids Res 29: 4014–4024. 50. Argimon S, Wishart JA, Leng R, Macaskill S, Mavor A, et al. (2007)
Developmental regulation of an adhesin gene during cellular morphogenesis in the fungal pathogen Candida albicans. Eukaryot Cell 6: 682–692.
51. Enjalbert B, Whiteway M (2005) Release from quorum-sensing molecules triggers hyphal formation during Candida albicans resumption of growth. Eukaryot Cell 4: 1203–1210.
52. Shannon P, Markiel A, Ozier O, Baliga NS, Wang JT, et al. (2003) Cytoscape: a software environment for integrated models of biomolecular interaction networks. Genome Res 13: 2498–2504.
53. Martchenko M, Levitin A, Hogues H, Nantel A, Whiteway M (2007) Transcriptional rewiring of fungal galactose-metabolism circuitry. Curr Biol 17: 1007–1013.
54. Arnaud MB, Costanzo MC, Skrzypek MS, Shah P, Binkley G, et al. (2007) Sequence resources at the Candida Genome Database. Nucleic Acids Res 35: D452–456.
55. Nantel A, Dignard D, Bachewich C, Harcus D, Marcil A, et al. (2002) Transcription profiling of Candida albicans cells undergoing the yeast-to-hyphal transition. Mol Biol Cell 13: 3452–3465.
56. Ene IV, Bennett RJ (2009) Hwp1 and related adhesins contribute to both mating and biofilm formation in Candida albicans. Eukaryot Cell 8: 1909–1913. 57. Zheng X, Wang Y, Wang Y (2004) Hgc1, a novel hypha-specific G1
cyclin-related protein regulates Candida albicans hyphal morphogenesis. EMBO J 23: 1845–1856.
58. Hnisz D, Majer O, Frohner IE, Komnenovic V, Kuchler K (2010) The Set3/ Hos2 histone deacetylase complex attenuates cAMP/PKA signaling to regulate morphogenesis and virulence of Candida albicans. PLoS Pathog 6: e1000889. 59. Noble SM, Johnson AD (2005) Strains and strategies for large-scale gene
deletion studies of the diploid human fungal pathogen Candida albicans. Eukaryot Cell 4: 298–309.
60. Schaub Y, Dunkler A, Walther A, Wendland J (2006) New pFA-cassettes for PCR-based gene manipulation in Candida albicans. J Basic Microbiol 46: 416– 429.
61. Walther A, Wendland J (2003) An improved transformation protocol for the human fungal pathogen Candida albicans. Curr Genet 42: 339–343. 62. Fradin C, De Groot P, MacCallum D, Schaller M, Klis F, et al. (2005)
Granulocytes govern the transcriptional response, morphology and proliferation of Candida albicans in human blood. Mol Microbiol 56: 397–415.
63. Pfaffl MW (2001) A new mathematical model for relative quantification in real-time RT-PCR. Nucleic Acids Res 29: e45.
64. Gillum AM, Tsay EY, Kirsch DR (1984) Isolation of the Candida albicans gene for orotidine-59-phosphate decarboxylase by complementation of S. cerevisiae ura3 and E. coli pyrF mutations. Mol Gen Genet 198: 179–182.