Abstract—The number and adequacy of Performance-Indicators (PIs) for organisational purposes are core to the success of organisations and a major concern to the sponsor of this research. This assignment developed a procedure to improve a firm’s performance assessment system, by identifying two key-PIs out of 28 initial ones, and by setting criteria and their relative importance to validate and rank the adequacy and the right number of operational metrics. The Analytical-Hierarchy-Process was used with a synthesis-method to treat data coming from the management inquiries. Although organisational alignment has been achieved, business processes should also be targeted and PIs continuously revised.
Keywords—Strategic performance assessment systems, Key Performance Indicators (KPIs), Analytical Hierarchy Process (AHP).
I. INTRODUCTION
OWADAYS, to remain competitive and attractive, organisations have to improve their performance by raising income, increasing efficiency and, also, by mitigating the environmental impact of production. Thus, acting simultaneously in the social, economic and environmental dimensions is a way to differentiate themselves from the competition and thus, to assure survival. A well-tuned performance evaluation system enables effective operational management to make the right decisions in pursuit of success within the required strategic scope. Indeed, a Performance Assessment System (PAS) is a vital part of an organisation’s managerial system [1]. Therefore, in order to manage the performance of organisations, Performance Indicators (PIs) are required. Moreover, Key Performance Indicators (KPIs) may provide very important, additional information regarding the existing relationships between PIs. This not only enables the re-planning of the objectives they are associated with, but it also leads to improving the decision-making process.
The brief from the sponsor of this assignment was to find ways to improve its performance. The firm is a multinational, non-alcoholic drinks company, located in Portugal, which regularly applies for international certification of quality. During its last application, some points in need of improvement where highlighted. Amongst these was the need
Isabel Duarte de Almeida is with the Fac. Economia e Ciências Empresariais, Universidade Lusíada, ILID-UL, Lisboa, Portugal (Phone: +351 213611500; Fax: +351213638307; e-mail: [email protected]).
João Vilas-Boas is with the Business School of Instituto Universitário de Lisboa (ISCTE-IUL), BRU-UNIDE, Lisboa, Portugal (Phone: +351217903 403; Fax: +351 217 964 710; E-mail: [email protected]).
Ana Abrantes Cabral is a graduate of the “Mestrado em Gestão dos Serviços e da Tecnologia”, Instituto Universitário de Lisboa (ISCTE-IUL), Lisboa, Portugal (Phone: +351 217 903 403; Fax: +351 217 964 710; E-mail: [email protected]).
to reduce the large number of existing performance evaluation metrics since some of them are redundant. This, then, is the focus of this paper.
The objective of our research is to collect and analyze data to help reduce the amount of performance metrics and to identify the key-PIs (KPIs) from among the total set of performance indicators employed at the organisational level. The chosen PIs may subsequently be used by the organisation’s executives and managers, both to monitor productivity and to evaluate performance. In systematically reducing the number of organisational performance evaluation measures, and to identify the performance indicators that best suit the organisation, the opinion and perceptions of the company representatives were always taken into consideration. First, therefore, to achieve the research objective, a multi-criteria analysis was performed on the data collected by questionnaire. Second, a model was developed.
The remainder of the paper is structured as follows: In the next section, the literature survey is presented and a theoretical set of assumptions for studying performance evaluation and PIs is identified. In Section III, the case study and the research methodology are presented. In Section IV, results are presented and discussed. The last section consists of the concluding remarks.
II. LITERATURE REVIEW
This research adapts the process of development and implementation of PIs proposed by [2] to ensure a structured and strategically focused performance assessment system. Within this study, three stages have been set to reduce the range of organisational PIs, namely:
i) to look for the semantic definition in the organisation; ii) to set the general criteria for the PI system development;
and,
iii) to look for validation of the PIs. The literature review follows these guidelines.
A. Performance Evaluation and Assessment Systems
Performance evaluation is a hot topic that is often discussed yet, despite its importance, it is rarely defined. A popular management adage states that it is not possible to manage what cannot be measured. Indeed, organisational activities should be systematically analyzed to identify the true sources of competitive advantage [3], i.e. the business processes that add value to the consumer [4], as regards both efficiency and effectiveness. Achieving a higher level of product conformance leads to greater customer satisfaction and provides room to clarify the basic semantics, as:
Developing a Structured and Strategically Focused
Performance Assessment System
Isabel Duarte de Almeida, João Vilas-Boas, Ana Abrantes Cabral
N
i) Performance assessment - a practice-based framework that builds on the synergy between planning and assessment, and results in the discernment of impact and value of action [5];
ii) Performance measurement - the process of quantifying the efficiency and effectiveness of action [1];
iii) Performance measure - metrics used to quantify the efficiency and/or effectiveness of an action [1];
iv) Performance measurement system - a set of metrics used to quantify both the efficiency and the effectiveness of actions [6].
The focus of Performance Measurement Systems (PMS) on cost-effectiveness is limited because it excludes other criteria [7]. At the same time, the Performance Assessment Systems (PAS) are tools for evaluating the performance of all key company systems, and include an extensive evaluation of management, business, and production processes with the following objectives: (i) to identify strengths and improvement opportunities within the company; and, (ii) to provide a basis for developing appropriate action plans for improvement.
Nowadays, organisations must be able to evaluate their objectives and to establish appropriate strategies to reach their goals. Therefore, to assess the amount of utility and desirability of their activities, especially in complex and dynamic environments, each organisation needs to determine and rank vital Performance Indicators (PIs). These indicators provide essential links between strategy, execution, and ultimate value creation. Magretta and Stone [8] suggest that indicators and performance assessment are elements that are critical to operationalise the mission or strategy of an organisation. Indicators and strategy are tightly and inevitably linked to each other. Strategy without indicators is useless, and indicators without a strategy are also meaningless. Therefore, PIs are a common concern for every assessment or performance measurement and the choice of the PIs depends on the business domain and on the objective for its use.
B. Defining the Semantics for the Organisation
A PI is a metric used either to determine the efficiency/effectiveness in an existing system, or to compare competing alternative systems [9]. A significant concern during the implementation of PIs is to understand the difference between the most important and strategy-oriented metrics and, the others [10]. So, it becomes relevant to use semantics that clearly distinguishes the different kinds of PIs. Different authors propose distinctive semantics [11], [12], [13]. The terminology we have selected and adopted is that proposed by [12]. He attempts to distinguish different PIs by suggesting two types of performance indicators: KPIs and operational metrics. According to [12], KPIs are directly linked to strategic objectives, while operational metrics represent PIs that are still relevant when assessing the organisation’s performance. Effective KPIs should then meet ten criteria, as follows: (i) Reduced; (ii) Drillable; (iii) Simple; (iv) Actionable; (v) Owned; (vi) Referenced; (vii) Correlated among themselves and the desired outcomes; (viii) Balanced; (ix) Aligned and that do not undermine other KPIs; and, (x)
Validated, i.e. KPIs must be tested to prevent employees from influencing them negatively.
Hope and Fraser in [13] propose that KPIs should be related to Critical Success Factors (CSFs) due to their core relationship with the organisation’s success. This relationship is also important to determine which PIs are considered KPIs. Bossel [14] adds that managers often forget that performance evaluation can best be achieved if only a few good indicators are used. According to this author, the selection of PIs is subjective as there may be different groups of metrics for the same information, depending on the investigator. Therefore, it is important to have a perception of the average number of PIs that is considered adequate for an organisation.
Similar to what happens when defining semantics, different authors also have different but closely related ideas regarding a suitable number of organisational PIs, as follows:
• no more than 20 KPIs [13]; • a maximum of 10KPIs [13]; • between five and nine KPIs [12]; • a maximum of 10 KPIs and 20 PIs [13].
Taking into account both the company characteristics and the research objectives, the most suitable definition appears to be that of Parmenter, because it limits not only KPIs but the overall amount of organisational PIs. Therefore, these are the targets for this investigation with regard to limiting the amount of PIs.
C. Setting General Criteria for the System Development of PIs
There is no right or best way to reduce indicators, just as there are no formal guidelines, despite there being a need for an organized and systematic method associated with the relevant criteria to reduce their number to a workable size.
There are many different criteria which can be used to complement the presented methodologies [2], [13], [15]. The approach selected was proposed by the OAGC (2008) [15] which defines the following criteria: (i) Meaningful; (ii) Understandable; (iii) Reliable; and (iv) Feasible.
D. Performance Indicator Validation
This research follows the method proposed by [16] to select PIs. This method introduces the Analytic Hierarchy Process (AHP) both to ease the selection of and the comparison between strategic alternatives. The methodology assumes that the decision making process is often affected by value judgements and, as such, involves criteria and preferences related to each choice, which grants a variable degree of decision subjectivity. The AHP is a theory of measurement through pairwise comparisons and relies on the judgements of experts to derive priority scales. These scales measure intangible factors in decisions, in relative terms. The comparisons are made using a scale of absolute judgements that represents how much one element dominates another with respect to a given attribute. Therefore, the AHP promotes an organized decision making process which enables the establishment of priorities through four stages:
1. Problem definition and determination of the necessary knowledge;
2. Structure the decision hierarchy from the top (the decision), to the intermediate levels (the criteria on which the elements depend) and, finally, to the alternatives; 3. Building up a group of upper/lower element comparison
matrices;
4. Weighting the lower level priorities by using the elements resulting from the previous comparison. The weights of
each lower level element are summed together to define its global priority. The process is repeated until all the priorities are established.
To make comparisons, it is necessary to have a scale of numbers (Table I) that indicates how many times more important or dominant one element is over another one with regard to the criterion or property used for the comparison.
TABLEI SAATY SCALE [16]
Importance Definition Explanation
1 Equal Importance Two activities contribute equally to the objective
3 Moderate importance Experience and judgement slightly favour one activity over another
5 Strong importance Experience and judgement strongly favour one activity over another
7 Very strong or demonstrated importance An activity is favoured very strongly over another one; its dominance is demonstrated in practice 9 Extreme importance The evidence favouring one activity over another is of the highest possible order of affirmation
2, 4, 6, 8 In between values When compromise is necessary
Reciprocals of above
If activity ”i” has one of the above non-zero numbers assigned to it, when compared with activity “j”, then “j” has the reciprocal value when compared with ”i”
The Saaty scale represents how each criterion is classified in relation to the others. For example, if criteria ”i” is much more important than “j”, then, it scores a 9; thus, “j” will be much less important than ”i”, and it scores the reciprocal value, i.e. 1/9. This is how the criteria comparison table is built (e.g. Table III). Then, the normalized table is generated (e.g. Table IV). In Table IV, it is necessary to calculate the relative importance of each criterion. To do so, the importance of each criterion in each column must be divided by the sum of the importance of the respective column. Having identified the relative importance of each criterion, it is possible to calculate the Eigenvector (e.g. Table IV). In this work, since we adopt Parmenter's view, the number of criteria used to calculate the Eigenvector is 10. The Eigenvector allows us to calculate the Consistency Index (CI) (2) and the Consistency Ratio (CR). The CR enables us to find out whether the experts’ opinions are consistent or not. If the value of CR differs greatly from “0.1”, it means that the opinions cannot be trusted, thus the result is meaningless and the inquiry should be repeated. CR is calculated by (1):
(1)
(2)
where is the consistency index;
∑ (3)
where (3) is the main Eigenvalue, where “i” corresponds to the attribute, i=1, 2,…n, being “n” the number of assessed criterion (attributes).
is a fixed value, denominated by [16] as the Random Consistency Index; RI is coming from Table II. In addition, [2] presents an approach to summarise and validate PIs based on the level of importance “wj” of each indicator. This approach takes into consideration the importance of the representative targets, in order to get a group of indicators
which are focused on some important aspects, and is based on (4), as:
∑ (4)
where: – relative importance of the criterion “i”, i=1, 2,…m;
– strength of the relation between the criterion “i” and the PI “j”; i=1, 2,…m, and j=1, 2,…n; m – total amount of criteria; and, n – total amount of PIs.
TABLEII
RANDOM CONSISTENCY INDEX (RI)[16]
N 1 2 3 4 5 6 7 8 9 10 11 … RI 0 0 0.58 0.9 1.12 1.24 1.32 1.41 1.45 1.49 1.51
III. CASE STUDY A. Methodology
The research objective concerns the selection and reduction of the KPIs in a multinational non-alcoholic drinks company, aiming to achieve better information analysis, and decision making at the organizational level. Thus, the specific objectives are, as follows:
• Identify the most important KPIs that must be kept; • Suggest improvements to the performance assessment
model being utilized in the company for strategic follow up.
The conceptual model underlying the research presented in the case study focuses on the manager’s perceptions of both the adequacy and importance of the organisational PIs currently in use and, also, on the effect of the anticipated improvement on the performance assessment. Thus, this research can be characterized as exploratory. The main data are collected through interviews and participant observation. Field notes and written material, such as that related to the organisation’s international certificates of quality and reports are further used for data analysis. To achieve the proposed objectives, the three stage approach based on the development
of PIs and the implementation process of [2] is outlined, as follows:
1) Defining Semantics for the Organisation
The semantics chosen for the organisation is that proposed by [12], and a relationship between KPIs and CSFs is added. The expected outcomes are the following: (i) the definition of a PI; (ii) the definition of the target number of PIs; and (iii) the identification of the organisational KPIs out of the 28 currently existing PIs. Managers, therefore, complete a questionnaire in order to identify which of the existing PIs fit the description of KPIs. After further analysis, considering the definition of KPIs, the organisation’s KPIs are identified.
2) Establishing the General Criteria for the System Development
The relative importance of each criterion is the expected outcome of applying the AHP method [17] together with the criteria recommended by the OAGC [15]. Thus, a session was held with managers to compare each criterion with each other (Table III) according to the Saaty scale [16]. The information obtained is then processed in order to calculate the relative importance of each criterion (Table IV). This relative importance will be used when summarizing the existing operational metrics.
3) Validating the Performance Indicators
The final set of operational metrics will be identified, in the last stage of the process. In order to calculate the absolute importance of each metric, the indicator synthesis method based on relative importance [2] will be applied. This method is used to compare each operational metric to the criteria proposed by the OAGC [15], by taking into consideration not only the previously identified relative importance of the criteria, but also the strength of the relation between each metric and criterion. To assess the strength, a questionnaire is applied that enables the managers to identify how strongly each metric fulfils each criterion, on a scale of 1-3-9 (1- weak; 3- medium; 9 - strong relation). Then, the absolute importance of the operational metrics is calculated and used to exclude the metrics of the lowest value to the company according to the manager’s opinions.
B. Results
1) Defining Semantics for the Organisation
The semantics applied is that presented by [12] which divides PIs into two categories: KPIs and operational metrics. Furthermore, a relationship between KPIs and CSFs is added to the Eckerson definition of KPI. In this way, when trying to identify KPIs, each metric must follow the ten criteria previously referred to. So, when reducing the amount of PIs, the target is the one presented by [13], i.e. a maximum of 20 organisational PIs, of which no more than 10 should be KPIs. The KPIs were identified using the questionnaire applied to managers. The criteria presented in the questionnaire are
related to the metric itself and not to the set of metrics. Therefore, the managers were asked to state whether each of the existing PIs satisfied the following criteria: drillable, simple, actionable, owned, referenced, and related to CSFs.
Considering their answers, only the PIs that, according to all responses, fulfilled all the criteria could be categorized as possible KPIs. So, two possible KPIs from the 28 PIs currently in existence were identified, namely: (1) Customer satisfaction; and (2) Results before taxes. Comparing these metrics to the remaining criteria, it is clear that they can be considered KPIs because they satisfy the requisite Eckerson’s criteria [12], as follows:
• Reduced: there are only two, despite it being possible to identify a maximum of 10;
• Correlated: customer satisfaction impacts results before taxes and both of them contribute to some of the organisation’s objectives;
• Balanced: one is a financial measure and the other is a non-financial one;
• Aligned: neither KPI undermines the other;
• Validated: both KPIs can be influenced by employees. If two KPIs out of 28 PIs were identified by the managers, all of the remaining 26 PIs are, by default, categorized as operational metrics. These PIs will also need to be validated in order to be further reduced, i.e. they must be tested to prevent employees influencing them negatively [12].
2) Establishing the General Criteria for the System Development
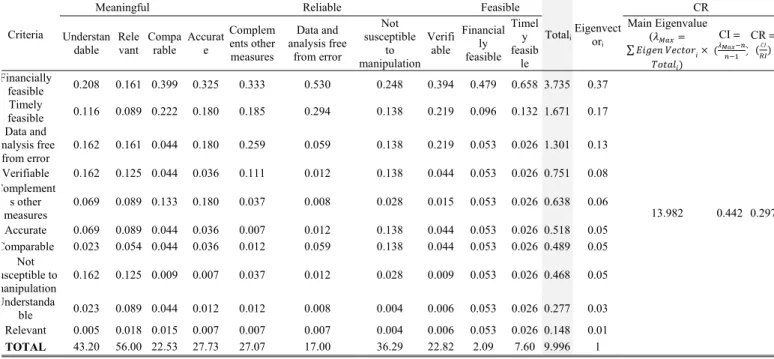
The criteria applied are those proposed by the OAGC [15]. At this stage, it is necessary to define the relative importance of each criterion in order to validate the PIs in the final stage. To do so, a session was held with managers to apply the AHP method [17]. The results of the session are presented in Table III. This shows the comparison matrix, which represents the comparison between each criterion and all the others, according to the managers’ opinions. Based on these results, it was possible to normalize the comparison matrix. To normalize the comparison values, the classification of each criterion (line) was divided by the total score of the respective criterion (column). Having calculated the total score it was then easy to normalize all the comparison values. For example, for the “Understandable” criterion, this is as follows: 0.023 = 1 ÷ 43.2 (Table IV).
The remaining computation of these results is presented in Table IV. To calculate the Eigenvectori (for each criterion), it was necessary to divide the sum of all the relative weights of each criterion (Totali) by the total number of criteria, i.e. 10. For example, for the criterion “Understandable” the computation is, as follows: 0.03≈ (0.023+0.089+0.044+ +0.012+0.012+0.008+0.004+0.006+0.053+0.026)/10 (Table IV).
TABLEIII
CRITERIA COMPARISON TABLE ACCORDING TO SAATY’S SCALE [16]
Criteria
Meaningful (Mea) Reliable (Rel) Feasible (Fea)
Understandab
le Relevant Comparable Accurate
Complem ents other measures
Data and analysis
free from error to manipulation Not susceptible Verifiable Financially feasible feasible Timely
Mea Understandable 1 5 1 1/3 1/3 1/7 1/7 1/7 1/9 1/5 Relevant 1/5 1 1/3 1/5 1/5 1/9 1/7 1/7 1/9 1/5 Comparable 1 3 1 1 1/3 1 5 1 1/9 1/5 Rel Accurate 3 5 1 1 1/5 1/5 5 1 1/9 1/5
Complements other measures 3 5 3 5 1 1/7 1 1/3 1/9 1/5
Data and analysis free from error 7 9 1 5 7 1 5 5 1/9 1/5 Not susceptible to manipulation 7 7 1/5 1/5 1 1/5 1 1/5 1/9 1/5
Verifiable 7 7 1 1 3 1/5 5 1 1/9 1/5
Fea Financially feasible 9 9 9 9 9 9 9 9 1 5
Timely feasible 5 5 5 5 5 5 5 5 1/5 1
TOTAL 43.2 56.0 22.53 27.73 27.07 17.00 36.29 22.82 2.09 7.60 TABLEIV
NORMALIZED TABLE TO CALCULATE THE EIGENVECTOR AND THE CONSISTENCY RATIO (CR)
Criteria
Meaningful Reliable Feasible
TotaliEigenvector i
CR Understan
dable Relevant Comparable Accurate
Complem ents other measures Data and analysis free from error Not susceptible to manipulation Verifi able Financial ly feasible Timel y feasib le Main Eigenvalue ( ∑ CI CR Financially feasible 0.208 0.161 0.399 0.325 0.333 0.530 0.248 0.394 0.479 0.658 3.735 0.37 13.982 0.442 0.297 Timely feasible 0.116 0.089 0.222 0.180 0.185 0.294 0.138 0.219 0.096 0.132 1.671 0.17 Data and analysis free from error 0.162 0.161 0.044 0.180 0.259 0.059 0.138 0.219 0.053 0.026 1.301 0.13 Verifiable 0.162 0.125 0.044 0.036 0.111 0.012 0.138 0.044 0.053 0.026 0.751 0.08 Complement s other measures 0.069 0.089 0.133 0.180 0.037 0.008 0.028 0.015 0.053 0.026 0.638 0.06 Accurate 0.069 0.089 0.044 0.036 0.007 0.012 0.138 0.044 0.053 0.026 0.518 0.05 Comparable 0.023 0.054 0.044 0.036 0.012 0.059 0.138 0.044 0.053 0.026 0.489 0.05 Not susceptible to manipulation 0.162 0.125 0.009 0.007 0.037 0.012 0.028 0.009 0.053 0.026 0.468 0.05 Understanda ble 0.023 0.089 0.044 0.012 0.012 0.008 0.004 0.006 0.053 0.026 0.277 0.03 Relevant 0.005 0.018 0.015 0.007 0.007 0.007 0.004 0.006 0.053 0.026 0.148 0.01 TOTAL 43.20 56.00 22.53 27.73 27.07 17.00 36.29 22.82 2.09 7.60 9.996 1
The Eigenvector represents the relative importance of the criteria when validating the PI in the next stage of the process. Moreover, the value computed for the Consistency Ratio was CR = 0.297 ≈ 30%, considering RI = 1.49 from Table II and CI = 0.442 from Table IV. CR ≈ 30% is above the ideal figure of 10%. However, since the organization managers were not
available for another iteration, the process was not repeated as it would normally be in a non-exploratory assignment. The relative importance considered for each criterion comes from the AHP application, according to the managers’ opinions (Table V).
TABLEV
CRITERIA’S RELATIVE IMPORTANCE
Criteria Relative Importance Criteria Relative Importance
Financially feasible 0.37 Accurate 0.05
Timely feasible 0.17 Comparable 0.05
Data and analysis free from error 0.13 Not susceptible to manipulation 0.05
Verifiable 0.08
Understandable 0.03 Complements other measures 0,06
3) Validating the Performance Indicators
To validate and reduce the PIs, the indicator synthesis based on the relative importance method [2] was applied using the
criteria proposed by OAGC [15]. The goal was to rank all operational metrics according to their absolute importance and to exclude the less important. Thus, we needed to determine
the strength of the relationship between each of the operational metrics and the criterion by means of another questionnaire to the managers. They were asked to rank the strength of the relationship on a scale of 1-3-9 (1 - weak; 3 - medium; 9 - strong relationship). The answers are summarized in Table VI. In addition, the absolute importance for a sample of 11 out 26 possible operational metrics is presented in Table VII. The figures are computed by the formula ∑ Eigenvectori x Relationship Strengthi. These values enable an easy
understanding of the absolute importance of each one of all the operational metrics, as well as the elimination of the less important ones. Looking at these values and also at the methodology, it becomes obvious that the operational metrics with a score of 1 should be excluded since they correspond to those that were classified by the managers as having a weak relationship with all the criteria. Therefore, the final set of operational metrics is the one ranked in Table VIII.
TABLEVI
STRENGTH OF THE RELATIONSHIP BETWEEN 11OPERATIONAL METRICS AND CRITERION
Criteria and relative importance (Eigenvectori)
Operational metrics
Meaningful Reliable Feasible
Understandab
le Relevant Comparable Accurate
Compleme nts other measures
Data & analysis
free from error to manipulation Not susceptible Verifiable Financially feasible feasibleTimely 0.03 0.01 0.05 0.05 0.06 0.13 0.05 0.08 0.37 0.17
Global development 3 3 3 3 9 3 9 3 3 9
Internal satisfaction 3 3 3 3 3 3 3 3 1 1
Employee retention rate 9 9 9 3 9 3 3 3 9 3
Absenteeism rate 9 9 9 3 9 3 3 3 9 3
Profit from employee’s suggestions 3 9 9 3 9 3 3 9 9 1
Maintaining annual certifications 9 9 9 9 9 9 9 9 9 9
Issue of social responsibility report 3 3 3 3 3 3 3 3 3 3
Reduction of losses 3 9 9 9 9 9 9 9 9 9
Nr. of new customers 9 9 9 9 9 9 9 9 9 9
Sales’ volume at events (units) 9 9 9 9 9 9 9 9 9 9
Nr. of visitors to the plant 9 9 9 9 9 9 9 9 9 9
Note: This table is just a sample of the operational metrics; so, it is not complete. TABLEVII
ABSOLUTE IMPORTANCE OF EACH PERFORMANCE INDICATOR
Organisational operational
metrics importance Absolute Organisational operational metrics importanceAbsolute Organisational operational metrics importance Absolute
Maintaining annual certifications 9 Global development 4.7 Nr. of supported entities 1 Nr. of new customers 9 Profit from implementing OE in the production process 3.6 Donations’ volume (units) 1
Nr. of plant visitors 9 Turnover 3 Product collection cost 1
Satisfaction level of plant visitors 9 Publishing the social responsibility report 3 Customer complaint cost 1 Loss reduction 8.8 Consolidate RTM 2.9 Sponsorships’ budget realization rate 1 Global market share 8.8 Internal satisfaction 1.9 Nr. of supported districts 1 Employee retention rate 6.2 CSD’s market share 1 Events Nr. supported by organisation 1
Absenteeism rate 6.2 H/S |Nielsen| 1
Sales volume at events 1 Employee’s suggestions profit 6.1 Bar Ind + Hot Nielsen 1
TABLEVIII
RANKING OF THE OPERATIONAL METRICS
Rank of
importance Organisational operational metrics importance Rank of Organisational operational metrics importance Rank of Organisational operational metrics 1 Maintaining annual certifications 6 Global market share 11 Profit from implementing OE to the production process 2 Nr. of new customers 7 Employee retention rate 12 Turn over
3 Nr. of site visitors 8 Absenteeism rate 13 Issue social responsibility report
4 Satisfaction level of site visitors 9 Profit from employee’s suggestions 14 Consolidate RTM
5 Loss reduction 10 Global development 15 Internal satisfaction
IV. CONCLUSIONS
An inadequate Performance Assessment System (PAS) might hinder the achievement of strategic objectives and organisational success. Performance indicators (PIs) are a relevant part of the PAS framework, and are strongly related to the quality of the metrics used by organisations when
translating their strategy to operational performance. Their number and adequacy to organisational purpose are relevant aspects to consider. This investigation contributed to research by designing a process which enabled the improvement of the PAS in a multinational firm, where the Balanced Scorecard was implemented. This process is based on a three-stage
approach which also led to relevant contributions to practice. In fact, the outcome of stage 1 – i.e. defining the firm’s semantics – was the identification of Customer Satisfaction and Results Before Taxes, as the firm’s KPIs out of 28 PIs. In stage 2, the relative importance of each criterion proposed by [15] is assessed by processing data collected from a manager’s survey through the AHP method [16]. In stage 3, these criteria were used to validate and rank the firm’s PIs, by using the method of [2], to perform the synthesis of the PIs by calculating the absolute importance of each candidate to operational metrics, according to the manager’s opinions. Therefore, we contend that the resulting fifteen operational metrics that were selected and ranked are adequate and relevant. In this way, a distinction was established between KPIs – i.e. PIs which measure the organisation’s performance regarding its strategic goals – and operational metrics, which are not directly linked to strategy. It was also possible to determine the absolute importance of each metric and, therefore, to rank them and exclude those of least importance.
A limitation of this pilot exploratory study was the small number of managers involved in the process. Another concern regards the Consistency Ratio of 30% which requires more iterations of the process. In further work, the organisation should opt for sessions, instead of questionnaires to gain a more holistic, consistent and accepted approach. This would benefit the company because, even with a supported methodology, the selection of the set of indicators always comes down to human judgement. This exercise should be carried out at several organisational levels to improve process alignment. Lastly, PIs must be continuously revised as the best PIs of today might be the worst of tomorrow.
ACKNOWLEDGMENT
Acknowledgement is due to our student Ana Cabral who developed an outstanding thesis [18] that supported this paper. She carried out autonomous fieldwork, despite following the guidelines.
This research was presented at thea EUROMA Conference, on June 26th - July 1st, 2015, in Neuchâtel, Switzerland.
REFERENCES
[1] Neely, A., Gregory, M. and Platts, K., “Performance measurement system design: a literature review and research agenda,” International Journal of Operations and Production Management, vol. 25, no. 12, pp. 1228-1263, 2005.
[2] Franceschini, F., Galetto, M. and Maisano, D., Management by measurement: Designing key indicators and performance measurement systems. Torino: Springer, 2007.
[3] Porter, M., Competitive strategy: Techniques for analysing industries and competitors. New York: The Free Press, 1998.
[4] Hammer, M., The process enterprise: An Executive perspective, Hammer and Company, 2001.
[5] Bowlby, R., “Living the Future: Organizational Performance Assessment,” Journal of Library Administration, vol.52, no. 6-7, pp. 626-652, 2012.
[6] Artz, M., Homburg, C. and Rajab, T., “Performance-measurement system design and functional strategic decision influence: The role of performance-measure properties,” Accounting, Organizations and Society, vol. 37, no. 7, pp. 445-460, 2012.
[7] Neely, A., Mills, J., Platts, K., Richards, H., Gregory, M., Bourne, M. and Kennerley, M., “Performance measurement system design: developing and testing a process-based approach,” International Journal
of Operations and Production Management, vol. 20, no. 10, pp. 1119-1145, 2000.
[8] Magretta, J. and Stone, N., What Management is: How it Works and Why it’s Everyone’s Business. New York, NY: Free Press, 2002. [9] Beamon, B., “Designing the green supply chain, Logistics Information
Management”, vol. 12, no. 4, pp. 332-342, 1999.
[10] Iveta, G., “Human resources key performance indicators,” Journal of Competitiveness, vol. 4, no. 1, pp. 117-128, 2012.
[11] Kaplan, R. and Norton, D., “The balanced scorecard – measures that drive performance,” Harvard Business Review, pp. 71-79, Jan-Feb. 1992.
[12] Eckerson, W., “Performance management strategies,” Business Intelligence Journal, vol. 14, no. 1, pp. 24-27, 2009.
[13] Parmenter, D., Key performance indicators (KPI): Developing, implementing and using winning KPI, 2nd ed., New Jersey: John Wiley & Sons, Inc., 2010.
[14] Bossel, H., “Assessing viability and sustainability: a systems-based approach for deriving comprehensive indicator sets,” Integrated Natural Resource Management: Linking Productivity, the Environment and Development, pp. 247-266, 2003.
[15] Office of the Auditor General of Canada (OAGC), 2008. Developing performance measures for sustainable development strategies. [Online] Available in: http://www.oag-bvg.gc.ca/internet/English/meth_gde_e_ 23715.html [Acessed 31st October 2013].
[16] Saaty, T., “Decision making with the analytic hierarchy process,” International Journal of Information Technology and Decision, vol. 8, no. 1, pp. 7-27, 2008.
[17] Saaty, T., The analytic hierarchy process: planning, priority setting, and resources allocation. New York: McGraw, 1980.
[18] Cabral, A., Melhoria do quadro de indicadores de avaliação do desempenho numa empresa de bebidas. MSc Thesis, ISCTE-IUL, Portugal, 2014.
Isabel Almeida is Assistant Professor and Coordinator of a Research Line in
Sustainable Development (Lusíada Univ., Portugal). She holds a PhD and a first degree (5 years) in Biology, and a Post-Graduation in Sociology from the University of Lisbon (Portugal). Dr. Almeida has just submitted her second PhD, in Sustainability and she worked as a researcher in Gulbenkian Institute of Science for 12 years. Trans-disciplinary studies in the Sustainable Development of Organizations, Economy, Society and Environment are the main research interests of Dr. Almeida. Currently, she is addressing the social perception of the coastal erosion risk.
João Vilas-Boas is Assistant Professor and Director of the MSc in
Management of Services & Technology (ISCTE-IUL, Portugal). He holds an MSc and a PhD in Manufacturing Systems Engineering from Cranfield University (UK), and a 5yr degree in Mechanical Engineering from the University of Lisbon (UL/IST, Portugal). Dr. Vilas-Boas has professional experience in process, automotive, batch and precision engineering industries and, also, in reforestation and project management. Sustainable Operations, Virtual Organizations and Soft Systems Methodology are his current research interests.
Ana Cabral is currently a Trainee in Supply Chain Management at the Moy
Park Company, Craigavon, Northern Ireland. She holds an MSc in Management of Services and Technology and a Bachelor's in Business Administration, both from ISCTE-IUL.
![TABLE I S AATY S CALE [16]](https://thumb-eu.123doks.com/thumbv2/123dok_br/18395623.893572/3.892.91.793.288.452/table-s-aaty-s-cale.webp)