Internship Report
Master in International Business
CREATING A CUSTOMER DATABASE TO
INCREASE EXPORT POTENTIAL FOR
MD PLASTICS
Iryna Babenko
Internship Report
Master in International Business
CREATING A CUSTOMER DATABASE TO
INCREASE EXPORT POTENTIAL FOR
MD PLASTICS
Iryna Babenko
Internship report developed under the supervision of PhD Susana Rodrigues, professor at the School of Technology and Management of the Polytechnic Institute of Leiria and co-supervision of Nuno Cipriano, Operational Director at MD Plastics.
iii
Acknowledgements
I would like to thank everyone who believed in me and who helped me to accomplish many of my complex tasks.
I am thankful for the assistance, guidance and feedback given by my coordinators professor Susana Rodrigues and Nuno Cipriano, Operational Director at MD Plastics. I would like to express my gratitude to the staff of the MD Plastics and specially, to Carina Clerigo for providing me with all kinds of information related to my day-to-day tasks. I am grateful to all my classmates, especially to Alex Losenok, Vahid Masimov and Tetiana Zhmykhova for your support and help during the period of study.
My special appreciation to Nelia Diogo: without you it would have been more difficult to accomplish this goal. Thank you for your help.
And my deepest appreciation to my family for their support on every level. Without you, this accomplishment would have been impossible.
v
Resumo
Este relatório de Mestrado baseia-se no estágio realizado na empresa MD Plastics, uma das várias empresas do MD Group. MD Plastics é uma empresa de injeção de plásticos para a indústria de moldes. Desde 2002, esta empresa tem implementado uma estratégia de expansão através da exportação de produtos plásticos para o mercado automóvel, alimentar e construção, em países como a Bélgica, Polónia, Espanha, Alemanha, República Checa, França entre outros. No entanto, o seu alvo principal tem sido a indústria automóvel. Na conjuntura atual do comércio internacional, a questão central que se coloca é como potenciar as exportações. De modo a dar resposta a esta questão e também a compreender o mercado potencial escolhido pela MD Plastics, foi sugerido a criação de uma base de dados de clientes. Isto premitirá á empresa contactar com potenciais clientes e consequentamente criar mais opportunidades de vendas. Este mercado potencial inclui a República Checa, França, Alemanha, Itália e Espanha. Foi igualmente elaborado um estudo sobre a economia e o comércio desses mesmos países. A informação foi recolhida através de fontes secundárias no período compreendido entre 2010 e 2017.
Palavras-chave: MD Plastics, segmentação de mercado, indústria automóvel, mercado potencial
vii
Abstract
This report is based on the internship made at MD Plastics, one of the companies in the MD GROUP. MD Plastics is a Portuguese plastic injection moulding company. Since 2002, this company has been implementing an expansion strategy though the exportation of plastic products for the automotive, food and construction markets to countries such as: Belgium, Poland, Spain, Germany, the Czech Republic, France among others. However, its primary focus has been on the automotive industry. In the present conditions of international trade, the relevant issue is how to increase export potential. In order to respond to this and to understand the potential market that was chosen by MD Plastics a customer database creation was suggested. This will allow the company to contact with potential customers and therefore create a positive impact on sales. The potential market includes: the Czech Republic, France, Germany, Italy and Spain. A study on the economy and trade of these countries was also made. This information was collected from secondary sources from 2010 to 2017.
ix
List of figures
Figure 1: Types of processes for manufacturing plastic products………...…....1
Figure 2: Internship report layout………...5
Figure 3. MD Plastics’ turnover, 2010 – 2016………7
Figure 4. Nested approach criteria, description and variables………...13
Figure 5. Nested approach………...14
Figure 6. GDP growth (%) for 2015 and 2016………...18
Figure 7. The Czech Republic’s exports by product category, 2016……….19
Figure 8. France exports by product category, 2016………...…...20
Figure 9. France imports by product category, 2016……….21
Figure 10. Germany exports by product category, 2016………….………...….…..22
Figure 11. Germany imports by product category, 2016………...22
Figure 12. Italy exports by product category, 2016………...23
Figure 13. Italy imports by product category, 2016………...24
Figure 14. Spain exports by product category, 2016………...24
Figure 15. Spain imports by the product category, 2016………...25
Figure 16. Direct automotive manufacturing employment in the potential market, 2015………26
Figure. 17 Destinations for EU passenger car exports, 2016……….27
Figure 18. Countries of origin of EU passenger car imports, 2016………27
Figure 19. Production of passenger cars in the EU in the potential market, 2016…….28
Figure 20. The passenger cars' registration in the potential market, June 2016 - June 2017………29
Figure 21. Research process………...31
Figure 22. Product range………36
xi
List of tables
Table1. Demographic changes in the potential market, January 2016 - January 2017………....16 Table 2. GDP per capita in PPS, for 2015 and 2016……….….18
xiii
List of acronyms
ACEA – The European Automobile Manufacturers Association AIA – The Automotive Industry Association of the Czech Republic ANFAC – The Spanish Association of Vehicle Manufacturers ANFIA – The Italian Association of Automotive Industries APQP - Advanced Product Quality Planning
CBD - Cost Breakdown
CCFA – The French Association of Vehicle Manufacturers EU - The European Union
FMEA - Failure Modes Effects Analysis
FECCI - The Federation of Indian Chambers of Commerce and Industry GDP - Gross Domestic Product
IMDS - International Material Data System N/A – Not Applicable
PPAP - Production Part Approval Process PPS - Purchasing Power Standard
R&D - Research and Development RFQ - Requests for Quotation UK - The United Kingdom USA - United States of America VAT - Value Added Tax
xv
Table of contents
ACKNOWLEDGEMENTS………... III RESUMO……….... V ABSTRACT………. VII LIST OF FIGURES………. IX LIST OF TABLES………XI LIST OF ACRONYMS……… XIII TABLE OF CONTENTS………XV1. INTRODUCTION……….…...1
1.1. Introduction: The plastic injection moulding ………..1
1.2. The motivation of the study....……….2
1.3. The purpose statement of the study…...………...2
1.4. Research aim…...……….3
1.5. The methodological basis of the study………...………...3
1.6. Structure of the internship report ....………...………...4
2. THE MD GROUP……….……….6
2.1. Profile and history of the MD GROUP………....6
2.2. Mission, vision and values of the MD GROUP………..….8
2.3. Strategy of the MD GROUP ...………...………...8
2.3.1. MD Plastics’ strategic areas ……….….….9
3. MARKET SEGMENTATION – THEORETICAL FRAMEWORK …………....10
3.1. Relevance and definitions of market segmentation………...10
3.2. The key approaches of the business-to-business market
segmentation………...12
4. FEATURES OF THE POTENTIAL MARKET: THE CZECH REPUBLIC, FRANCE, GERMANY, ITALY AND SPAIN………..15
4.1. The macroeconomic factors’ analyses...15
xvi
5. RESEARCH METHODOLOGY...30
5.1. Research purpose...30
5.2. The research process...30
5.3. Data collection methods and techniques – secondary data
collection...31
5.3.1. Sample of customer database creation...33
5.4. Strengths and weaknesses of the research methodology………34
6. FINDINGS AND DATA ANALYSIS – CUSTOMER DATABASE CREATION……….35
6.1. The market segmentation: variables used………...35
6.2. The customer database creation………..37
6.3. The company contacts with potential customers………38
7. THE INTERNSHIP ACTIVITIES AND TASKS………39
8. CONCLUSION………41
8.1. The importance of the internship………41
8.2. The theoretical contribution…..………..41
8.3. The managerial contribution ………..42
8.4. Limitations and future research………..42
REFERENCES………..43
WEBLIOGRAPHY………...45
1
1. INTRODUCTION
The central issue of this report is to present a customer database that was created based on business-to-business marketing segmentation. Initially, the author will introduce the background of the plastics injection moulding, in which MD Plastics operates. In this chapter the motivation and the purpose statement, the research aims, methodological basis and structure used to conduct the study will be presented.
1.1. Introduction: The plastic injection moulding
The internship took place in a plastic injection moulding company – MD Plastics. In today's world, life without plastic is almost unthinkable. The plastic industry has been making an essential contribution to the development of the world economy.
The plastics industry provides products to the automotive or transportation industry, household electrical appliances, packaging and construction industries among others. All semi-finished or finished products are made by the plastics converters (processors) or by plastic manufactures. 1 To manufacture the semi-finished or finished products, the plastic
convertors use different processes. The following table shows these processes and the various products produced with their help2 (see Figure 1).
Figure 1. Types of processes for manufacturing plastic products
Extrusion Films and sheets, Fibre and Filaments Pipes, Conduits and profiles, Miscellaneous applications
Injection moulding Industrial Injection Moulding, Household injection moulding and Thermoware/ Moulded luggage
Blow moulding Bottles, containers, Toys and Housewares
Roto moulding Large circular tanks such as water tanks
Source: The Federation of Indian Chambers of Commerce and Industry (FECCI), 2014
1Industry overview of the Germany Trade and Investment (GTAI) “The Plastics Industry in Germany”, 2016-2017 [Online] Available from: https://www.gtai.de/GTAI/Content/EN/Invest/_SharedDocs/Downloads/GTAI/Industry-overviews/industry-overview-plastics-industry-in-germany-en.pdf?v=12 accessed: [02.12.2016]
2A report on plastics industry of the Federation of Indian Chambers of Commerce and Industry (FECCI), “Potential of Plastics Industry in Northern India with special focus on plastic culture and food processing – 2014” [Online] Available from:
2 According to the Common plastic terminology:
“Plastic injection moulding is a manufacturing process for producing plastic components by injecting melted plastic resins into a plastic injection mould.”3
Due to the short production cycle (on average 15-60 seconds) it possible to obtain great precision parts in terms of material, color, and size flexibility. The plastic injection process is suitable for high volume production. Nowadays, the plastic injection moulding is still one of the most reliable manufacturing process.4
The plastic manufacturers work closely with the plastic injection mould producers. These last ones provide plastic moulds. Together they create more added value for business. In terms of national and international competition, the sector in which MD Plastics operates is extremely competitive. According to Eurostat data, the number of enterprises that manufacture plastic products in 2015 were 54 695 in the European Union (EU) with 28-member states. From this total amount, the Portuguese sector represents 1 127 enterprises.
1.2. The motivation of the study
The motivation of the study will to improve and increase the professional knowledge of the author in the area which is constant change and development. It also will allow me to improve my hard and soft skills, by working in a team and being part of an organization that I am unfamiliar with. This, I believe, will help to change and mould my vision of the future.
1.3. The purpose statement of the study
All businesses today face new global trade trends. These trends are mostly related to increasing competition and the rapid changes in technology and information transfer. This situation carries both new perspectives and threats: the emergence of new opportunities to increase sales and strict conditions for the competitiveness of enterprises. The companies
3 Common plastic terminology [Online] Available from:
https://info.rodongroup.com/bid/99919/Plastic-injection-molding-101-Common-terminology accessed: [03.12.2016]
4Ipsos Report: “Overview of the plastic injection mold fabrication and plastic injection molding segments” 2013, [Online] Available from: http://www.hkexnews.hk/listedco/listconews/SEHK/2013/1211/02283_1795647/E114.pdf accessed: [03.12.2016]
3 need to take into account that various factors are contributing to the success. There are important requirements which contribute to the company’s competitiveness: quality, lower price, service, timeliness and customization (Armstrong & Kotler, 2005). Companies should adapt to the global standards of trade, otherwise, the possibility of having a competitive advantage among the huge number of players is reduced to zero. One of the many ways to adapt to the new market is to understand the potential market and segmentation (Papulova & Populova, 2006).
For strategic reasons, MD Plastics is seeking to expand into European countries with a developed automotive industry, such as the Czech Republic, France, Germany, Italy and Spain. MD Plastics’ strategic areas will be mentioned in the following chapter. Consequently, the main purpose of the internship report is to implement the market segmentation strategy in order to increase export potential of the company and to create a customer database of the potential market: the Czech Republic, France, Germany, Italy and Spain. To better understand the potential market, its economy, foreign trade and the level of development of the automotive industry were explored. Furthermore, the research pursued a goal to find and contact potential customers through direct mail in order to achieve positive results for sales.
1.4. Research aim
The aim of the study is to implement market segmentation strategy and consequently creation a customer database. Also, to find and contact potential customers in order to achieve positive results for sales.
1.5. The methodological basis of the study
The research based on secondary data. The secondary data covers the period from 2010 to 2017. The internship report was written based on available information from different sources of public institutions.
4
1.6. Structure of the internship report
The internship report consists of eight chapters and is organized in the following way: The first chapter is the introduction, which includes the background of the plastic injection moulding, the motivation and the purpose statement of the study, and a brief description of the research aims, the methodology basis and the structure of the internship report.
The second chapter introduces the MD GROUP, its strategy, mission, vision and values, focusing on MD Plastics and its strategic areas.
The third chapter describes the review of literature of market segmentation. It provides a critical overview of the importance of market segmentation as a marketing tool and key approaches for the segmentation of the business-to-business market.
The fourth chapter provides the information about macroeconomic factors of the potential market. This chapter includes the analysed information concerning the development of the automotive industry in the potential market.
The fifth chapter describes the research process, research aim and the data collection methods and techniques.
The sixth chapter illustrates the findings and data analysis; segmentation variables which were used for the creation of a customer database, the database itself, and a brief discussion of the way to communicate with potential customers.
The seventh chapter shows the internship activities and tasks.
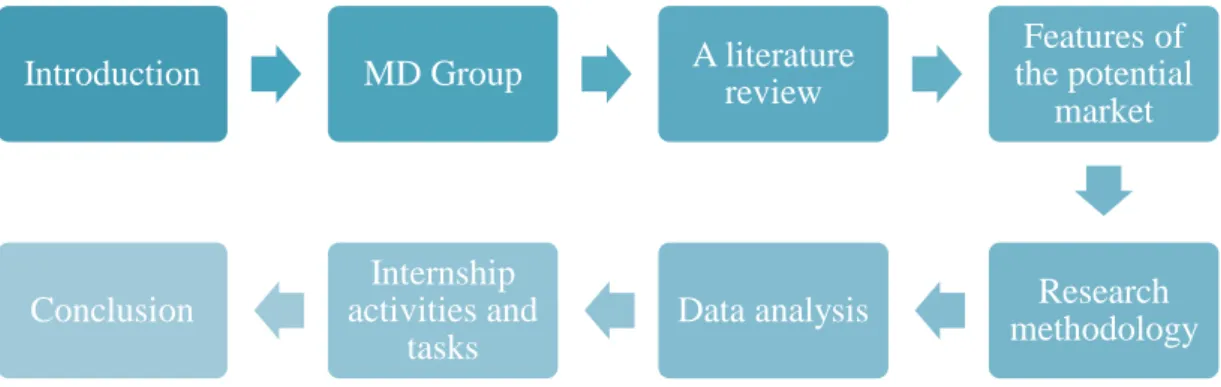
The conclusions are drawn in the eighth chapter. The importance of the internship, theoretical contribution, value for managers, limitation and suggestion for future research. Figure 2 shows the internship report layout.
5
Figure 2. Internship report layout
Source: Established by the author.
Introduction MD Group A literature
review Features of the potential market Research methodology Data analysis Internship activities and tasks Conclusion
6
2. THE MD GROUP
In this chapter, the attention is focused on the presentation of the company's objectives, understanding priority areas of activity and the company's guidelines and values. All the above definitions are laid down in the mission, vision, values and strategy of the MD GROUP. As it is important to understand the company in which the internship took place, namely MD Plastics, here the specialization area of the company, turnover statistics and strategic areas are presented.
2.1. Profile and history of the MD GROUP
The MD GROUP offers a service from the design of the mould to the injection of plastic parts encompassing all the activities of the value chain. The MD GROUP works in an integrated logic, consisting of the following companies: MD Moldes, MD Engineering, MD Fastooling and MD Plastics.5
The MD GROUP’s history begins with MD Moldes, which was established in 1989. MD Moldes was founded with the aim of providing a complete service for the mould plastic sector, from the concept and design, to the manufacture of the mould and injection moulding solutions.
MD Fastooling was established in 2005 with the aim of devoting itself exclusively to the manufacturing of injection mould for plastic, providing MD Moldes’ customers with a complete and integrated service in the molding field. The company was established from the combination of experience acquired in the fields of mould design, development, production monitoring and injection.6
MD Engineering was established in 1999 for mould design.
MD Plastics was founded in 2002 to address the need to test the moulds developed by the other companies of the MD GROUP. It is the company which specializes in mould testing, recreating the specific conditions of each customer. Currently, MD Plastics is focused on the production of plastic parts by injection, representing about 90% of its turnover. The company manufactures plastic products for the automotive, electronic vs. electrical, construction and food industries. Most of the requests for quotations (RFQ) come from customers that serve
5http://www.md-plastics.com/index.php/en/support/ accessed: [10.10.2016] 6http://www.md-fastooling.com/index.php/en/home-en/ accessed: [10.10.2016]
7 the automotive industry. Therefore, this company mostly specializes in manufacturing automotive plastic parts.
MD Plastics is supported by 6 to 1700 tons of injection machinery to produce a wide range of automotive plastic parts and innovative automotive lighting systems with the highest quality and technology. The company proposes solutions for the automotive industry, manufacturing a diversified product range: Exterior plastic parts; Lighting; Interior visible and non-visible plastic parts.
Great attention is given to the production of plastic parts for the automotive lighting market. The requirements for optical components are very high, since a small error can affect the transmission of light. Hence, the injection moulding process should have high accuracy and be subject to extreme quality control.7 Working along with the metrology and
quality departments, MD Plastics fulfills the quality management system requirements: ISO 9001/2008 and ISO/TS 16949/2009. It also uses different quality evaluation techniques such as: Failure Modes Effects Analysis (FMEA), International Material Data System (IMDS), Production Part Approval Process (PPAP), Advanced product quality planning (APQP), among others.
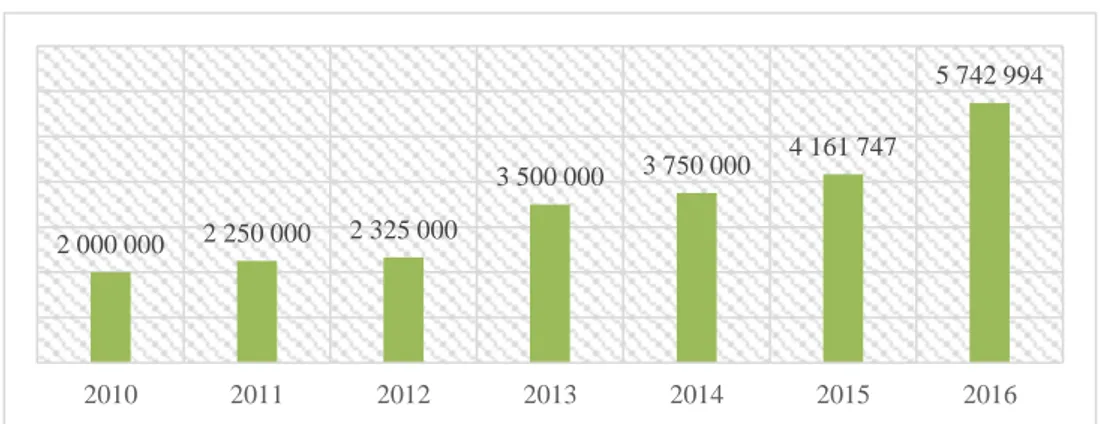
In order to perceive MD Plastics’ volume and growth trends of sales, the year-by- year turnover in euro from 2010 to 2016 is illustrated bellow in Figure 3.
Figure 3. MD Plastics’ turnover, 2010 – 2016
Source: MD Plastics’ presentation
7www.injectionworld.com accessed:[03.12.2016] 2 000 000 2 250 000 2 325 000 3 500 000 3 750 000 4 161 747 5 742 994 2010 2011 2012 2013 2014 2015 2016
8
2.2. Mission, vision and values of the MD GROUP
The MD GROUP's mission is embedded into three key words: technology, innovation and partnership. Technology refers to the enhanced precision, high performance, outstanding results. Innovation covers integrated innovative solutions for creating new value. Partnership involves strong partnerships to develop successful projects.8
The MD GROUP’s vision is a management philosophy that explains the main aspects, allowing them to provide the best service and product in the sector. This philosophy is applicable to:
▪ Customers: Dedication to the client, to reach their satisfaction and, whenever possible, exceed their expectations;
▪ Human Resources: Motivation and information on behalf of human resources for greater collaboration and active participation in the life of the company; provision of the necessary resources for an internal environment that enables human and professional growth in the company;
▪ Quality: Commitment to the legal, regulatory, statuary, national and international standards and to meet the requirements of the management system (ISO 9001 and ISO 14001) and continuously improve the effectiveness of it;
▪ Environment: Commitment to protect the environment through the rational use of natural resources, in order to contribute to the reduction of environmental impacts. The values of the MD GROUP include the satisfaction of customers and employees, the creation of a long-term trust relationships with suppliers and the protection of the environment. These values are encompassed in the mission and vision of the MD GROUP.
2.3. Strategy of the MD GROUP
The MD GROUP presents itself as a group of companies which are ready to accept new challenges and to shape new ideas. Its strategy includes the creation of new value to the customers by increasing the company’s capacity and offering new solutions for the automotive industry; expanding the network in the countries with a developed automotive industry; diversifying the product range by creating all the necessary processing conditions to support the level of production.
9
2.3.1. MD Plastics’ strategic areas
To pursue the strategy of the MD GROUP, each company needs to follow its own strategic areas. MD Plastics’ strategic areas are:
▪ Improving satisfaction of employees and customers; ▪ Developing innovative products and technology;
▪ Expanding the network in the territory of the EU, choosing the countries with a developed automotive industry;
▪ Diversifying product range (Exterior plastic components, Lighting, Interior visible and non-visible plastic components);
▪ Creating all the necessary processing conditions for supported the level of production (clean and black rooms).9
9 “International strategic plan” and “MD Plastics – Global solutions for automotive lighting” [Online] Available from:
10
3. MARKET SEGMENTATION – A LITERATURE
REVIEW
This chapter is a literature review that focuses on the definition, importance of market segmentation. The overall aim is to identify and analyse the key approaches that can be adopted for the business-to-business market.
3.1. Relevance and definitions of market segmentation
The topic of the market segmentation has already been discussed by researchers in approximately 1.600 papers, published in the period from 1956 to 2000. From this total, 610 papers addressed the segmentation of the industrial market or business-to business as the alternative name (Boejgaard &Ellegaard, 2010). Market segmentation for business can be characterized by the following words: vital, critical and powerful (Goyat, 2011; Palmer & Millier, 2009; Sun, 2009,).
Sun, (2009:64) highlights the points as why market segmentation is a powerful marketing tool: “market segmentation helps marketers define customer needs and wants more accurately: market segmentation is useful for firms to find market opportunities; it helps companies master the features of target market”. He further discusses methods and conditions for customer and business markets based on case studies such as: Coca-Cola, Dell Corporation, Motorola Brand segmentation, Miller beer segmentation, Office Depot and Office Max of America in Japan.
In Weinstein’s work, (2004) he examines marketing executive’s application to psychographics as part of their target marketing strategy in business technology markets and emphasizes the objectives of the market segmentation strategy. The market segmentation strategy can include the overall objectives, such as: improving competition position the company and better serve the needs of the customers, and specific objectives, such as: increasing sales and market share, and enhancing the reputation of the company.
11 Taking this into account, it is safe to say that segmentation is the “most critical task for business-to-business marketers” (Palmer & Miller, 2009:779).
Furthermore, Diamantopoulsos et al., (2014:39), in their paper have investigated of export segmentation efforts and its effectiveness thought key drivers such as: export segmentation commitment, export segmentation strategy, number of segmentation bases. According to them “segmentation is particularly important in an export context because, firms operating internationally face markets that are more diverse than domestic markets; accordingly, international market segmentation is a means to manage diversity between and within those markets.”
The first approach to market segmentation appeared in the 1950’s and consequently, its first definition, proposed by an American professor of Marketing called Wendell R. Smith:
“… a heterogeneous market (characterized by divergent demand) as a group of smaller homogeneous markets, in response to the preference for different products among large segments of the market “(p.6, Smith, 1956).
Subsequent authors tried to further explain the concept of market segmentation by approaching it through different angles, although the basis is always the same.
According to Sun, (2009:228) refers to Lamb & McDaniel, (2003) “market segmentation is to divide a market into smaller groups of buyers with distinct needs, characteristics, or behaviors who might require separate products or marketing mix”.
According to Wind & Cardoso (1974), the market segmentation is as a group of present or potential customers with some common characteristic that is relevant in explaining and predicting their response to a supplier’s marketing stimuli.
To sum up all these definitions, another definition which may be appropriate for this study can be proposed by the author. Market segmentation is an action or process which helps to split the potential customers from all markets and select customers with similar needs and attributes. There are different criteria to split potential customers on business-to-customer market and business-to-business market.
12
3.2. The key approaches of the business-to-business market
There is no specific or unique process or method to be used in the business-to-business market segmentation. The criteria or variables that may be used in this process can vary according to the enterprises in question.
The segmentation in the business-to-business market should be adapted to the company’s marketing strategy as well as the conditions where it operates (Saha et.al., 2014).
The business market can be segmented in the same way as the business-to-customer market, by using variables such as demographic, geographic, psychographic and behavioral (Sun, 2009). However, it is important to note that business-to-business market segmentation is more restricted due to the specifications of this market, such as: the complexity of the product and services, complex purchasing decisions and identification of customers. “Not only are there many individuals involved in business-to-business setting, but also special justifications, authorizations, and approvals that often restrict the influence of personality on purchase decisions” (Barry & Weinstein, 2009:316).
Due to the complexity of modern business, “industrial market segmentation has become a necessary and creative process in order to protect and improve competitive positioning” (Masimov, 20017:17).
According to Harrison & Kjellberg, (2010) in business-to-business market segmentation, there are two significant approaches. The first approach is a two-stage segmentation: a macro and micro segmentation, presented by Wind & Cardoso (1974). Their research provides two samples: the first is a single segmentation and the second is a two-stage segmentation which acknowledges that segmentation is a great strategy for industrial market so as to achieve profit.
The first sample did not provide enough predictors of purchasing behavior (Verhallen et al., 1998) and therefore a second sample had to be created in order to provide better predictors. The second sample has included macro and micro levels of segmentation. The macro level focuses on both demographic and geographic variables, such as the scale of organization, industry and geographic location. The micro level includes: selection
13 criteria, structure of the purchasing center, decision-making process, categories of purchasing procurement organization and Research and Development (R&D).
Although, due to difficulty in implementing the two-stage segmentation, there was a need, later, to create a different approach.
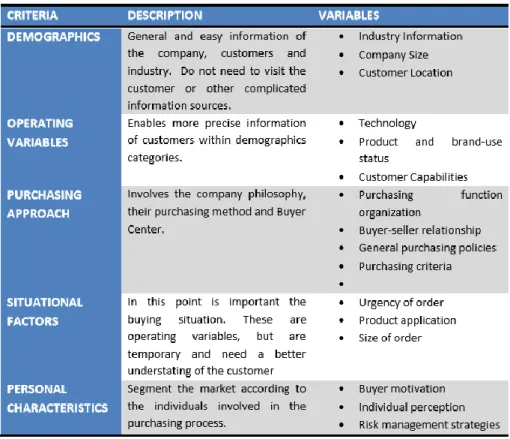
The other significant approach for business-to-business market is the nested approach presented by Bonoma & Shapiro (1984). This approach consists of five criteria: 1) demographics, which include variables such as: industry, company size, customer location; 2) operating variables which include elements such as: company technology, product or brand use status, customer capabilities; 3) purchasing approaches which include: purchasing function, power structure, buyer-seller relationships, purchasing policies, purchasing criteria; 4) situational factors: urgency of order, product application, size of order and 5) buyers’ personal characteristics: character, approach. The nested approach is presented in Figure 4.
Figure 4. Nested approach criteria, description and variables
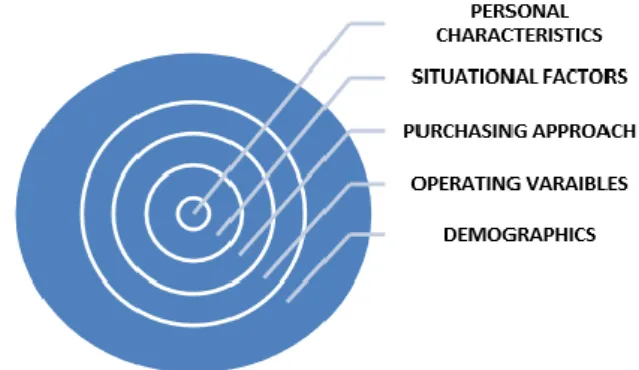
14 The main idea of this approach is to go from the outer nest to the inner nest, where the outer nest requires less specific information whereas the inner nest requires more specific information. It is not necessary to use all criteria, in the sense that some of the nests may not present relevant information. Figure 5 shows the schematic layout of the nested approach.
Figure 5. Nested approach
Source: Montejo (2013:38) in Bonoma & Shapiro, (1984)
In this study two approaches were analysed: one, the two-stage approach which includes the macro and micro levels and the other a nested approach. Some criteria from the nested approach was considered appropriate for a customer database which was created for the automotive industry in the potential market: the Czech Republic, France, Germany, Italy and Spain. Obviously, it is possible to state that both of approaches similarities with some of the variables, but this choice was due to a large range of variables which exists in nested approach.
15
4. FEATURES OF THE POTENTIAL MARKET: THE
CZECH REPUBLIC, FRANCE, GERMANY, ITALY
AND SPAIN
This chapter presents the features of the potential market. It is divided in two parts: macroeconomic factors analysis and level of development of the automotive industry. The first part deals with the population changes, unemployment rate, Gross Domestic Product (GDP) growth and GDP per capita, foreign trade (imports, exports and balance of trade). The second part deals with the level of development of the automotive industry in the potential market. As the demand in the automotive market dictates the level of production, the manufacturing and registration of new cars was also analysed.
In addition, the author would like to note that the countries mentioned hereafter, in tables or graphs, were put in alphabet order without any priority.
4.1. The macroeconomic factors’ analyses
The European Union is an economic and political union of 28 European countries among which Portugal, the Czech Republic, France, Germany, Italy and Spain. The EU has developed a unified policy in the field of trade, regional development, and agriculture. One of the features of the EU is the free trade between country-members, that create a single market. Free zones are special areas within the customs territory of the Community. Goods placed within these areas are free of import duties, Value Added Tax (VAT) and other import charges. The free movement of people, goods, capital and services is guaranteed by the common market (the form of economic integration of countries), which was created with the help of a standardized system of laws operating in all countries of the Union. This EU free zone accepts the circulation of a single currency in 19 countries belonging to the EU - the euro (except Bulgaria, the Czech Republic, Hungary, Poland,
16 Romania, Sweden, the United Kingdom and Denmark with ‘opt-out’ clauses in the Treaty exempting them from participation).10
Demographic changes and unemployment rate.
On 1 January 2017, the population of the EU was estimated at 511.8 million, compared with 510.3 million on 1 January 2016. In 2016, the EU recorded approximately the same number of births and deaths, which indicates the neutrality of the natural change of the EU population. Consequently, the change in the population is due to net migration.11
According to Eurostat, Germany is the most populated EU Member State (82.8 million or 16.1%), ahead of France (67.0 million, or 13.1%), Italy (60.6 million, or 11.9%), Spain (46.5 million, or 9.1%) and the Czech Republic (10.6 million or 2.1%).
Against this backdrop, only Italy stands out with a negative population growth rate (-1.3%) which is expected to decline over the next 3 decades as the country already has a death rate that exceeds its birth rate along with negative migration.12 The figures of the demographic
changes in the potential market is presented in the Table below.
Table1. Demographic changes in the potential market, January 2016 - January 2017
Source: Eurostat, 2017
10EU Countries and the euro, European Commission [Online] Available from:
https://ec.europa.eu/info/business-economy-euro/euro-area/euro/eu-countries-and-euro_en accessed: [05.07.17]
11Eurostat news release nº 110/2017 – 10 July 2017[Online] Available from:
http://ec.europa.eu/eurostat/documents/2995521/8102195/3-10072017-AP-EN.pdf/a61ce1ca-1efd-41df-86a2-bb495daabdab accessed: [14.07.17]
12Word Population Review – Italy http://worldpopulationreview.com/countries/italy-population/ accessed: [17.07.2017]
Population on the 1 of January 2016 (1 000) Population on the 1 of January 2017 (1 000) Surface area (km2 ) Change 2016/2017 (1 000) Share in EU population (%)
The Czech Republic 10 553.8 10 578.8 78 868 + 2.4 2.1
France 66 750.0 67 024.5 633 187 + 4.0 13.1
Germany 82 175.7 82 800.0 357 376 + 7.6 16.1
Italy 60 665.6 60 589.4 302 073 - 1.3 11.9
17 Another sign of macroeconomic stability or instability is the existence and periodic growth or decline of unemployment in society, where the working - age population (15 to 64 years) cannot find work. Unemployment has become an indispensable companion of a market economy. Its level is unstable and varies for many reasons, but it never falls to zero. Considering the information above, these changes in the demographic structure of the population can affect the probability of unemployment increase. However, the European Commission reported the euro area seasonally-adjusted unemployment rate was 9.3 % in May 2017, which was considered stable compared to April 2017 and lower than 10.2% in May 2016. The EU unemployment rate was 7.8 % in May 2017 which was considered stable compared to April 2017 and down from 8.7 % in May 2016. Among the country-members of the EU, the lowest unemployment rates in May 2017 were recorded in the Czech Republic (3.0 %) and Germany (3.9 %). The highest rate was observed in Spain (17.7 %).13
Gross Domestic Product.
In terms of the level of the real GDP in 2016 for each country, Germany takes the lead with 3.34 trillion euros, followed by France with 2.255 trillion euros, Italy with 1.672 trillion euros and Spain with 1.114 trillion euros, and accordingly the last place in this list is occupied by the Czech Republic with 174.412 billion euro. These figures were issued by Eurostat, the statistical office of the European Union and the World Bank. For the year 2016, the economy of France, Germany and Italy grew by 1.2%, 1,9% and 0,9% respectively. The Czech Republic economy decreased from 5,3% in 2015 to 2.6% in 2016. The growth of Spain in 2016 was the most dynamic among the EU countries with 3.2%, but did not bring any dramatic changes because of the huge public debt, which is almost the size of the economy (99,0% of GDP).14 Figure 6 presented below shows the tendency of GDP annual growth of the potential market: the Czech Republic, France, Germany, Italy and Spain.
13 Eurostat news release 103/2017– 10 July 2017 [Online] Available from
http://ec.europa.eu/eurostat/documents/2995521/8094245/3-03072017-AP-EN.pdf/aced038e-2af1-4a7a-a726-7e8d20d840c0 accessed: [17.07.2017]
18
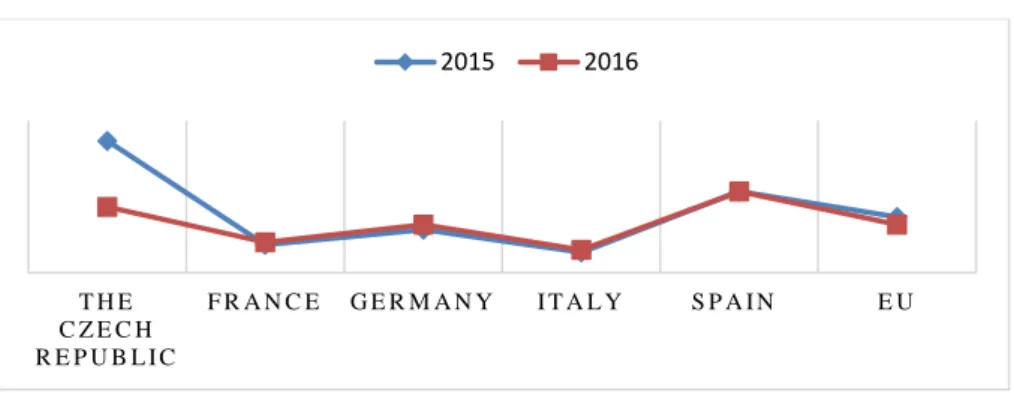
Figure 6. GDP growth (%) for 2015 and 2016
Source: Eurostat, 2017
The indicator GDP per capita in purchasing power standards (PPS) is one more measurement of a country’s economic development. Regarding the GDP per capita in PPS index in the potential market, Eurostat statistical data shows that in 2015 the index in the Czech Republic was 87 and this increased in 2016 to 88 of the EU set average (100); for France, the index was 107 in 2015 and fell by 2 points in 2016. Germany’s GDP per capita in PPS index is at a current level of 123 (2016) which shows a decrease from 124 (2015). Despite the GDP per capita in PPS index decrease in Germany and France their figures are higher than EU set average. For Italy, the GDP per capita in PPS index in 2015 and in 2016 was 96 of the EU set average. For Spain, the index was 90 in 2015 and increased to 92 in 2016. All these figures presented in Table 2.
Table 2. GDP per capita in PPS, for 2015 and 2016
2015 2016
The Czech Republic 87 88
France 107 105 Germany 124 123 Italy 96 96 Spain 90 92 EU 100 100 Source: Eurostat, 2017 T H E C Z E C H R E P U B L I C F R A N C E G E R M A N Y I T A L Y S P A I N E U 2015 2016
19 Foreign Trade.
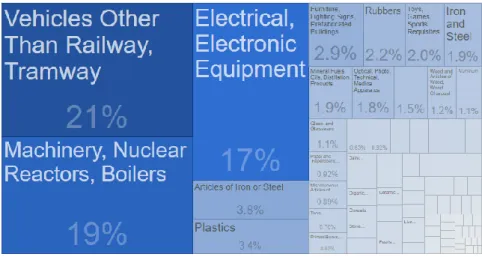
The Czech Republic’s economy is one of wealthiest and most stable in Post-Soviet Europe. It is one of the most developed industrialized economies, but remains vulnerable to external shocks due to its dependence on exports and inflows of foreign direct investment.15 The trade surplus declined to 10.078 million euros in July of 2017 from 11.275 million euros surplus a year earlier. The exports increased to 76.286 million euros (83.7% of GDP), boosted by sales of machinery and transport equipment, manufactured goods, manufactured articles and related chemicals products. The main categories in 2016 in terms of the product exportation were: vehicles, tramway and others (21%); machinery, nuclear reactors, boilers (19%); electrical, electronic equipment (17%); articles of iron or steel (3,8%); plastic (3,4%) among others (see Figure 7).
Figure 7. The Czech Republic’s exports by product category, 2016
Source: Trading Economics, 2016
Note: These kinds of figures that represented are without black and white background, since have taken from Trading Economics website by print screen.
According to statistical data of the Ministry of Industry and Trade of the Czech Republic the main export partners in July 2017 were Germany with 32.7% (compared to 32.4% in July 2016), followed by Slovakia with 7.6% (compared to 8.4%). Imports surged to 81.014 million euros in July 2017 from 73.735 million in July 2016, mainly due to purchases of machinery and transport equipment. Most imports came from Germany and China.16
15OEC, The Observatory of economic complexity [Online] Available from: http://atlas.media.mit.edu/en/profile/country/cze/ accessed: [05.07.2017]
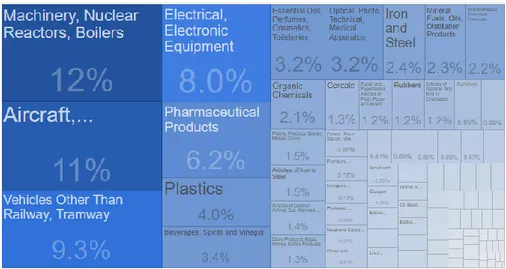
20 The France trade deficit widened to 6.0 billion euros in July of 2017. It was the largest trade deficit since February 2017, as imports in July 2017 increased to 45.3 billion euros from 41.439 billion euros in July 2016 and while exports rose slowly from 37.465 billion euros to 39.3 billion euros in July 2017. Exports increased by sales of aircraft; automotive products; chemicals product.17 The main categories in 2016 in terms of the
product exportation were: machinery, nuclear reactors, boilers (12%); aircraft, spacecraft (11%), vehicles and others (9.3%); electrical, electronic equipment (8%); pharmaceutical products (6.2%) among others (see Figure 8).
Figure 8. France exports by product category, 2016
Source: Trading Economics, 2016
The main categories in 2016 in terms of the product importation were: machinery, nuclear reactors, boilers (12%), vehicle and others (11%); electrical and electronical equipment (9.2%); mineral fuels and others (8.4%); aircraft and spacecraft (6%); pharmaceutical products (3.9%); plastic product (3.9%) among others18 (see Figure 9).
17https://tradingeconomics.com/france/exports accessed: [12.08.2017]
21
Figure 9. France imports by product category, 2016
Source: Trading Economics, 2016
Germany notched up its biggest ever trade surplus in 2016. A climb in exports helped push Germany’s already mega trade surplus to 252.9 billion euros in 2016 from 244.3 billion euros in 2015.19 Considering January to July 2017, the trade surplus was registered at
122.04 billion euros, which increased from 148.38 billion euros in the same period in 2016.
Germany’s main export partners are France, the United States of America (USA) and the United Kingdom (UK) while its main import partners are the Netherlands, France and China.20
The main categories in 2016 in terms of the product exportation were: vehicles and others (18%); machinery, nuclear reactors and boilers (17%), electrical and electronic equipment (10%); pharmaceutical products (5.8%), optical, medical, photo and technical apparatus (4.9%); plastic (4.6%) among others21(see Figure 10).
19https://www.ft.com/content/ac9f9faa-d2a1-3df7-a8d9-a2ef1ce65d4b accessed: [12.09.2017]
20https://europa.eu/european-union/about-eu/countries/member-countries/germany_en accessed: [05.07.2017] 21https://tradingeconomics.com/germany/exports-by-category accessed: [12.09.2017]
22
Figure 10. Germany exports by product category, 2016
Source: Trading Economics, 2016
The main categories in 2016 in terms of the product importation were: machinery, nuclear reactors and boilers (13%), electrical and electronic equipment (12%), vehicles and others (10%); mineral fuels and oils (7.4%); pharmaceutical products (5.8%); optical, medical, photo and technical apparatus (4.9%); plastic (4.6%) among others (see Figure 11).
Figure 11. Germany imports by product category, 2016
23 Italy's trade surplus narrowed to 45 billion euros in June 2017 from 46.6 billion euros in the same month of the previous year. 22 Exports from Italy increased from 36, 543.005 billion euro in June 2016 to 40, 909.670 billion euros in June 2017 due to sales of metals and metal products, coal and refined petroleum products, chemicals, transport equipment. Imports in Italy increased from 31882.441 billion euros in June 2016 to 35039.11 billion euros in June 2017.
The main categories in 2016 in terms of the product exportation were: machinery, nuclear reactors and boilers (20%); vehicles and others (8.5%); electrical and electronic equipment (6%); pharmaceutical products (4.6%); plastic (4.1%); articles of iron and steel (3.5%) among others (see Figure 12).
Figure 12. Italy exports by product category, 2016
Source: Trading Economics, 2016
The main categories in 2016 in terms of the product importation were: vehicles and others (11%); mineral fuels and oils (10%); machinery, nuclear reactors and boilers (10%); electrical and electronic equipment (7.7%); pharmaceutical products (5.3%); plastic (4.5%); iron and steel (3.6%) among others23(see Figure 13).
22https://tradingeconomics.com/italy/balance-of-trade accessed: [10.07.2017] 23https://tradingeconomics.com/italy/imports-by-category accessed: [12.07.2017]
24
Figure 13. Italy imports by product category, 2016
Source: Trading Economics, 2016
In 2016, the trade deficit in Spain amounted to about 18.3 billion euros which respectively decreased from 29.5 billion euros compared to the previous year. In July of 2017 Spain's trade deficit increased to 2.10 billion euros. The volume of exports in July 2017 was 22.19 billion euros and imports was 24.29 billion euros. 24
The main categories in 2016 in terms of the product exportation were: vehicles and others (19%); machinery, nuclear reactors and boilers (7.8%); electrical and electronic equipment (5.6%); mineral fuels and oils (3.9%); pharmaceutical products (3.8%); plastic (3.8%) among others (see Figure 14).
Figure 14. Spain exports by product category, 2016
25
Source: Trading Economics, 2016
The main categories in 2016 in terms of the product importation were: vehicles and others (14%); mineral fuels and oils (11%); machinery, nuclear reactors and boilers (10%); electrical and electronic equipment (8.1%); pharmaceutical products (4.6%); plastic (3.5%) among others (see Figure 15).
Figure 15. Spain imports by product category, 2016
Source: Trading Economics, 2016
Considering the macroeconomic factors such as demographic changes and unemployment rate, GDP indicators, foreign trade through those have tried to show the level of development of the potential market, mainly the Czech Republic, France, Germany, Italy and Spain. It was attempted to understand each country trade orientation and to analyse existing possibility to increase export for potential market. At the same time one more factor that can demonstrate the economic develop is level of development the automotive and construction industries. The level of development of the automotive industry in context of this research will propose in section below.
4.2. The automotive industry of the potential market
The automotive industry has recently faced major changes that have transformed the entire sector. The main trends include constant pressure on automakers to reduce costs and increase production efficiency in the same time when supply chains are increasingly complex. The nature of the automotive industry’s supply chain greatly differs from most other industries. Regardless of the complexity of the process the automotive industry is
26 very important for each country and for every region. It contributes significantly to the upstream industries such as steel, chemicals, and textiles, as well as downstream industries such as repair and mobility services.25
The automotive industry for the European economy is an important contributor and obviously, the facts are the best evidence. According to the Automobile Industry Pocket Guide 2016-2017 of the European Automobile Manufacturers Association (ACEA) it was reported that about 12.5 million Europeans now work directly or indirectly in the automotive sector, representing 5.7% of total EU employment. According to estimates, the sector directly employed over 2.3 million people in the manufacturing process over this period. Moreover, the automotive sector has created about 3.1 million jobs.
According to the statistical data obtained from ACEA, in 2015 the direct automotive employment in the Czech Republic amounted to 159.732 jobs, in France with 224.000 jobs, in Germany with 850.857 jobs, in Italy with 159.148 and in Spain with142.480 jobs (see Figure 16).
Figure 16. Direct automotive manufacturing employment in the potential market, 2015
Source: ACEA, 2016
The Automotive industry generates a trade surplus of 100.4 billion euros for the EU. In 2016, the EU exported approximately 5.5 million passenger cars worth around 125 billion euros. The main export partners with a market share are the USA (30.2%), China (15.8%),
25https://ec.europa.eu/growth/sectors/automotive_pt accessed: [20.07.2017] 159.732 224.000 850.857 159.148 142.480 Czech Republic France Germany Italy Spain
27 Turkey (6.2%), Switzerland (5.9%), Japan (5.9%), South Korea (4.6%), Australia (3.7%), Canada (3.1%), Norway (2.7%), Russia (2.3%) and rest of the world (19.6%) (see Figure 17).
Figure. 17 Destinations for EU passenger car exports, 2016
Source: ACEA, 2016
Almost 2.9 million passenger cars were imported to the EU in 2016, worth around 38 billion euros. The main import partners with a market share are the USA (19%), Turkey (16.8%), Japan (23.9%), South Korea (12.6%), South Africa (7.9%), Mexico (5.8%), Morocco (4.1%), India (2.7%), Serbia (2.6%), Thailand (1.2%) and rest of the world (19.6%). The main countries of origin of EU passenger car imports with a market share are presented in Figure 18.
Figure 18. Countries of origin of EU passenger car imports, 2016
Source: ACEA, 2016 USA 30.2% China 15.8% Turkey 6% Switzerland 6% Japan 6% South Korea 4% Australia 4% Canada 3% Norway 3% Russia 2% Rest of the world 19.6% USA 19% Turkey 16.8% Japan 23.9% South Korea 12.6% South Africa 7.9% Mexico 5.8% Morocco 4.1% India 2.7% Serbia 2.6% Thailand 1.2% Rest of the world 3.3%
28 The production of passenger cars in the EU has long been on the rise, and in 2016 it reached 19.2 million motor vehicles. The Czech Republic amounted 1.342.920 units, France with 2.138.122 units, Germany with 6.126.206 units, Italy with 1.081.074 units and Spain with 2.923.064 units (see Figure 19).
Figure 19. Production of passenger cars in the EU in the potential market, 2016
Source: ACEA, 2016
On the market side, over the first half of 2017, the EU demand for passenger cars grew 4.7%.26 Figures of the registration of vehicles in the EU in June 2017 reached 1,491.003
units compared to 1,460.390 units in the same month the previous year. Germany positions itself as the largest automotive market. The level of registration of passenger cars decreased from 339.563 in June 2016 to 327.693 units in June 2017. A greater growth has been achieved by Spain with an increase from 123.790 in June of 2016 to 131.797 in June 2017. Italy, France and the Czech Republic respectively achieved figures of 187.642, 132.797 and 26.634 units in June 2017 (see Figure 20).
26http://www.acea.be/press-releases/article/passenger-car-registrations-4.7-during-first-half-of-2017-2.1-in-june accessed [12.07.2017] 1,342.920 2,138.122 6,126.206 1,081.074
2,923.064 the Czech Republic
France Germany Italy Spain
29
Figure 20. The passenger cars' registration in the potential market, June 2016 - June 2017
Source: ACEA, 2016
Despite the positive indicators of the automotive industry, experts have predicted an unstable situation in the next couple of years.27 According to KPMG’s Global Automotive Executive Survey, 2016 such assumptions are based on external factors, such as: economic crisis (56%), political changes (28%), raw material costs (44%), oil price volatility (40%), war and terrorism (27%), natural disasters (26%) and due to demographic developments, which may have an influence on the demand (30%).
27http://www.acea.be/press-releases/article/passenger-car-registrations-4.7-during-first-half-of-2017-2.1-in-june accessed [21.07.2017] 25714 227353 339563 166232 123790 26634 230926 327693 187642 131797 The Czech Republic France Germany Italy Spain June 2017 June 2016
30
5. RESEARCH METHODOLOGY
The objective of this chapter is to describe the research purpose, the research process, the data collection methods, as well as the sample and the research methodology strengths and weaknesses.
5.1. Research purpose
The purpose of the study is to create a customer database and understand the potential market according to the requirements of MD Plastics. The potential market includes countries such as: the Czech Republic, France, Germany, Italy and Spain. All these countries were defined by the company as priority markets in the automotive industry.
5.2. Research process
The research process provides guidance to better understand how this internship report was structured. The research process consisted of five stages.
The first stage was to establish the research aim for MD Plastics. A meeting took place at MD Plastics in Valado dos Frades, Nazare with both supervisors: the IPL professor and the Operational Director of the company. The purpose of this meeting was to understand the expectations and needs of the company in order to integrate the intern appropriately.
The second stage was to understand the strategic focus of the company, services and product that are provided by MD Plastics, its mechanisms of operation and cooperation with other companies of the MD GROUP. In this stage, the existing customers were also analysed.
The third stage focused on the theoretical basis which served as a starting point for the beginning of the creation of a customer database. In this stage, definitions of market segmentation and the selection of the criteria of business-to-business market segmentation were identified and analysed.
31 The fourth stage explored the level of development of the Czech Republic, France, Germany, Italy and Spain, and subsequently, economic market prospection was carried out.
The fifth stage considered gathering information and recommendations from the sales manager of MD Plastics for the creation of the customer database according to the needs of the company (see Figure 21).
Figure 21. Research process
Source: Established by the author
5.3. Data collection methods and techniques – secondary data
collection
For any kind of research whether quantitative or qualitative research, should indicate the methods for collection data.There are a variety of methods of data collection in qualitative research. It can include observations, textual or visual analysis and interviews (Silverman, 2000). The interviews and focus group are common methods of data collection in qualitative research. In this study, secondary data collection as research methods were chosen. This method is adequate for researchers who may have limited time or money. Secondary data analysis includes a critical revision of primary collected data in area of interest. It provides for the author possibility of reapplication and re-interpretation of existing material. It allows to re-analysis and construct new ideas (Johnston, 2014).
Research purpose statment MD Plastics' strategy, resources, capabilities and competences Market segmentation theory
Market research on the automotive industry
and level of the development of the
potential market A customer database
32 This study illustrated a theoretical framework on market segmentation which includes definitions and describes the importance of market segmentation, appropriate variables in a business-to-business context. The literature used was taken from data bases b-on and Google Scholar by key words. The key words used: market segmentation, industrial market and business-to-business market. The journals and magazines (Journal of Marketing, Journal of Business and Management, Journal of Industrial Marketing Management, European Journal of Business and Management, Journal of Business-to-Business Marketing) and newspapers (Jornal de Leiria – Revista Moldes e Plásticos) were sourced. The selected sources of the literature review cover the period from September 2016 to June 2017. In order to understand the business environment and strategy of the MD GROUP, especially MD Plastics, data were gathered from their internal sources such as: websites, the system management manual of MD Plastics for the year 2016, the HR Organigramme, the presentation of the company, MD Plastics projects of participation in Compete 2020 and Portugal 2020.
In order to understand the features of the potential market, statistical data were collected from Eurostat, Word Bank Group, OECD and Trading Economics. For the collection data to create a customer database the data from automotive associations (the Automotive Industry Association of the Czech Republic (AIA), the French Association of Vehicle Manufacturers (CCFA), the German Association of the automotive Industry (VDA), the Italian Association of Automotive Industries, (ANFIA) and the Spanish Association of Vehicle Manufacturers, (ANFAC)) and the web-sites of the potential customers were used. Secondary data can be collected from various sources for different purposes.28 Secondary data may help to get more acquainted with the situation in the company, the industry and the existing trends in the market. Secondary data can present advantages and disadvantages (Malhotra, 2009):
Advantages of secondary data. There are five advantages of secondary data: ▪ it can be quick to find;
▪ it is cost effectiveness and convenience; ▪ secondary data, as usual, is available;
▪ it complements the sets of primary data and with one source you may immediately solve the task.
33 Disadvantages of secondary data. Despite providing greater value for research, secondary data has several drawbacks. The main disadvantage of secondary data is that this data was originally collected to solve another problem which may not necessary be directly connected to the problem in hand. Accordingly, it is likely to be outdated, incomplete and unreliable (Malhotra, 2009).
However, because secondary data are collected for a different purpose, one must carefully evaluate it (Mulhern, 2010). According to Johnston (2014:622), with reference to Stewart & Kamins (1993), the researcher should evaluate a primary data and its results by the questions “(a) what was the purpose of this study; (b) who was responsible for collecting the information; (c) what information was actually collected; (d) when was the information collected; (e) how was the information obtained; and (f) how consistent is the information obtained from one source with information available from other sources”. According to Rodrigues (2002:183), “validity and reliability concerns the method of collection and the source of the secondary data”. For ensuring reliability criteria in the current study, data, mainly, from official institutions, were used. Their methodology of data collection are known, so consequently credible. To ensure validity of the criteria several secondary sources were used and verified by examine the context in which the primary data were collected.
5.3.1. The sample of a customer database creation
The sample of a customer database consisted of 48 companies from different countries such as: the Czech Republic, France, Germany, Italy and Spain. Thirty companies from Germany, four companies from the Czech Republic, four companies from Spain, five companies from Italy and five companies from France.
These companies were taken from different associations such as: The Automotive Industry Association of the Czech Republic (AIA), the French Association of Vehicle Manufacturers (CCFA), the German Association of the automotive Industry (VDA), the Italian Association of Automotive Industries, (ANFIA) and the Spanish Association of Vehicle Manufacturers, (ANFAC) were taken. The total number of members of all of these associations is around 2281. This number includes Original Equipment Manufacturer (OEM), tier 1 organizations (the large organizations, component suppliers of the parts and
34 accessories, which supply all these products to OEM) and tier 2 and 3 (much smaller organizations, which supply to organizations in tier 1). Considering the requirements of MD Plastics that include geographic position of the potential customers and their position in the supplier chain as tier 1 organization which corresponded large companies were found out. However, some companies from this total number of members no mentioned on their web-sites information about its position in the supplier chain. So, for evaluation the size of the potential customer’s company as a large company, the turnover and number of employees were used. But and in this case, was existed the same problem. It is reason that from 2281 companies 48 companies were selected. Substantially, this selection based on choose customers from component supplier division or supply parts and accessories, but French, Italian and Spanish associations no included that kind of division. It was long process to check all companies from list of the associations.
5.4. Strengths and weaknesses of the research methodology
The data collection provides the identification and comprehension of the demography, economic, trade aspects and the automotive industry in the EU countries, mainly in the potential market. One the strengths of the study were identified as a covered period from 2010 to 2017, as well as the level of development of the required countries, specifically in the automotive industry. The weaknesses have revealed during the creation of the customer database, mainly at the stage of selecting customers for the database. So, some variables could not be found due to limited information about the enterprise’s business size, both in terms of its financial information and Human Resources.
35
6. FINDINGS AND DATA ANALYSIS – CUSTOMER
DATABASE CREATION
This chapter presents the creation of a customer database. Based on the literature reviewed, segmentation was carried out. This segmentation was used in the automotive industry. To create a customer database, the following variables were chosen: the product, the country, size of the company, the year of foundation, number of employees and its turnover. The client's location, address, contacts (e-mail, phone number, fax, postal codes) were also considered.
The next task set by MD Plastics was to apply the chosen strategy of communication, such as the presentation of MD Plastics through direct mail, but in the process, there were some changes that are described in the section " The company contacts with potential customers".
6.1. The market segmentation: variables used
The current study was based on the geographic and demographics criteria, operating variables and purchasing approach as they were the most suitable segmentation bases for the automotive industry.
For the geographic criteria, the potential market was chosen as a target market, which includes follow countries: the Czech Republic, France, Germany, Italy and Spain. For the geographic criteria the customer location, contacts were used as variables.
For the demographics criteria identified the industry, the company size was taking into account followed by information such as the number of employees, the turnover, and the year of foundation. All these variables listed above helped to better understand the size of the enterprises.
The product as the operating variable was chosen. This variable allows to understand the profile of the company and what products it manufactures. The range of products was divided as follows: exterior with lighting part, interior visible and interior non-visible parts.
36 The Figure below shows the range of products. Let it be understood that it is a non-exhaustive list.
Figure 22. Product range
Source: Established by the author using Google
The purchasing approach criteria. For these criteria, the purchasing policy of the potential customers was used. It is mean the potential customer would like to purchase the plastic items that are produced with the help of injection moulding process. For example, the German company “BROSE” whose core competence is to provide electrical and electronic systems to automotive manufacturers. At a first glance, it is not clear which products from range the company produces. Therefore, it is necessary to clarify this and to go directly to the essence of the matter and search within the purchasing policy. It is in this section that the products and technologies that they would like to buy and could be offered by MD Plastics are described (see Figure 23).