DOES SPORTING PERFORMANCE INFLUENCE
PORTUGUESE FLOATED CLUBS' STOCKS REVENUES?
Ricardo Silva Beato
Dissertation submitted as partial requirement for the conferral of Master in Finance
Supervisor:
Prof. Dr. Luís Miguel da Silva Laureano, Auxiliary Professor, ISCTE Business School, Finance Department
II
Aknowledgements
I would like to thank Professor Luís Laureano for the recommendations, supervision and kindness of assuring this thesis was finished in time and with the desirable quality despite my absence sometimes.
A big acknowledgement to Professor José Carlos Dias for the debates over the Portuguese stock market and being the one that initially gave me the idea to study this subject in my thesis given my interest and to José Dias Curto for helping up with the econometric work and patient explanations.
I wanted to dedicate this thesis to the ones closer to me and say “thank you” out loud to my family for the financial effort and constant moral support and preoccupation everything was done right on time and correctly.
III
Resumo
O estudo aqui presente visa enriquecer a existente literatura no que concerne a relação entre o futebol português e a bolsa de valores. Recorrendo ao método de estimação OLS e a modelos da família ARCH, procuro explicar a variação do valor e variância das ações dos três grandes clubes portugueses de futebol mediante a sua performance desportiva para o período 2000-2014 para o Sporting Clube de Portugal e Futebol Clube do Porto e 2007-2014, para o Benfica, aquando da sua entrada em bolsa. Também realizei o controlo das expetativas do mercado ao usar os valores de apostas desportivas como aproximação e a importância marginal de cada ponto obtido numa partida com a variável “pontos relativos até à vitória”. As conclusões ditam que não há um padrão geral de ligação entre os dois mundos e expeculo que, sendo um mercado pequeno, em Portugal a compra de ações destas empresas seja mais guiada pelo coração.
Palavras-chave: reacções do preço das acções, finanças desportivas, mercado de apostas, futebol português
Classificação JEL: G1 General Financial Markets, G14 Information and Market Efficiency, Event Studies
IV
Abstract
The present study delves into the existing literature regarding the relationship between Portuguese football and its stock market. Using the OLS method of estimation and models of the ARCH family, I seek to explain the variation of the value and variance of the three major Portuguese football clubs recurring to their sporting performance for the period 2000-2014 for Sporting Clube de Portugal and Futebol Clube do Porto and 2007-2014 for Sport Lisboa e Benfica, by the time it was floated. I have also employed variables used in previous research, namely; betting odds as the proxy for market’s expectations and the marginal importance of each earned point in a game with the “relative points to victory” variable. The conclusions do not exhibit a clear pattern for the link between both worlds and I speculate that, given the small dimension of the market, emotions are the biggest driver for football shares’ price.
Keywords: share price reaction, sporting finance, betting market, Portuguese football (soccer)
JEL Classification: G1 General Financial Markets, G14 Information and Market Efficiency, Event Studies
V
Index
Executive summary ... 1 1. Introduction ... 3 2. Literature review ... 7 3. Data ... 18 4. Methodology ... 215. Results and discussion ... 29
6. Conclusion ... 49
7. Bibliography ... 51
VI
List of tables
Table 1 - Sample period and number of observations ... 20
Table 2 - Implied probabilities on a game (average bookmakers’ odds) ... 23
Table 3 - Fair probabilities implied on a game ... 24
Table 4 - Bookmakers and verified probabilities (average bookmakers’ odds) ... 25
Table 5 - Club's price decrease ... 30
Table 6 - Clubs' mean and standard variation per season ... 32
Table 7 - VIF: FCP's Portuguese games regression ... 36
Table 8 - VIF: SCP's Portuguese games regression ... 37
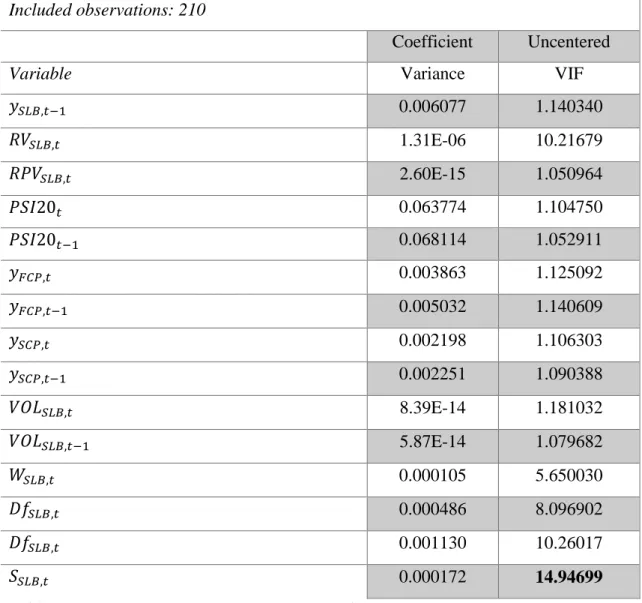
Table 9 - VIF: SLB's Portuguese games regression... 38
Table 10 - OLS Regression - FCP (Portuguese games) ... 40
Table 11 - OLS Regression - SCP (Portuguese games) ... 41
Table 12 - OLS Regression - SLB (Portuguese games) ... 42
Table 13 - OLS Regression - FCP (European games) ... 43
Table 14 OLS Regression - SCP (European games) ... 44
Table 15 - OLS Regression - SLB (European games) ... 45
Table 16 - GARCH (1,1) regression for SCP ... 47
Table 17 - ARCH (1) regression for FCP ... 48
Table 18 - White and Breusch-Godfrey tesBts - FCP (Portuguese games) ... 64
Table 19 - White and Breusch-Godfrey tests - FCP (European games) ... 64
Table 20 - White and Breusch-Godfrey tests - SCP (Portuguese games) ... 64
Table 21 - White and Breusch-Godfrey tests - SCP (European games) ... 65
Table 22 - White and Breusch-Godfrey tests - SLB (Portuguese games) ... 65
Table 23 - White and Breusch-Godfrey t ... 65
Table 24 GARCH (1,1) regression for SCP ... 66
VII
List of figures
Figure 1- FCP's returns ... 29
Figure 2 - SCP's closing prices ... 29
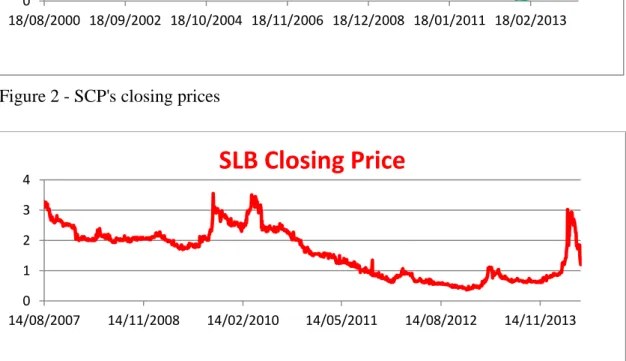
Figure 3 - SLB's closing prices ... 29
Figure 4 - FCP's daily continuously compounded returns ... 31
Figure 5 - SCP's daily continuously compounded returns ... 31
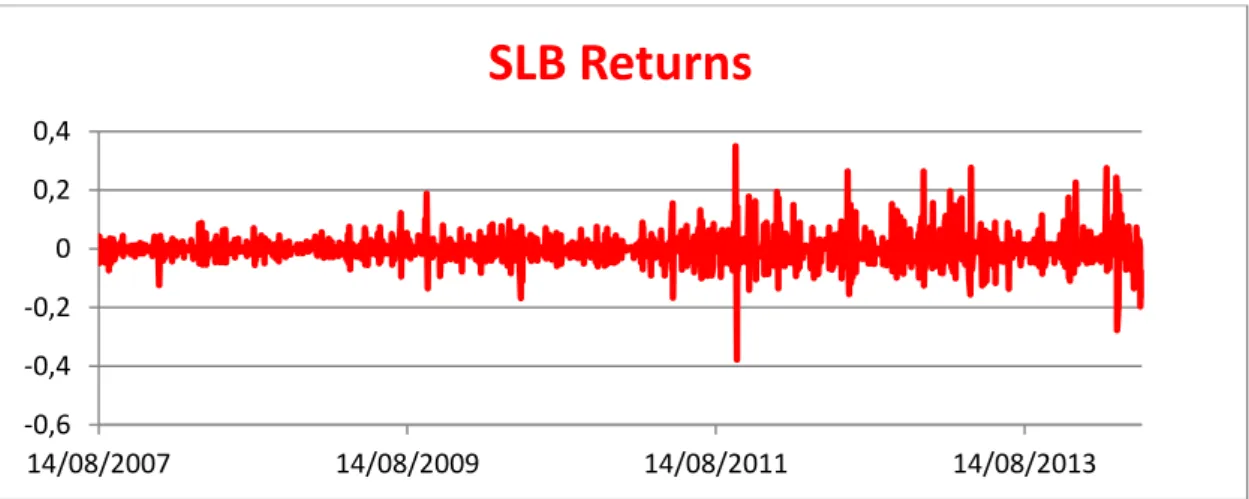
Figure 6 - SLB's daily continuously compounded returns ... 31
Figure 7- Clubs’ transfers’ numbers, source: http://www.futebol365.pt/ ... 33
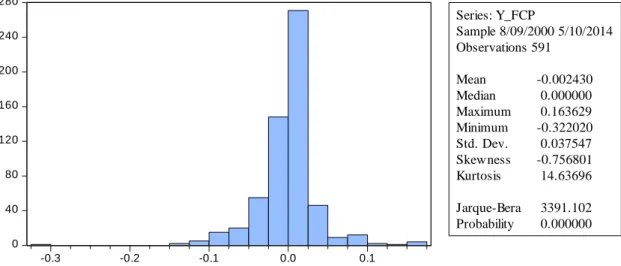
Figure 8- FCP's histogram and descriptive statistics ... 34
Figure 9 - SCP's histogram and descriptive statistics ... 34
1
Executive summary
Portuguese football has long been acclaimed in the European kern. Even though not in par with world powers such as Brazil or Spain and Germany, relevant successes include a presence in the final of Euro 2004 (organized in Portugal) and two years later in the semifinal stage of the world Cup (having taken place in Germany to whom Portugal lost the 3rd place). At the clubs level, some appearances in final stages of the UEFA competitions and an Intercontinental Cup victory for Porto in 2004 endorse these historic accomplishments. Also, far from the European spotlights, resides the Portuguese stock market and the clubs there quoted in what concerns capitalization, daily trading volumes and takeover bids.
This thesis proposes to evaluate the 3 major Portuguese football clubs’ (Futebol Clube do Porto, Sporting Clube de Portugal and Sport Lisboa e Benfica) impacts of sporting (athletic) performance over their stocks returns.
The motivation for this theme came intrinsically from the fact that I have invested on my own in Benfica’s shares. After observing irregular and inexplicable behavior in the stocks around March (2014), I have decided to take the opportunity of the master thesis to deepen my knowledge in this area and simultaneously find some answers for so while contributing to the research done so far in Portugal and providing other investors some topics of analysis and thinking.
The path for the creation of this study was within the possible, coherently distributed along an initially planned timeline. Some deviations were taken, having spent some more time with data mining from what was initially predicted but perfecting the final output to be as accurate as possible. The first step was to read what was already done in this field and if possible extract some ideas using them as a starting point. The next step was to create a range of variables that I assumed would be useful to explain shares returns. I still believe the later depend not only on the sporting results but also, maybe to a very small degree on economic results. Football clubs tend to be utility rather than profit maximizers and with this said, finance and economic news (translated into gate receipts, net player transfer fees, brands sponsoring contracts, etc.) are often neglected in detriment of sporting achievements. The final step was to formulate the regression to be estimated and to interpret this one’s results.
2 The data is disaggregated into six estimation groups, two for each of the football clubs with respect to the Portuguese national league results and the European two major competitions – UEFA Cup/Champions League. In total, 1450 observations were gathered. The results of the estimated equations point out for an absence of a clear relation between sporting performance and stock market reaction. If anything, draws and defeats impact negatively in some situations, but victories do not influence at all, statistically speaking. Volumes play a role for some equations as well as the stock market index.
3
1. Introduction
Undoubtedly, football (referred to in some countries as “soccer”) is one of the biggest, if not the biggest crowd-moving sports in the world. This historical game has in its origins a polemic debate. Nowadays, however, it is unquestionably a multi-million euro moving amusement involving a whole lot of organizations, practitioners and fans, marketing, and study. FIFA (Fédération Internationale de Football Association) is the association that drives a unified policy for all the national football associations. Its secular origins date to 1904 and it counts to date with over 200 national federations. For one to realize its economic impact – FIFA’s 2013 total revenue amounted to USD1.386M coming from its events, other operating income and financial income (FIFA, 2014). Its major partners – Adidas, Coca-Cola, Hyundai/Kia Motors, Emirates, Sony and Visa, easily exhibit market capitalizations of over thousands of millions of Euros (billions of dollars) and are all brands that the majority of people use every day.
Not only are those numbers expressive, the sport has also been growing at a remarkable pace over the last years. A report by Deloitte (Group, 2013) illustrates that from 1991/92 to 2011/2012, the English Premier League has grown largely enough for the 20 clubs that today compose it to generate revenues 14 times higher than those generated by the 22 in 1991. This figure reached the £2.3 billion in the season 2011/2012. The Premier League has thus became, and as Kelly, Lewis, & Mortimer, 2012:243 state: “a global brand which not only attracts some of the world’s finest players, but also some of the world’s richest businessmen vying to become owners of these footballing institutions”.
With a rising tradition for huge expenditure in players – clubs’ main assets – it is not surprising anymore to watch transfers reaching values way above the half hundred million euros: notice for example Cristiano Ronaldo’s transfer from Manchester United to Real Madrid valued at €94M in 2009 and Gareth Bale controversial although located between €91M and €100M transfer fee from Tottenham Hotspur to the same Real Madrid in 2013. The Summer of 2015 registered an unmatched record for clubs in the Premier League spending over €1.000M in players purchases – largely due to the money injected multimillionaire franchise owners being notable examples of that Roman Abramovich (Chelsea Football Club), Sheikh Mansour (Manchester
4 City Football Club through Abu Dhabi United Group), John W. Henry (Liverpool) and the list goes on with 11 clubs in the major English football League being owned by non-UK born, who boosted these clubs achievements since then. It is all a business and somehow a snowball – as teams become more successful, they profit more on TV broadcasting rights and brands sponsorships (Adidas for instance sealed a contract with Manchester United to clothe its players for €944M throughout 10 years). Deloitte (Group, 2015), in its annual report discloses impressive numbers regarding the major European leagues: the season 2013/14 marked the year of an unprecedented record in revenues with the 5 major competitions (England, Germany, Italy, Spain and France) combining a total of €11.3 billion in revenues, €3.9 billion of which being accounted to England.
Parallel to football, appear some related businesses such as betting. Being a rising market, it is target for several regulation (inter)nationally and creation of competent authorities such as the Gambling Commission in the UK – one of the countries with the biggest tradition for betting. According to their report (Commission, 2015), from April 2010 to September 2014 football betting was shown to be a growing focus of interest with its turnover soaring 28% (£287M) reaching the second place (behind horse betting) in players’ favorite market. Worldwide, it is believed that the regulated betting hobby accounts for $430billion, from these, $58billion were regulated in 2012 and if horse racing is excluded, 70-85% is credited to football bets (Association, 2014).
The floatation in the stock market as well has been an increasing topic of discussion and focus for the football community starting on the financial expert leading the listing of a club, to the simplest football fan that reads about it in the newspaper. The fact is that “clubs have increasingly looked to financial markets to supply investment capital” (Hoehn & Szymanski, 1999:208) and since 1983, with Tottenham Hotspur listing, many other clubs have tried their chances on the stock market. In Portugal, those examples are Futebol Clube do Porto (from now on, referred simply to as “FCP”) and Sporting Clube de Portugal (“SCP”) both admitted to the Portuguese Stock Index (PSI) on June of 1998 and Sport Lisboa e Benfica (“SLB”) on May of 2007. Sporting Clube de Braga as well as entered the Portuguese market, but due to its extremely low liquidity, it is going to be left out of this study’s analysis.
Portuguese clubs usually constitute an enterprise called “SAD” – Sociedade Anónima Desportiva, prior to the float on the stock market. SADs are regulated by the
5 Portuguese Commercial Company Code and once within the stock market, the Security Market Code, and their purpose is to provide a clear and transparent management of the club, being its goals to promote and organize sportive events but always with a profit-driven materialization. Actually, strengthening the idea that a club is nowadays a company – by the time SCP was subscribing its capital, the marketing was made in a way to attract people to detain a piece of a company. As Cardoso (2004) explains, the need for this regulation came with the parallel path the sporting business was taking to taxation. Some extreme situations included players’ salaries not even being declared to the tax authorities. These clubs organizational structures and business organograms can be found in annex 1.
Since the advent of clubs being listed, studies have tried to assess whether the listing benefits a club and what drives the club’s stocks price, among other questions in this field. Academics find in this matter an interesting object of stock market study, since game-related information is issued every week and it is widespread throughout media (daily newspapers, online, radio, etc.). Plus, it is a much debated topic igniting discussion from that armchair fan that watches matches very sporadically to the savant analyst who knows all the season stats.
In Portugal, not much has been done in this topic possibly because its market is not very expressive much less presents a considerable liquidity. Ribeiro (2001) has taken the plunge expanding the scarce literature until then, Duque & Ferreira (2004) expanded the former research. This dissertation intends to give continuity to their work, adding some further years of quotations.
Overall, this dissertation assesses the determinants of the prices of Portuguese football clubs’. I expect wins to drive the price up and losses to drive it down. Similarly, an unexpected victory should cause a positive variation and the opposite for an unforeseen loss.
As mentioned before, the dataset is comprised of closing prices for the discriminated football clubs’ stocks the day before and after each game during the period 2000-2014 (beginning and closing seasons respectively); the PSI-20’s closing prices and each team’s record of results.
I am following a similar methodology by Ribeiro (2001) and Duque & Ferreira (2004), adding a variable to mirror the involved agents’ anticipations towards the game result and their level of surprise with the outcome. The importance attributed to
6 the points earned as the season approaches its end is reflected on the variable “Relative points to victory” and the market index translates the systematic risk. The structure of this paper is organized as follows: in section 2, I revise the literature and what has been done on the topic highlighting authors’ conclusions and some of the variables used so far. Section 3 is dedicated to describe the data that is going to be used. Section 4 explains the methodology followed. Section 5 provides the results of the methodology employed and section 6 finishes with the conclusions of this dissertation.
7
2. Literature review
Until a few years ago, economic literature was restrained in what concerned the value of professional sports franchises, either because it was a too incipient and “juvenile” phase to do so (Haugen & Hervik, 2002) or because club’s main assets (players) valuation was (and is) very subjective and inconstant (Aglietta, Andreff, & Drut, 2008). But still, an increasing amount of academic research has been performed over the last years on the topics of sports finance. Under this subject, mainly enterprise value and stock market-related studies are often accomplished by analyzing the major American Leagues or, in Europe: Spanish, English, and sometimes, Turkish football leagues – this might be due to the liquidity in these markets (specifically, its clubs – for example: Manchester United’s average volume 119.419 cannot be compared to Benfica’s 4.8891).
In the field of company valuation, Miller (2007) analyzed what factors contribute to the value of sports franchises in the American Major League Baseball (MLB) for the period 1990-2002. His big contribution to previous literature was a distinction between the impacts of using private and public financing in the construction of new stadia as well as considering the age of the home stadium of a team. Under scope were the variables of real per-capita income, metropolitan populations, success of the teams (via winning percentages), stadium age, age of the team and tenure of the team in the city. Miller concluded that, no matter how the construction of a new stadium was financed, it would provide a boost in the franchise value, however, owning privately the facility would increase the franchise value more than if it was at least, partially publicly funded but still, this difference would not be enough to cover the costs of building the stadium entirely with private funds. Moreover, determinant in the value of the franchise were: the population of the metropolitan area a team played in, the success (past and present) of the team and the age of the stadium. This later decreased the value of the franchise as years went by.
Later on, Miller (2009) extended this study to the sports of Basket (NBA), American Football (NFL) and Hockey (NHL) in America for the periods 1991-2005 (NBA and NFL) and 1991-2004 (NHL). His conclusions pointed out that teams who locate in higher per-capita income areas have higher franchise values (this was true for all the
1 These data were extracted from Morningstar on the 3rd of December, 2014:
8 leagues); also, the longer a team resides in a city, the more valuable its franchise becomes (true for NBA and, with no statistical significance, for NFL), the opposite happens with NHL, suggesting that the “Honeymoon effect” (i.e., when a team plays in new facilities and it causes the fans to attend the game in mass due to the novelty of it) overtakes the fan loyalty effect. In the same paper, the author further illustrates that franchises that own the facilities they play in will capitalize much more and much faster all the revenues coming from it, giving the example of an NHL team which, according to evidence will be worth 20.5% more if it owns its facilities, ceteris paribus. Reinforcing his previous conclusions, these incremental values would not be enough to offset the cost of constructing a new stadium.
Following a similar study, Scelles, Helleu, Durand, & Bonnal (2013) propose a comparison between the same American major leagues and European soccer in what concerns the determinants of firm values for the period 2004-2011. Using some of the variables in previous literature (the majority of which, used by Miller (2006, 2009)), they conclude that per-capita income has a significantly positive impact in European soccer (while significantly negative for the NBA) and attribute as a possible cause for this the limited revenue sharing, being beneficial for an European soccer club to locate in a rich zone; population has a significantly negative effect for European soccer clubs in contrast to American sports in which population has a positive effect whereas income a negative one (significant for NBA) – this might mean that American clubs shake more with the masses instead of the rather richer people; also, Ulrich (2011) conclusions comply with these – according to his regression on Franchise Values for Major League Baseball clubs, a 10% increase in the population of the metropolitan area a team is located in brings up its value by 0,74% which in turn represents about $2.7M for the average franchise in the MLB.
Scelles et al (2013) also find that private ownership of the franchise has a significantly positive impact for all the leagues except the NBA (in which case its impact is negative and not significant) – this finding goes in accordance with what Miller (2007) had defended: a team who owns a stadium will capitalize more easily the revenues coming from it. “Competition” (the competitor clubs) – as measured by Forbes - presents a positive significant impact for European soccer and negative for MLB and NFL. The facility age evidences a significantly negative effect in NFL and European soccer just as expected by the authors has a positive significant effect for MLB and NHL. Attendance, opposite to what one might expect, is not significant in
9 Europe and the study advances that, relating this to the impact of income – it is better for a club to locate in a zone where people are willing and able to spend much money with the club (merchandising, for example) than simply attend the games, where the club might not be able to capitalize it that effortlessly. For European soccer, the sporting performance of the previous year is significantly positive (not significant for the other leagues) and historical performance is significant for all of the leagues. It is worth noticing that the explanatory power of team performance in t-1 is bigger in Europe than in the United States.
Humphreys & Mondello (2008) expanded the time-frame of a similar research to 37 years (1969-2006) focusing on the determinants of the acquisition prices of North American professional sports franchises. Constructing a quality-adjusted franchise price index with a set of constant hedonic prices, they conclude that over the period in analysis, annually, the franchise values in North America increased on average 16%, making it hard for club buyers to lose money with the deal – this figure contrasts to that of Fort (2006) that proposes a median growth of about 4.5% and an average of 4.8% for the MLB teams and its most recent acquisitions up until 2004. Influencing the 16% mark is the history of the club – either being the age of the franchise in or the fact that it owns the facility it plays in making it worth more – coherent to what Miller (2007) proposed regarding the ownership of the facility and the capitalization of it. Insignificant to the transaction price is, maybe surprisingly the recent success of the team (5 years before the sale) and facility age.
A previous study in franchise valuation, that of Brown & Hartzell (2001), has too tried to understand the valuation of a limited partnership (in this case – The Boston Celtics) but instead of using the majority of the abovementioned variables, they were worried about understanding the timings of the returns and how the market responds to games results (how it incorporates public information and the effects games have on stocks). They have concluded that lagged winning percentage has a significant impact in both the franchise value and its operating income. Moreover, the study points out that daily trading volume was higher within the basketball season and that the comparison between on and off-season trading is significant. Concerning the volatility of Celtics’ stocks, these tended to show a more volatile behavior, the days after the games when compared to other regular days and to within the season but non-games days – these differences were significant as well. Overall, the authors concluded that not only do investors respond more strongly to losses than to wins but
10 the former affect significantly the stock price whilst wins do not. This is consistent with what Benkraiem, Le Roy, & Louhichi (2011) advanced: markets react more strongly (become more volatile) after a loss, actually, they react about twice as much as if the team won (considering that investors restructure their portfolios after a game). This study was based on the 11 listed UK football clubs by 2006/07 and assessed the difficulty for investors in valuing a club based on the intangibility of its main assets (the football players). Aglietta et al. (2008) had already defended the case for the difficulty in making the fundamental valuation of a franchise since it depends a lot on the subjectivity inherent to the prices of its main assets’ price (precisely, the players) and the impacts of the games, plus, and as they state – globally the football clubs’ traded volumes of shares are very weak and irregular. Benkraiem et al. (2011) further conclude that defeats at home produce more volatility than defeats away and, surprisingly, wins away do not produce effects on the volatility the (trading) day after the game. A possible explanation for this is found on Berument & Ceylan (2012). They studied the stock markets of Chile, Spain, Turkey and the United Kingdom and the return-volatility relationship in these countries. Their conclusions reveal that, after losses, investors became more risk-averse (this was true for the UK and Spain). After a victory, agents turned out to be more risk-loving (this was true for Chile and Turkey). The opposite conclusions did not match statistically significant results for each country.
Farther from pure financial/economic reasons, there is a growing body of researchers inspecting other factors that drive the investors’ behavior - such as mood changes, affecting the way they conduct their investments (Krige & Smith, 2010).
H. Berument & Yucel (2005) for instance tried to assess the impacts of football games in the psychology of people as a community in general – the particular case in study was Turkey and one of its biggest clubs, Fenerbahçe Spor Kulübü. The authors reason that football, as the dominant sport in that country induces self-esteem on workers, leading this to a better social behavior, contributing, ultimately, to more productive labor. The evidence suggested that Fenerbahçe’s wins affected Turkey’s industrial production in a positive way. Moreover, when Fenerbahçe played against foreign rivals, the national sentiment boosted the morale of workers – being the wins in European games statistically significant. The authors additionally concluded that Fenerbahçe’s wins outside the season also had a statistically significant impact in industrial production. The other way around, when this team tied against its opponent,
11 the bind to industrial production decrease was statistically significant. These conclusions are shared by Coates & Humphreys (2002) who find that winning NFL increases the real per capita income in the home city of the champion by about 140$ because, according to them people’s morale increased; and Edmans, García, & Norli (2007) who studied 39 countries for the period 1973-2004 and found that with the national team’s defeats come strong negative market reactions being this impact bigger, the more detrimental the game is. The authors advance that the cause for so resides in investors mood - concisely, the fans that embody themselves in the desire of a positive outcome for their teams, generate biased expectations, ending too much disappointed when that does not happen (allegiance bias) and so, responses to losses are greater than to victories.
Jones, Coffee, Sheffield, Yangüez, & Barker (2012) hypothesize that social interaction and spending respond to the 2010 World Cups games outcome for English and Spanish fans as football unites people and brings to them a feeling of social belongingness. They have concluded that the positive feelings associated with success in the World Cup (for Spain) prevailed longer than the negative ones (England and its early withdraw from competition), plus, Spanish fans spent more time and money socializing as a result from this.
Being one of the most euphoric countries about football with crowds filling up stadia to receive new players, Turkey draws a lot of attention from academics so that this can be a starting point for diverse researches on football finances. A key study was that of Göllü (2012) when he analyzed the impact that financial management had over the sporting performance of the four biggest clubs in this country (Beşiktaş, Fenerbahçe, Galatasaray and Trabzonspor). Using a range of financial variables as well as the change of management and ranking in domestic league. The conclusions were mixed for the clubs – Beşiktaş showed a significant correlation between the change of management and net profit; Fenerbahçe evidenced only significant correlations between financial variables; Galatasaray evidenced positive and significant correlations between the change of management and net sales and net profit while Trabzonspor’s change of management was positive and significantly correlated to net profit; earlier on, Audas, Dobson, & Goddard (2002) had dedicated an entire study to the effects of management changing. Their conclusion is that it takes on average about 3 months after a new manager has been put in charge for a team to adapt to new tactics. Given that both Beşiktaş and Fenerbahçe have changed
12 the manager in command six times for the period analyzed 2002-2009, Galatasaray seven and Trabzonspor nine, this gives an interesting period of “fully-adapted” to the new strategy ranging from one year to one year and a half. A reason pointed by Audas et al. (2002) for possible situations of high manager turnover – just like this - might be an overestimation of a positive outcome from changing manager. Frick, Barros, & Prinz (2010) point out as possible reasons for the dismissal of the coach: bad league position; highly-paid coaches (the higher the salary, the bigger the probability for dismissal); the loss of the last 3 games; inexperience on behalf of the coach. This study covered Bundesliga for the period 1981-2003.
Similarly to Göllü (2012), Baur & McKeating (2009) have studied how clubs behave sportingly after financial measures had been taken. They analyzed the specific case of European football clubs that undergo an IPO (initial public offering). Their conclusions pointed out that in general, there was no significant gain from entering the stock market. The positive impact was generally noticeable only for clubs playing in lower divisions of large leagues (the authors advanced that this was probably due to the marginal effect coming from the listing, and consequent extra finance, being much more significant for small, less competitive clubs). Clubs playing in smaller leagues (such as Portugal, for example) did not benefit from an IPO – Aglietta et al. (2008) too, has diminished the role of opening capital and went further on to conclude that entering the stock market on its own does not constitute a reliable source of financing. Still, after many studies indicating it is not worth that much to go public, Economist (2012) explains that it is still an opportunity to attract moneys to invest in new players, while clubs such as Manchester United which use to incur in large amounts of debt must comply with UEFA’s financial fair-play regulation which imposes limits to this debt.
For the listed clubs, an increasing number of studies has been performed on the impact that sporting performance has over the clubs’ finances. For example Ashton, Gerrard, & Hudson (2003) analyzed the movements in the FTSE 100 Index after the English football national team had played. They denoted that all national games returned a positive mean for the index while losses showed a negative one, furthermore, they have noticed that important games had a greater impact than regular ones. Overall, their conclusions pointed in the direction of a relation between “The Three Lions” and a change in LSE stocks prices. Klein, Zwergel, & Fock (2009) stood to correct some of Ashton et al. (2003) findings and methodology later on, namely: by
13 using Datastream as the source for both studies’ data, the latter group of authors corrected for the fact that it reports the last trading price when there’s no trading during a holiday implying no returns in these days, the authors treated these off-days as NA observations; even though the number of games disputed by the national English team in tournament finals is correct (35), their distribution between wins/draws/defeats was not correct, the authors fixed this directly from the national soccer team’s official homepage; the authors considered the immediate impact of games played before the stock market had closed in that very day while the corrected study considered only the next trading day. Klein et al. (2009) found that divergently, losses appeared associated with very small negative returns, sometimes even positive. Draws and wins also showed positive returns even though win in a smaller magnitude. In sum, Klein et al. (2009) could not support the mentioned relation between LSE shares returns and the English team’s performance. Ashton, Gerrard, & Hudson (2011) came finally to justify their previous conclusions re-stating them. The authors emphasize that losses do have a negative impact over LSE, increasing this impact the importance of the game; wins go the same way. Again, they find a general link between LSE and the English team’s sporting performance. This conclusion is shared by Samagaio, Couto, & Caiado (2009) with regards to English football clubs. Using a set of indicators for the financial performance on behalf of the club, its sporting performance and its stocks return from 1995-2007, they find a positive significant correlation between the former two and between clubs finances and its stocks, meaning that the management of the club tried a balance between utility and profitability maximization. Also, a good result in UEFA’s competitions corresponds to an immediate positive turnover for Arsenal, Chelsea, Liverpool and Manchester United.
The link between national teams achievements and stock market returns was again studied by Krige & Smith (2010) who analyzed the impact of, among other sports (cricket and rugby), the South African football team’s games and the JSE All Share Index behavior. When national teams won, the index went up but found no evidence for losses to have a statistically significant impact on the index.
H. Berument, Ceylan, & Gozpinar (2006) assessed this same relation for three Turkish listed teams - Beşiktaş, Fenerbahçe, Galatasaray. They have concluded that only Beşiktaş’ victories against foreign rivals on the “Winner’s Cup” led to an increase in its stocks. Demirhan (2013) studies the Turkish national team instead, and for the
14 period 1988-2011 found that losses and draws put together affect the trading day after the game day significantly. Specifically, the negative impact is of 0.5% while there is an absence of impact for victories. Also, the market takes next Monday and Tuesday to react to the game significantly. According to Bernile & Lyandres (2011), the fact that losses/draws generate significant negative returns in the stock market whereas wins don not, might be explained by an overoptimistic feeling by investors. Studying the European football market (UEFA Cup and Champions League) between 2000 and 2006 and working on the principle that “investors may incorporate considerations that are due to irrational reactions or emotions while evaluating securities” (Bernile & Lyandres, 2011:1), they find an asymmetry in response to games’ outcomes by the market with defeats dragging the market down in a bigger amplitude than wins elevate it and the positive returns e game-days is to some extent explained by the pressure exerted by overly optimistic supporters.
Ribeiro (2001) was concerned with Portuguese Sporting Clube de Portugal and Futebol Clube do Porto’s sporty performance and how that affected their stocks’ return as well as the weekend effect for the period 1998-2000. A major contribution to consequent literature was the introduction of the variable “Relative points to victory” – which meant to express the point’s gap between the league leader and the team in study with attention to the remaining games to the end of the season. He determined that field performance did not have an impact over returns, however as the end of the season approached – returns and volatility were significantly affected. Also, stocks tend to react to weekend’s games on Tuesday but very slightly – meaning both that the market anticipates the results for the games on the prior Friday and it takes some time (2 days) to digest the information provided by the game (coincident with Demirhan (2013)). Later on, Duque & Ferreira (2004) extended this study to amplify the data frame to 1998-2003, using OLS and GARCH methodologies. The conclusions were mixed for both clubs presenting an immediate rise of about 1.5% on average for SCP and not for FCP. Draws evidenced a negative impact for both teams while losses only punished SCP’s shares (but, surprisingly, by a smaller amount that draws). Bell, Brooks, Matthews, & Sutcliffe (2012) follow a similar reasoning to the Relative Points to Victory, in justifying that English clubs stocks’ (between 2000 and 2008) response to the outcome of a game might be the result of either this mentioned importance of the game, or a degree of rivalry between two clubs. They defend that stocks movements can be described by a surprise component of the result and its
15 importance, the goal difference of matches, a market index and other non-football related events. Their findings show that the match result explains very little of the stocks movement. Barajas, Fernandéz-Jardón, & Crolley (2005) also defend the allocation of different weights to different games/competitions, namely, they create and index that distinguishes the importance of each competition a Spanish club took part in their study (1998-2002) and weigh the earned points in these. This compound index turned out to be especially good at explaining the different revenue streams of clubs.
Scholtens & Peenstra (2009) monitored 8 teams from 5 European countries from 2000 to 2004 considering not only national but also international competitions, using betting odds to incorporate effects such as the “home ground advantage”. Considering the games altogether, they find that wins imply a positive response from that country’s stock market (+0.36%), being the response significant at the 1% level. Defeats bring about a 1.41% penalization and the same goes for draws (-1.10%). For home-leagues, even though not statistically different from zero, unexpected wins carry a difference of about more 0.16% in returns when compared to expected ones (which increase stock market’s returns in 0.23%). Unpredictably, unexpected losses are less penalized that expected losses being this difference significant. Regarding the European football competitions: both unexpected wins and losses impact significantly in the market implying a return of 1.19% and -3.07% respectively. Palomino, Renneboog, & Zhang (2005) reinforce the good usage of odds for games’ outcomes. They find that the implied winners on books actually end up by winning and the same works for underdogs, even though investors tend to disregard this information, maintaining the weights put on stocks prior to the disclosure of the odds. Also, the authors conclude again that there is a link between stock prices and game results: wins impact the next trading day and losses the next two trading days, the 3rd trading day is even more significant - a loss implies about 1% negative return and a win 0.88% positive return. Stadtmann, (2006) uses odds in studying Borussia Dortmund’s to anticipate expectations regarding the game outcome allied to a news model. He finds that only the unexpected part of the games results affect stocks prices and corporate governance-related news also have an influence.
A big range of other academics have studied diverse aspects related to football other than merely financial. Marques (2002) evaluates the progressivity of competitiveness in the Portuguese main football league and concludes that since 1960 until 2001, the
16 best teams remained the same. Moreover, the gap of quality between the best and worst teams increased as it tends to increase on and on.
Hoehn & Szymanski (1999) highlight the main differences between European football and American major sports (American Football – NFL; Basketball – NBA) in terms of economic and organizational structures and legislation surrounding them. Conclusively, they defend the creation of and European Superleague where the biggest clubs from each country would participate. This would allow for smaller countries to develop and progress more freely within their country without the pressure of a giant.
Bird (1982) tries to forecast attendance in the UK football. He concludes that all the employed variables are statistically significant (minimum admissible ticket price for the English Football League; implicit price level for the total consumer expenditure on the running costs of private vehicles (and/or other means of transportation); the Retail Price Index; total consumer expenditure in year t at 1975’s prices; a dummy assuming the value 1 for the years between 1966-1980).
Simmons, Szymanski, & Lago (2006) argue whether there is a crisis running in European football. They point out that if there is actually a crisis – this is not related to club’s incomes, as these keep on increasing, also, this crisis is patent in bigger clubs, not the smaller ones. Possibly the unmeasured expenditure with players’ salaries and transfers and rising amounts of debt are in the origin of this eventual crisis in European football. After all, and as Frick (2007) points out for Germany for example (Bundesliga), since 1982-1987 the average transfer fee was of about 400.000€ reaching an average value of 2M€ in 2006/07. This is the result of the freedom provided by the Bosman Law2 and an ever more availability of information. Kesenne (2007) also states that with the opening of the labour market and the consequences of the Bosman Law, the gaps between performances and budgets of the teams between big and small countries got bigger but, with no reason, the average salaries of small countries’ players increased even after the best players had migrated to top countries. Garcia Ramos Lucero, Hembert, Rothenbuecher, Mesnard, & Rossi (2010:3) go further on to state that in these conditions, if analyzed objectively as a business, England, Italy and Spain’s main leagues would be “less than two years away
2 Bosman ruling (or Bosman Law) is a decision taken by the European Court of Justice giving more
freedom to the labor in the European Union to move between countries. It was especially significant for football as it allowed players to move to another country to play football at the end of their contract without having to pay transfer fee.
17 from bankruptcy”. Salaries again are highlighted as the focus of bad management in football by Kelly et al. (2012). They alert for the change in the football management paradigm with leveraged buyouts, raising levels of debt and the loss of identity resulting from foreign billionaires acquiring football clubs. This seems to be slightly irrelevant mostly for football fans (possibly the major stakeholders on a club) as clubs tend to be utility rather than profitability maximizers. Bos (2012) uses the theory of soft budgeting to explain the high survival rate of European football clubs. She gives continuity to Simmons et al. (2006), again reinforcing previous conclusions, focusing on the highly negative players’ net transfer.
18
3. Data
Just as mentioned before, this study aims at improving Ribeiro (2001) and Duque & Ferreira (2004) research in what concerns the sample size. They have covered the Portuguese football stock market, respectively from the 2nd of June 1998 to 6th June 2000 and 2nd June 1998 to 30th July 2003. By then, Benfica was not yet quoted, so this
adding is another contribution of the present research. Moreover, and as suggested by Barajas et al. (2005), national leagues and international competitions (namely – Champions League and UEFA Cup) are on the top-of-mind for football fans and organizations, so the inclusion of international games to the data is another point of improvement. Just as in Duque & Ferreira (2004), the data frame includes at least one season when none one of the teams won the Championship and each of the teams won a Championship. Also, it is worth noticing that throughout this time, Porto has won an UEFA Cup, one Champions League and one Europa League, also, Sporting attended one final of the UEFA Cup.
Two types of data are then required to accomplish the proposed: game related data and non-game related data. Game-related data comprises the type of information on the interest of a football fan, being those – the dates of games, the teams disputing the game, number of goals and outcome of the games and the betting odds for the games. Relative to the Portuguese League, this type of information was extracted from http://www.football-data.co.uk/portugalm.php which reveled to be a pretty complete and consistent website for European football leagues’ data, boasting information for Portugal from as soon as the 1994/1995 season. As to the European competitions (UEFA Champions League and UEFA Cup – subsequently renamed UEFA Europa League in the 2009–10 season), these data were collected from http://www.betexplorer.com/soccer/europe/. It has to be said that from the beginning of the data-span up until the end, the number of Bookmakers’ available odds grew, having for example only 4 and 2 available sets of odds in the 2000/2001 season for the Portuguese and European competitions respectively, and in the 2013/2014 season, 10 and around 30 sets of odds for the Portuguese and European competitions. The definitive odds serving as an input for this study were calculated as a simple average of all odds made available by bookmakers.
19 Financial data comprises the closing prices on the floated Portuguese football clubs and were extracted from Bloomberg. PSI-20 closing prices were collected from:
http://www.bolsadelisboa.com.pt/pt-pt/products/indices/PTING0200002-XLIS/quotes.
PSI-20 and not PSI-Geral was chosen to serve as the market portfolio even though none of the studied clubs are part of the former index. This was because I understand PSI-20 reflects much better what is happening in the Portuguese stock market by encompassing only the biggest capitalized companies. Just as this is the case for FCP, SCP and SLB, other companies trade very thinly (Imobiliária Construtora Grão-Pará traded 70 shares on the 28th of July, 2015, for example).
Club’s shares prices were extracted from Morningstar which information was only available from 2000 on.
I am also not going to include off-season matches as opposite to what Duque & Ferreira (2004) did. The frequency of data is consequently going to be - when on-season - weekly, plus international competitions such as the UEFA Champions League that happen, when in dispute, every two weeks.
Initially, the values for the odds were to be obtained from http://www.betfair.com/pt/ - this was because this bookmaker introduced in the betting market an innovative method for gambling – it allowed investors to trade bets just like a stock market. Since investors would immediately incorporate public information regarding games, players’ physical form, initial aligning, home/away ground, etc., the odds would be more realistically adjusted to their fair price. Unfortunately, these odds are regarded as sensible information and could not be shared. Furthermore, and since bettors “create” the prices of the odds in Betfair, this would leave no room for bookmakers to manipulate the odds at their favor, either because they sense a Loyalty Bias (meaning that bettors will always bet on their favorite team no matter what, given that they nourish a sense of loyalty for their team) or a Perception Bias (if bettors overall sense that an event is getting more and more likely to happen, bookmakers can decrease up to a certain point the odds, turning the outcome of this bet smaller) (Braun & Kvasnicka, 2008).
The amplitude of data is different for the three clubs. For Porto, it ranges from the 9th of August, 2000 to the 10th of May, 2014 and includes 591 observations split into 444 Portuguese games and 147 European games; for Sporting the total number of observations is 559, split between 444 national games and 115 European games
20 covering a period between August the 20th, 2000 and the 11th of May, 2014; the case for Benfica is smaller as its entry in the stock market occurred only in 2007 - the data covers the period between the 14th of August, 2007 and the 14th of May, 2014 implying 299 observations – 210 an a national level and 90 on European competitions. Table 1 sums up the data organization:
Sample Period National Games European Games Total Games FCP 09/08/2000 – 10/05/2014 444 147 591 SCP 20/08/2000 – 11/05/2014 444 115 559 SLB 14/08/2007 – 14/05/2014 210 90 300
21
4. Methodology
Both Ribeiro (2001) and Duque & Ferreira (2004) were pioneers in the study of the relation between the stock market and the sports records for Portuguese football clubs by assessing the impact the former had over the latter for FCP and SCP.
Special relevance is given to the RPV (relative points to victory) variable trying to clarify the importance of the points as the seasons approaches its end in both studies while Ribeiro (2001) is very concerned about the weekend effect and the subsequent study adds ARCH models to treat volatility.
Here, the first thing to do was some data mining to process databases and transform them into finding patterns in returns. Mostly Microsoft’s Excel 2010 was used into this. Econometric work was totally conducted using the software EViews 7.
Stocks returns are the dependent variable. Daily continuously compounded returns were calculated as the logarithm of the division, just as in the baseline studies:
yi,t = l n ( Si,t
Si,t-1) Eq. (1)
With:
𝑆𝑖,𝑡 being the closing price for club 𝑖’s shares on trading day 𝑡; 𝑆𝑖,𝑡−1 being the closing price for club 𝑖’s shares on trading day 𝑡 − 1.
Anytime there was a holiday or weekend, 𝑆𝑖,𝑡 and 𝑆𝑖,𝑡−1 were respectively the next/last available closing price, 𝑡 corresponds to the immediate trading day after the game as taken place.
To assess the impact of the outcomes of the games over this variable, 3 dummy variables were created to denominate the victories (“win”), draws (“draw”) and losses (“defeat”), each assuming the value of “1” when that particular outcome was verified and 0 otherwise.
I have used PSI-20 as the reference index for the market as it provides the idea of the disparity between market and individual stocks’ returns as well as it translates the market risk.
The Relative Points to Victory variable was introduced by Ribeiro (2001) with the intention to separate the importance of the games in the beginning and in the end of
22 the season. In fact, saying Benfica has lost the first game of the season does not imply the championship is compromised as a series of games are still in dispute. But if Benfica loses the penultimate game to its direct challenger this might be detrimental. This did happen in the season 2012/13 when Benfica was leading the table with 74 points by the 28th fixture (third before the last) while Porto was following right after
with 72 points. Benfica has lost the penultimate game precisely against Porto that rose to the first place with 75 points. The last game of the season dictated a victory for both teams, crowning Porto as the Champion. The RPV variable takes into account the relative importance of each game, taking into account the number of games still in dispute:
RPVi,t = Ni,t-Nj,t
3Kt Eq. (2)
With: 𝑁𝑖,𝑡 being the number of points of team 𝑖 at time 𝑡;
𝑁𝑗,𝑡 being the number of points of team 𝑗 at time 𝑡. Whenever team 𝑖 is leading the championship, team 𝑗 is the direct challenger (second place). Following the provided example: if team 𝑖 was to be Benfica on the 28th fixture, team 𝑗 would be Porto. If
team 𝑖 is not leading the championship, then team 𝑗 is the leader, again with the example, teams 𝑖 and 𝑗 would be the same, this time after the 28th fixture Benfica
being the challenger to the leader;
𝐾𝑡 is the number of matches left to play at time t.
Notice that whenever team 𝑖 is leading the championship, RPVi,t is positive. It turns
negative whenever team 𝑖 is not the leader and consequently has lesser points than the first placed. The ratio can also equal zero when both the leader and the challenger have the same accumulated points. As the end of the season approaches, the denominator gets smaller providing a larger marginal impact for each game. The “3” in the denominator represents the total possible points to be earned in each game. I propose that the returns should also be a function of the surprise component of results achieved by a team as well as the rivalry degree to the adversary, just as advanced by Bell et al. (2012).
Concerning the surprise results, this means that for each game, investors formulate their expectations regarding what should be the final outcome. The just mentioned authors defend that if games results are price sensitive information, then in an
23 efficient market, clubs’ shares should contain this information. Betting odds are used to proxy these investors’ expectations since, by fixing them, bookmakers try to achieve the most accurate probabilities of the game outcome so that they do not lose money while simultaneously remain competitive against other bookmakers. Standard bookmakers make profit from a margin they insert on the betting odds, turning an event more probable to happen. This margin is called the “overround”. Table 2 details a practical example:
Date Teams (result) Odds Implicit probabilities
14-08-2007
Benfica (2) VS FC Copenhagen (1)
Home Draw Away Home Draw Away 1,47 3,82 6,51 0,6803 0,2618 0,1536 Table 2 - Implied probabilities on a game (average bookmakers’ odds)
The implicit probability of an outcome o (po) on an odd is calculated by dividing one by the odd itself:
𝑝𝑜 = 1
𝑂𝑑𝑑𝑜 Eq. (3)
With 𝑜 being any of the possible three outcomes for a game.
The revenue made by the bettor is therefore its stake (the amount of money put into the bet) times the odd (being the profit simply the stake times the odd minus one). In this case, an investor who had betted 1€ for Benfica would realize a profit of 1*(1.47-1) = 0,47€.
Of course the outcomes of a game cannot have a total summed probability of occurring of more than 1, as this is the case of the average probabilities for this game (1,0957 = 0,6803 + 0,2618 + 0,1536). The 0,0957 surplus is then the average overround for the bookmakers contemplated in these odds.
To achieve the fair odds (i.e. the odds that translate a total summed probability for the outcomes of 1) we must multiply the odd by 1 plus the overround:
24 Table 3 illustrates:
Mark-up Fair Odds Implicit probabilities
0,0957 (9,57%) Home Draw Away Home Draw Away
1,61 4,19 7,13 0,6209 0,2389 0,1402 Table 3 - Fair probabilities implied on a game
The expected points to be achieved in each league game are therefore calculated by:
EPi,t = 3pwin+1pdraw+0ploss Eq. (5)
Where 𝐸𝑃𝑖,𝑡 being the expected points for team 𝑖 in the game that occurs at time 𝑡. This yields that the surprise points in each game are simply the earned points minus the expected ones:
Win surprise points = 3 - 𝐸𝑃𝑖,𝑡
Draw surprise points = 1 - 𝐸𝑃𝑖,𝑡
Loss surprise points = 0 - 𝐸𝑃𝑖,𝑡
An alternative to conventional bookmakers would be Betfair, or Betangel. Both founded in 2000, as previously explained these companies work in a rather different way in that they let bettors define the closest to a fair odd via the confrontation of supply and demand, or in other words – buying and selling. Investors are not only allowed to bet for a specific outcome but also against that same outcome. So to say – betting against the home team would yield a profit if the game either ended with a draw or the away team won. When one team gets more favored to win a game, investors automatically push the odds down by buying bets on that team (contrary to stock markets, demand drives the price down). Sellers are the ones who will pay buyers in case the later win the bet, it’s of their interest to sell the odd at the lowest possible price (pay the less possible), but at the same time, buyers will content themselves with the available odds if they really think team X is going to win and seek that profit. The odd is thus updated very frequently during the game and reflects all the investors’ own expectations, and not conventional bookmakers’. This form of betting and defining odds should work around problems such as those pointed by Braun & Kvasnicka (2008) where bookmakers can bias odds by exploiting bettors’
25 perceptions and loyalty. Deschamps & Gergaud (2007) also find a positive longshot bias in odds set by six bookmakers for the English Premier league between 2002 and 2006 meaning that betting on more probable outcomes yields a bigger (less negative) return generally, even though during this period, bookmakers’ margins have decreased. These conclusions are the same as in Peel, Cain, & Law (2000) who find it to be especially profitable for punters (those who invest in a single outcome and let their bet open until the end, as opposed to traders who invest in opposite outcomes trying to lock a secure profit) to bet on small results in favor of the home team. Moreover, as F. Palomino, Renneboog, & Zhang (2005) advance, possibly due to the lack of dispersion of it, that information carried by betting odds published by bookmakers is not significantly absorbed by the stock market. Their study contemplated conventional bookmakers’ odds.
In Portugal, bookmakers appear to undervalue the probabilities of the three biggest clubs of winnings such as Table 4 suggests:
Probabilities* of: Actual frequencies:
Difference: Verdict:
F. C. Porto Winning 56,27% 65,14% -8,87% Bookmakers underestimate FCP Drawing 23,82% 19,12% 4,70% Losing 30,05% 15,74% 14,31% Sporting C. P. Winning 50,89% 53,85% -2,96% Bookmakers underestimate SCP Drawing 25,48% 22,90% 2,58% Losing 28,79% 23,26% 5,54%
S. L. Benfica Winning 57,20% 62,46% -5,26% Bookmakers underestimate
SLB
Drawing 23,33% 20,60% 2,73%
Losing 31,43% 16,94% 14,49%
*implied by the odds, deducted from the mark-up meaning: fair probabilities Table 4 - Bookmakers and verified probabilities (average bookmakers’ odds)
With all this in mind, it is the case to agree with Bernile & Lyandres, (2011) in that the market price of contracts traded on betting exchanges (such as Betfair and Betdaq) would be a better proxy to investors’ expectations.
26 Another variable that might be of relevance is the degree of rivalry between opponents. Do not read though, this variable as the historical degree of competitiveness between two local teams such as in the Lisbon derby between Benfica and Sporting. Instead, this variable assesses past season’s performance for two teams and compares it with current season’s. As Bell et al. (2012:8) put it: “the degree of rivalry between two clubs is defined as the expected difference in their final league positions”. To approach this, the authors make the absolute difference between each opponent’s sum of their weighted last year’s and current season’s place in the league. This weighted sum is calculated as follows:
Wit=RLi[2(N-1)-t
2(N-1)] +RCit[ t
2(N-1)] Eq. (6)
With: t being the number of the current fixture; 𝑊𝑖𝑡 being the weighted sum for club 𝑖 at time 𝑡;
𝑅𝐿𝑖 being last year’s final place in the league for club 𝑖;
𝑅𝐶𝑖𝑡 being current season’s place in the league for club 𝑖 in the game prior to time 𝑡; 𝑁 being the number of teams in the league, in the Portuguese league: 18 until the 2005/2006 season and 16 after that and 2(𝑁 − 1) the total number of games played in each season.
When the season starts, before the first game, 𝑡 = 0 and: 𝑊𝑖0= 𝑅𝐿𝑖[2(𝑁−1)−0 2(𝑁−1) ] + 𝑅𝐶𝑖0[ 0 2(𝑁−1)] = 𝑅𝐿𝑖[ 2(𝑁−1)−0 2(𝑁−1) ] = 𝑅𝐿𝑖
Recently promoted clubs occupy bottom positions in the main league, so for example: if team 𝑥 was disputing the second division championship last year and won it, 𝑅𝐿𝑥 =
16 (antepenultimate position), not 1. This example suits the seasons until 2005/2006 when, before the restructuring of promotions and relegations, 3 clubs rose to the main division and 3 clubs descended, occupying respectively 16th,17th and 18th places for the matter of the variable. After that, only two teams were “updated”.
The rivalry between teams A and B in the game set at time 𝑡 is given by:
27 The weighted sum is club 𝑖’s last season’s place. It is worth noticing that by the end of the season, Wit has taken progressively the value of club 𝑖’s final position. With this, RV𝑡 would take a maximum value of around 15 if teams’ A and B rivalry is taken to the max, and a minimum value of around one when there is great disparity between team’s performances.
In total, there are six time series: two for each club – an European one (UEFA Cup/Europa League and Champions League matches) - and a national one (including all the games for the Portuguese national championship).
The equation to be estimated is then the following:
yi,t= 𝛽1𝑦𝑖,𝑡−1+ 𝛽2𝑃𝑆𝐼20𝑡+ 𝛽3𝑃𝑆𝐼20𝑡−1+ 𝛽4y𝑗,t+ 𝛽5y𝑗,t−1+ 𝛽6y𝑘,t+ 𝛽7yk,t−1+ 𝛽8𝑅𝑃𝑉𝑖,𝑡+ 𝛽9RVi,t+ 𝛽10𝑊𝑖,𝑡+ 𝛽11𝐷𝑟𝑖,𝑡+ 𝛽12𝐷𝑓𝑖,𝑡+ 𝛽13𝑉𝑂𝐿𝑖,𝑡+
𝛽14𝑉𝑂𝐿𝑖,𝑡−1+ 𝛽15𝑆𝑖,𝑡+ є𝑖,𝑡 Eq. (8)
With: 𝑖, 𝑗, 𝑘 being SLB, SCP and FCP. Equations for SCP and FCP do not include SLB’s returns and lagged returns as these were not available until its floating;
yt are the returns for clubs’ stocks at time 𝑡 as calculated in Eq.1 and 𝑦𝑡−1 are their
lagged returns (the returns for the last closing before the game – these can be the day of the game if it occurred during the week or Friday if it happened during the weekend);
𝑃𝑆𝐼20𝑡 and 𝑃𝑆𝐼20𝑡−1 are respectively the closing returns for the Portuguese stock market index the next and the day before the game has occurred;
𝑅𝑃𝑉𝑖,𝑡 is the “Relative Points to Victory” ratio just as calculated in Eq.2 for team 𝑖 in the fixture 𝑡
RVi,t is the rivalry measure for team 𝑖 at fixture 𝑡 (see Eq.7);
𝑊𝑖,𝑡; 𝐷𝑟𝑖,𝑡 and 𝐷𝑓𝑖,𝑡 are respectively dummies for team 𝑖 at time 𝑡, for victories, draws and losses assuming the value “1” anytime each of these states occurred and “0” otherwise;
𝑉𝑂𝐿𝑖,𝑡 and 𝑉𝑂𝐿𝑖,𝑡−1 are respectively the trading volumes of club 𝑖’s stocks at time 𝑡 and 𝑡 − 1;
𝑆𝑖,𝑡 is the surprise game points variable for team 𝑖 at time 𝑡 as calculated previously. To work around the problem of having perfectly collinear regressors, I have excluded the constant term from the estimation equation.
28 The employed method in the equation is the Ordinary Least Squares (OLS). However, to solve issues such as autocorrelation presence and heteroscedasticity, I am going to use Newey-West estimators. White estimators would also be an option, but because these only treat heteroscedasticity, I am using NW instead as they answer both problems at once.
29
5. Results and discussion
Let us first take a look at the general trend for each club’s stocks:
Figure 1- FCP's returns
Figure 2 - SCP's closing prices
Figure 3 - SLB's closing prices
0 1 2 3 4 5 6 09/08/2000 09/10/2002 09/12/2004 09/02/2007 09/04/2009 09/06/2011 09/08/2013