M
ASTER
FINANCE
M
ASTER
’
S
F
INAL PAPER
M
ASTER
T
HESIS
B
ANK PERFORMANCE DURING THE EUROPEAN DEBT CRISIS
:
A
DEA
APPROACH
P
EDRO
R
APOSO
B
ORGES
2
M
ASTER
FINANCE
M
ASTER
’
S
F
INAL PAPER
MASTER
THESIS
B
ANK PERFORMANCE DURING THE EUROPEAN DEBT CRISIS
:
A
DEA
APPROACH
P
EDRO
R
APOS
B
ORGES
S
UPERVISION:
P
AULOM
ANUEL DEM
ORAISF
RANCISCO4 Abstract
The present work analyses the performance of 353 banks, from 17 countries of the euro zone, for the period of 2005 to 2010. The analysis is made through the application of Data Envelopment Analysis method (DEA) upon financial data from financial reports, and the results are then subject to a regression analysis to determine possible efficiency determinants. The results suggest that performance was somewhat constant across the sample firms and points out the main determinants of efficiency being the bank size and location.
Keywords: Performance Analysis; Euro Zone; Commercial Banking; DEA; Resources Allocation.
Resumo
O presente trabalho, tem como objetivo principal a análise de performance de 353 bancos, de 17 países da zona euro, para o período de 2005 a 2010. A análise é feita através da aplicação do método do Data Envelopment Analysis (DEA) sobre dados financeiros de demonstrações financeiras, e os resultados da mesma sujeitos a uma regressão para determinar possíveis determinantes de performance. Este estudo sugere que a performance foi constante para a amostra selecionada e aponta como principais determinantes da performance o tamanho e a localização dos bancos.
5
Contents
Abstract ... 4
Resumo ... 4
I. Introduction ... 6
II. Contextual setting ... 7
III. Literature Review ... 9
3.1.Approaches ... 10
3.2. Data Envelopment Analysis ... 13
3.3. Related Work ... 17
3.4. Hypotheses ... 18
IV. Data and Methodology Issues... 21
4.1. Data ... 21
4.2. DEA ... 23
4.3. Tobit Regression ... 24
V. Empirical Results ... 26
5.1. European Bank Efficiency ... 26
5.2. Determinants of Bank Efficiency ... 34
VI. Conclusion and Future Research ... 36
VII. References ... 39
6 I. Introduction
Bank performance analysis has witnessed a significant growth in the latest years mainly due to the financial crisis. This type of work tries to explain the main drivers for the bad or good performance of banks, under some assumptions. One featured line of research is the analysis of a set of banks under a common production frontier. This theory argues, in general, that a bank will be a good performer when it reaches the production frontier, being 100% efficient in the allocation of resources. This production frontier is formed through several or one benchmark, with certain inputs and outputs, allowing for several combinations of inputs and outputs, so there may be more than one efficient bank.
The motivations for this work consists on bringing a more recent approach when assessing performance of all countries in the Euro Zone, since all the work reviewed only mentions a small set of countries in this common area, and of the few set of papers that tested the determinants of the efficiency scores obtained by the methods of production frontier do not test the sector and countries ratings’ impact involving the banks and appear also no to differentiate crisis from the normal period, those two possible determinants, amongst others, are tested by using a Tobit Regression. Therefore, this paper innovates in this context and presents an updated view of the
countries’ banking sector of the common currency area, complementing the research in
this field.
7
regression analysis suggests that the main determinants of bank efficiency were Size and Location. Therefore, larger banks from specific countries have realized higher performance scores.
The results provide evidence that some banks perform poorly because of the fact that they are consuming too many inputs to the output produced and also due to their location and size. This result could allow regulators to identify some negative aspects in the economies of those banks with lower levels of efficiency and create new laws to help them improve their performance. Also these findings allow banks individually to know if their allocation of resources is the best.
The paper is structured as follows: Section II provides a contextual setting of the Euro Zone, Section III discusses the literature concerning the choices of the methods for the analysis of performance and the related work; Section IV describes the data and methodological approach; Section V analysis of the empirical findings; Section VI is dedicated to the conclusion and future research.
II.Contextual setting
market-8
entry costs substantially decreased, favoring competition and the creation of a unified banking market.
9
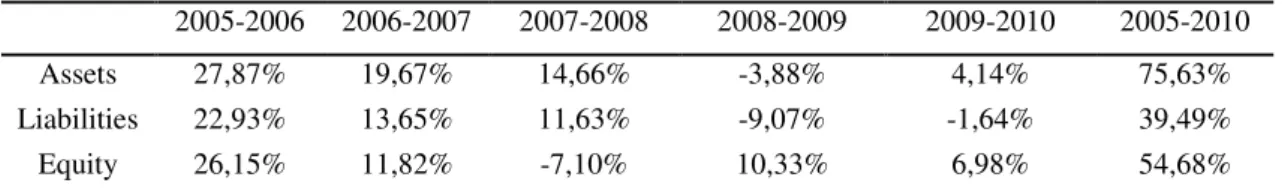
Table I – Evolution of European Banks Total Assets, Total Liabilities and Total
Equity.
2005-2006 2006-2007 2007-2008 2008-2009 2009-2010 2005-2010
Assets 27,87% 19,67% 14,66% -3,88% 4,14% 75,63%
Liabilities 22,93% 13,65% 11,63% -9,07% -1,64% 39,49%
Equity 26,15% 11,82% -7,10% 10,33% 6,98% 54,68%
Notes: This table reports the evolution of Assets, Liabilities, Equity throughout the years
This work investigates the performance of banks from the countries of the euro zone through efficiency measures by constructing a common production frontier, before and during the crisis. Performance is measured in terms of efficiency, since the evaluation of efficiency encounters itself bounded to the wish of improving performance. The Euro Zone banking markets are evaluated using the non-parametric DEA approach between 2005 and 2010; the aim is to examine the overall performance in the banking sector of each country, pin pointing the most and least efficient countries and doing a structural and evaluative analysis. The determinants of bank efficiency are also assessed by the means of the Tobit regression model approach in order to analyze the influence of various country-specific and environmental factors on bank efficiency.
III.Literature Review
The literature around bank performance has noticed a considerable growth along these last years, with new insights upon the methods to employ, as is demonstrated in studies such as Berger & Humphrey (1997) , Tavares (2002), Fethi & Pesiouras (2010), Paradi & Zhu (2012), Berger (2007), amongst others.
10 3.1.Approaches
According to Kumbirai & Webb (2010); Paradi et al (2004) there are two broad approaches to measure bank performance, the accounting and the econometric approach.
The accounting approach relies on the analysis of financial ratios which allow for the assessment of performance in terms of profitability, liquidity and credit quality, this approach being exploited by Kumbirai & Webb (2010), Paula (2009), amongst others. Paradi et al (2004) states that this approach is the oldest and the most commonly used for the analysis of performance by regulators, industry analysts and managers. In spite of being often utilized by those entities, the same approach presents limitations. Paradi et al (2004), states that by being a simplistic approach, it does not give an objective form to identify the inefficient firms and to make them better. And it was through this major limitation that other approaches started to emerge, more sophisticated to assess the corporate performance, namely the methodology of the production frontier.
The econometric approach gains form through the approach of the production frontier, and according to Jayamaha & Mula (2011) it is the most popular in empirical studies of productivity and efficiency. Paradi et al (2004) describes the frontier analysis, this being measured through parametric or non-parametric methods, as the measurement
of relative efficiency of the units produced, based on the distance of the “best-practice
frontier”, which estimated through the data base. The great advantage of this
11
are considered to be production units, but from this point forth they will be denominated as DMUs, decision making unit, which in this study will be the banks.
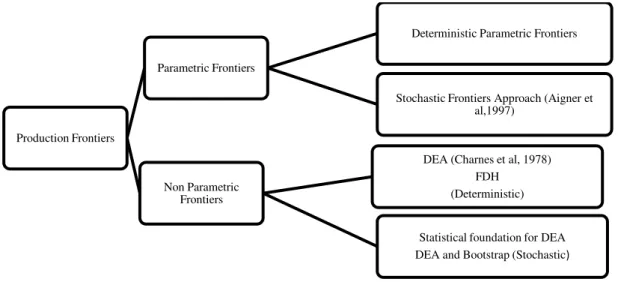
The production frontier approach divides into two major methods, those being parametric and non-parametric and these two subdivide once more into the deterministic and the stochastic methods. Figure 1 presents a summary of how they divide.
Figure 1 – Production Frontiers.
The differences between the parametric and non-parametric methods rely on the differences imposed in the functional form of the efficient frontier, in terms of random error existence and in the distributional assumptions of the inefficiencies and random error. The parametric methods require a priori the specification of the production frontier form, and typically include two components of error: one error that captures inefficiency and a random error, while the non-parametric requires few assumptions when specifying the best-practice frontier (Paradi et al, 2004). The major difference between one and other subordinates is the fact that in parametric methods the deviation of the production frontier is considered to be due to inefficiencies or errors, while the same distance from the frontier when using the parametric methods is justified totally by inefficiency (Berger & Mester, 1997).
Production Frontiers
Parametric Frontiers
Deterministic Parametric Frontiers
Stochastic Frontiers Approach (Aigner et al,1997)
Non Parametric Frontiers
DEA (Charnes et al, 1978) FDH (Deterministic)
12
Following Berger & Humphrey (1997), the usual approaches when measuring efficiency through production frontiers are Stochastic Frontiers Approach, SFA, (Aigner et al, 1997) and the Data Envelopment Analysis, DEA, (Charnes et al, 1978). Only these two approaches will be subject to the literature review. For better acknowledgement of the remainder approaches consult, for example, Camanho (1999).
The Stochastic Frontier Analysis method (SFA) uses econometric models assuming the possibility of each DMU being subjected to exogenous variables that intervene in the productive process. In this form, the SFA method specifies a functional form for the cost, profit or product function, and allows the existence of random error. This type of frontier assumes that all the detours from the estimated frontier are due to inefficiencies and random error (Camanho,1999).
The DEA method utilizes linear mathematic programming models to analyze the optimum combinations of inputs and outputs based upon the performance of the various DMUs, which hold common inputs and outputs, when the best combination is achieved for one DMU, it is said that the DMU is efficient. The DEA allows identifying one subset of DMUs which are in the production frontier, as for the remainder inefficient DMUs in order to achieve the production frontier they use the DMUs in the production frontier as benchmark. The DEA gives a measure of efficiency to the inefficient DMUs, recommending for them to be in the production frontier to reduce the inputs or increase the output, as a result of the approach being held (Charnes et al, 1978).
13
some random error, which may have been taken into account in the measured efficiency.
From the two big approaches, the accounting and the production frontier, this work will focus on the production frontier, because the accounting method does not reflect the capacity to use the resources to the maximum, since it ignores efficiency questions when carrying out the activity, while the production frontier allows a better perception in terms of resources allocation (Camanho, 1999); Daley &Matthews, 2009). Berger et al (2009:116) states that:
“Ratio analyses do not control for individual bank outputs, input prices, or other
exogenous factors facing banks in the way that studies using modern efficiency methodology does, and so may give misleading results. To illustrate, a cost-efficient bank may have relatively high cost ratios because it is producing a high-cost output bundle (e.g., more loans, fewer liquid assets) or faces high input prices, and so may be incorrectly identified as a poor performer”.
Berger & Humphrey (1997) did not find a consensus in the literature reviewed concerning the best method to be utilized in these studies of the parametric or the non-parametric methods, so the method that will be used in this study will be the DEA since as it will be suggested in the related work section, this method appears to be the most usual.
3.2.Data Envelopment Analysis
The DEA methodology imposes three questions, in respect to the choice of the model to be used, namely:
14
Type of Data Envelopment Analysis: DEA (Multi-Stage) Vs DEA (1-Stage) Vs
DEA (2-stage); Inputs and Outputs.
Relative to the orientation, the technical efficiency may be estimated through an input or output orientation. The input orientation allows one to calculate the amount of inputs quantities that can be reduced for the same output, as the output orientation permits to calculate the amount of output quantities that can be increased for a constant level of inputs (Coelli,1997). As examples of inputs and outputs approaches, Fethi & Pasiouras (2010) have surveyed several studies and discriminated the approaches being used, so for further acknowledgment, consult their work. According to Fethi & Pasiouras (2010), the common orientation used is the input orientation, since it’s more likely to be assumed that the managers have more control upon the inputs quantities, endogenous factors, than the outputs, exogenous factors. This being the approach to be adopted in this work.
15
since it is only appropriated when firms operate at an optimal scale, as in the current days due to, for example, imperfect competition, banks regulation it is not possible to make that assumption. Coelli et al (1998), also states that the VRS specification has been the most commonly used specification in the 1990s, with this in mind, and considering the reason previously mentioned, the specification to be adopted is the VRS.
Relative to the type of the DEA to be used to measure cost efficiency Coelli (1996) says:
“The multi-stage DEA method is more computationally demanding that the other two
methods (see Coelli 1997 for details). However, the benefits of the approach are that it identifies efficient projected points which have input and output mixes which are as similar as possible to those of the inefficient points, and that it is also invariant to units of measurement. Hence we would recommend the use of the multi-stage method over
the other two alternatives”
16
inputs and outputs to evaluate the services fluxes provided by the financial institutions are the Production and Intermediation approach, the same work asserts that none is perfected, since neither can apprehend the double roll of the banks, and suggests that for a better apprehension it would be better to use both.
The Production Approach enhances the banks operational activity, and for that, banks are seen mostly as providers of services to the consumers. Under this approach, generally, the inputs include the physical variable to operating costs (e.g. labour, premises, materials) and the outputs are measured by the workload of operational activities. (Benston, 1965).
Under the intermediation approach, financial institutions are viewed as mainly intermediating funds between savers and investors. Banks produce intermediation services through the collection of deposits and other liabilities and their application in interest–earning assets, such as loans, securities and other investments. With this approach, generally, input is measured by interest and non-interest costs and outputs reflect the financial flows associated with the intermediation activity, for example interest and non-interest revenues. (Sealey & Lindley, 1977)
17
added approach, user cost approach). To further information regarding the discussion of the role of deposits as outputs or inputs consult Sealey & Lindley (1997).
According to Berger & Humphrey (1997), the production approach may be better for evaluating branches of financial institutions, because agencies process clients documents for the institution as a whole, and the branch managers usually have little influence over financing and investments decisions of the bank. Camanho (1999) points as to one reason for the lack of literature on the production approach, on the level of studies on efficiency of banks, being due to the difficulty encountered in collating accurate data, because the information required by supervision authorities and published by the banks are mainly financial. A Intermediation approach, accordingly to Berger & Humphrey (1997) may be superior for evaluating importance of frontier efficiency to the profitability of the financial institution, since minimization of total costs, not just production costs, is needed for maximizing profits. Given that our study involves analyzing banks and not branches, the approach being adopted is the intermediation approach.
3.3. Related Work
Since the first appearance of frontier production methods, there has been an increase in their use to estimate efficiency on bank branches and on banks within a single nation, but comparing those two with international comparisons of efficiency on banks literature, this last one has not experienced the same rapid development.
18
than one nation, that measure efficiencies to a common international frontier and from those 6 studies, the method used most was DEA, 3 times.
According to Berger (2007), one of the main reasons for the lack of literature on international comparisons relies on the fact that many researchers tend to study efficiency in their home nation, because of the quality and accessibility of data.
From the 16 studies reviewed in the literature that examine efficiency in more than 1 European country to a common international frontier, 7 of them apply DEA, and the others apply a set of different methods relating to the parametric methods. From those 7 studies, only 1 refers to the Euro Zone that is the main target in this study. And 3 of them uses a second stage regression, to try to explain the efficiency results, as a dependent variable, with a set of independent variables, such as size, market share, regulation, concentration, amongst others.
In the literature there are a few recent studies analyzing bank performance on European Countries, under a common international frontier and using the DEA method, and these studies are from Margaritis & Staikouras (2012), Chortareas et al (2011), Hauner (2005), Casu et al (2004), Casu & Molyneux (2003), Grigorian & Manole (2002), Pastor et al (1997), amongst others. Three of those rely their analysis on profit maximization Margaritis & Staikouras (2012); Casu et al (2004); Pastor et al (1997) through the Malquimist index, from DEA, and the reminiscent through Technical Efficiency, under the cost efficiency approach.
3.4. Hypotheses
19
dependent variable, and some parameters reflecting the hypotheses to be tested. There are some studies related to production frontiers that used a regression and also tested some of this hypotheses and they are Miller & Noulas (1998), Grigorian & Manole (2002); Casu & Molyneux (2003), Hauner (2005), Berger & Bouwman (2008), amongst others.
The hypotheses that are tested are as follows:
H1: Ratings of the Banking Sector and Countries determine performance of banks. Given the literature reviewed there was no found of there ever being ratings introduced in a regression, in order to examine its impact on the efficiency results. Since it has been noted in some studies, the characteristics of surrounding economies can influence the performance of banks and it becomes important to test the significance of these factors as determinants of performance of banks (Casu & Molyneux, 2003). Due to the fact that every country presents different conditions from each other, for example, the health of the country and banking sector, through the designated rating, the assessment of its
impact on banks’ performance becomes of higher importance, since these sectors and
countries have been “marked as good or bad investments” and may influence its
performance.
20
&Noulas (1996); Said (2012); Hauner (2005); Berger & Bouwman (2011); Ajlouni et al (2011); Berger&Mester (1997); Berger (2009); Yudistira (2004).
H3: Capital helps bank performance. Some studies focus on testing this hypothesis and generally demonstrate that when capital is higher, levels of efficiency are lower, yet Ajlouni et al (2011) have stated the opposite. With that being said and taking into account the requirements of capital imposed by Basel were intended to safe keep the
solvability of banks and knowing that bank’s capital strength forms the ultimate line of
21
the location of the bank. For papers that have investigated this hypothesis, there are, amongst others, Miller &Noulas(1996); Casu & Molyneux (2003); Bikker et al (2007); Grigorian & Manole (2002).
H5: Sub-prime crisis has impact on the performance results. Few studies introduce dummies to differentiate a period of crisis from normal periods, in the studies assessing
the determinants of performance. It’s important to study this impact on the performance
results because this crisis in the financial sector brought several companies to bankruptcy, and since the financial sector is interconnected worldwide and the sample,
in analysis, being predominantly specialized on Commercial Banking (“buying and
selling money”), the disorder witnessed in USA, started in 2007, with the subprime
crisis. The subprime is characterized by turmoil in financial markets as banks have experienced difficulty in selling loans in the syndicated loan market and in securing loans and may have had some impact on the banks performance may be due to the falls on several nations principle financial markets. With that being said, it becomes important to make this differentiation from normal and crisis periods. Berger & Bouwman (2008), utilized this dummy variable for the estimation of profitability, from 2007:Q3 – 2009:Q4, for further detail about the subprime crisis see Berger & Bouwman (2008).
IV. Data and Methodology Issues
4.1. Data
22
preference to banks that had complete data to time periods in analysis and to the banks specialized in commercial banking. With the filters employed, the final sample was constituted by 353 banks. It was focused on commercial banking in order to minimize estimation problems that heterogeneous sample would bring and because it is a representative sample of the population (Chortereas et al, 2011). The sample represents around 60% of the commercial population and approximately 25% of the total population, in terms of total assets in 2010. In terms of the number of banks, this area of expertise, comes in second place, with around half of the banks of Cooperative Banks.
The data was withdrawn from BankScope database, since it is commonly used by a diverse number of authors and recognized by the same as being relevant, as it guarantees data consistency and uniformity, an example of articles that used this database are Margaritis & Staikouras (2012), Ferreira (2011), Irsova (2009); Barros et al (2007); Bikker et al (2007); amongst others.
23 4.2. DEA
The methodology for assessing bank performance consists of utilizing the production frontier method, more specifically DEA method, to estimate the cost efficiency under a common production frontier of 17 different euro zone countries. The DEA Multi-stage is adopted with an input orientation, assuming VRS for the time period. Accordingly to Farrel (1957), the following formula defines the simplest way of measuring efficiency:
Efficiency = input/output (1) Farrel (1957) suggested that a bank could produce multiple outputs using multiple inputs. The technique defines a pattern for the most efficient DMU contrasting with the less efficient banks through an analysis of the various inputs and outputs. Accordingly to Casu & Molyneux (2003), the VRS linear programming problem can be defined as:
(2) where Ө is a scalar, λ is a N x 1 vector of constants and N1 is an N x 1 vector of ones. For further acknowledgment of the methodology adopted consult Banker et al (1984) and Grigorian and Manole (2002).
24
The inputs applied in this document are Fixed Assets that stands for capital,
Personnel Expenses that represents Labor and Total Funding which includes short-term funding, deposits, money market and long short-term funding. Fixed Assets, Personnel Expenses and Deposits were used by Apergis & Alevizopoulou (2011), Said (2012), Assaf et al (2011), amongst others. These inputs are commonly used under the intermediation approach.
The outputs used are Net Loans, measured as the Loans less reserves for impaired
loans and non-performing loans, since it is more important to know the real amount of standing good loans than the volume of total loans with imparities that would probably bias the final outcome. The other output is Total Securities. Those two outputs are considered to be Earning Assets, which are produced with the inputs mentioned above. The Net Loans are less vulgar to be used, since it is more common in these studies to use the Total Loans, however Net Loans were used, for example, by Daley & Matthews (2009), Grigorian & Manole (2002). Total Securities are also usual in these efficiency studies, and they were used by Altunbas et al (2001), Altunbas &Molyneux (1996) ,Casu et al 2004, amongst others.
This document utilizes the VRS model to measure the relative efficiency of its European Banks for the period of 2005 to 2010, using the DEA multi-stage. The software utilized to measure the DEA multi-stage for the period of 2005 and 2010 in this document was DEAP 2.1, created by Tim Coelli.
4.3. Tobit Regression
25
Tobit regression. The Tobit regression was adopted to estimate equation 3 due to the limited nature of the dependent variable, note that the scores of efficiency varies from 0 to 1. Gregorian & Manole (2002) states that unlike a conventional Ordinary Least Squares estimation, in cases with limited dependent variables, Tobit models are known to generate consistent estimates of regression coefficients. The finality of this regression was to test the impact of some possible determinants of performance on the efficiency results, under some assumptions that aim for the assessment of endogenous factors that may influence the performance of banking, because it is not always due to inputs and outputs chosen that will determine the banks´ success, maybe it’s those combinations and other factors from the surrounding economies that makes the bank operate at maximum. There are some documents related to production frontiers that used this approach, and they are Grigorian & Manole (2002); Casu & Molyneux (2003), amongst others.
In order to test the proposed hypotheses the equation will be written, generally as follows:
(efficiency scores)i,t= β0 + β1(rating sector)i,t + β2(country rating)i,t+ β3 (size)i,t+ β4 (capital)i,t + β5 (country)i,t + β6(crisis)i,t + ui,t (3)
In this equation, all of the independent variables are dummies that assume the values of 0 or 1. It assumes the value of 0 when, for example, we are not in the presence of a bank that does not have an adequate capital ratio and exhibits 1 if otherwise.
26
The independent variable (rating sector) and the (country rating) will be defined as 4 dummy variables, respectively for the 4 ratings indicators observed in the sample (A, AA, BB and BBB), along the years, for example if the rating sector where a bank operates if denoted with an A rating the dummy will be 1 and 0 if otherwise. The independent variable (size) is defined as in 3 dummies variables, divided in 3 groups, the first with the banks with assets larger than 3 billion euros, called Large Banks, the second with assets between 3 and 1 billion euros, named as Medium Banks, and Small Banks with assets lower than 1 billion euros, as suggested by Berger & Bouwman (2008). The (capital) variable is also a dummy variable, in order to study this impact there will be inserted a dummy of 1, for those compliers of the total capital ratio, which under Basel II, banks are required to maintain a ratio (Tier 1+2+3) at a minimum of 8%, and 0 if otherwise. The (country) variable is defined as the country where the bank operates, represented by dummies being 1 if the bank is from for example Portugal or 0 if otherwise. The (crisis) variable is defined as being a dummy variable separating the period pre crisis, before 2008, and the crisis from 2008 forward, the dummy variable takes the value of 1 if the period is from 2008 forward, in order to reflect the subprime crisis and the subsequent global crisis.
V. Empirical Results
5.1. European Bank Efficiency
27
example Casu & Molyneux (2003), being the mean of efficiency results for 1997 of around 70%, those authors refers to other studies that presented similar results. This result suggests, in other terms, that on average, banks performance situates around 25% inefficiency, this means that they could probably reduce their inputs and still have the same outputs. These results are also similar to those encountered in prior studies, for example in Pastor et al (1997) it used similar inputs and outputs and compared only 7 European countries, from which 6 are part of this research.
28
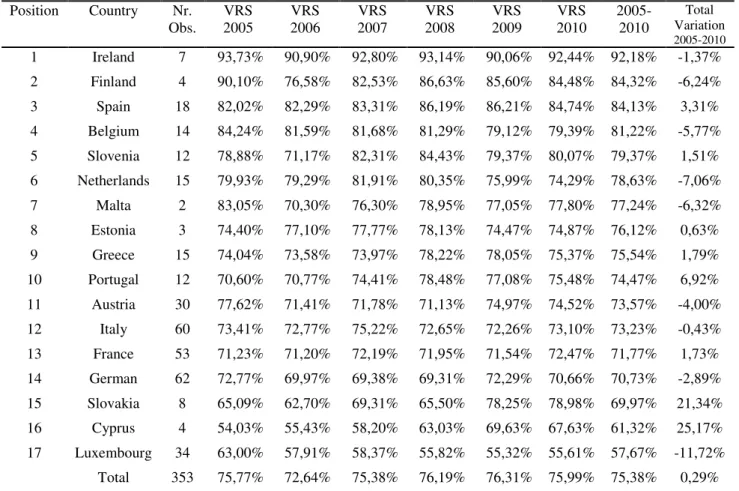
Table II – Country efficiency results evolution by year and overall evolution.
Position Country Nr.
Obs.
VRS 2005
VRS 2006
VRS 2007
VRS 2008
VRS 2009
VRS 2010
2005-2010
Total Variation 2005-2010
1 Ireland 7 93,73% 90,90% 92,80% 93,14% 90,06% 92,44% 92,18% -1,37%
2 Finland 4 90,10% 76,58% 82,53% 86,63% 85,60% 84,48% 84,32% -6,24%
3 Spain 18 82,02% 82,29% 83,31% 86,19% 86,21% 84,74% 84,13% 3,31%
4 Belgium 14 84,24% 81,59% 81,68% 81,29% 79,12% 79,39% 81,22% -5,77%
5 Slovenia 12 78,88% 71,17% 82,31% 84,43% 79,37% 80,07% 79,37% 1,51%
6 Netherlands 15 79,93% 79,29% 81,91% 80,35% 75,99% 74,29% 78,63% -7,06%
7 Malta 2 83,05% 70,30% 76,30% 78,95% 77,05% 77,80% 77,24% -6,32%
8 Estonia 3 74,40% 77,10% 77,77% 78,13% 74,47% 74,87% 76,12% 0,63%
9 Greece 15 74,04% 73,58% 73,97% 78,22% 78,05% 75,37% 75,54% 1,79%
10 Portugal 12 70,60% 70,77% 74,41% 78,48% 77,08% 75,48% 74,47% 6,92%
11 Austria 30 77,62% 71,41% 71,78% 71,13% 74,97% 74,52% 73,57% -4,00%
12 Italy 60 73,41% 72,77% 75,22% 72,65% 72,26% 73,10% 73,23% -0,43%
13 France 53 71,23% 71,20% 72,19% 71,95% 71,54% 72,47% 71,77% 1,73%
14 German 62 72,77% 69,97% 69,38% 69,31% 72,29% 70,66% 70,73% -2,89%
15 Slovakia 8 65,09% 62,70% 69,31% 65,50% 78,25% 78,98% 69,97% 21,34%
16 Cyprus 4 54,03% 55,43% 58,20% 63,03% 69,63% 67,63% 61,32% 25,17%
17 Luxembourg 34 63,00% 57,91% 58,37% 55,82% 55,32% 55,61% 57,67% -11,72%
Total 353 75,77% 72,64% 75,38% 76,19% 76,31% 75,99% 75,38% 0,29%
Notes: This table reports efficiency scores by country, by year and between 2005-2010, under a common frontier, with variable returns to scale (VRS).
29
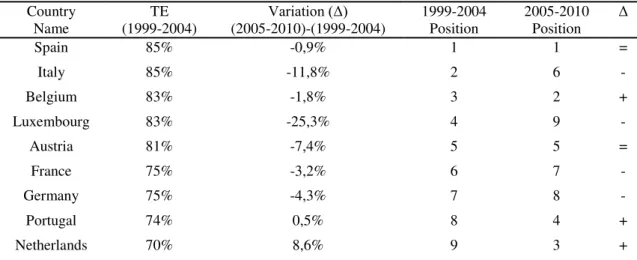
Table III – Evolution of efficiency results from a study of 1999-2004 to the current.
Country Name
TE (1999-2004)
Variation (Δ)
(2005-2010)-(1999-2004)
1999-2004 Position
2005-2010 Position
Δ
Spain 85% -0,9% 1 1 =
Italy 85% -11,8% 2 6 -
Belgium 83% -1,8% 3 2 +
Luxembourg 83% -25,3% 4 9 -
Austria 81% -7,4% 5 5 =
France 75% -3,2% 6 7 -
Germany 75% -4,3% 7 8 -
Portugal 74% 0,5% 8 4 +
Netherlands 70% 8,6% 9 3 +
Notes: This table reports efficiency scores (TE (1999-2004)) as reported by Chortareas et al (2011), TE (1999-2004), indicating the variation (Δ) from findings of Chorteras, TE(1999-2004), and the findings in this study, (2010-2005). Variation (Δ) (2005-2010)-(1999-2004) is calculated by the difference of the results of this work with the Chortareas et al (2011).
The scores of DEA points out the best and worst efficient banks, with those given inputs and outputs, they are shown in the tables IV and V:
Table IV – Best bank performers. Table V – Worst bank performers.
Top 10 TE=100% Bottom 10 TE<25%
Banco Santander SA 100% Bancaperta SpA 29%
Société Générale 100% HSBC Trinkaus & Burkhardt
(International) SA
28%
ING Bank NV 100% Skandinaviska Enskilda Banken SA 22%
Credit Agricole Corporate and Investment Bank
100% UBS (Luxembourg) SA 20%
Credit Mutuel – IFRS 100% VP Bank (Luxembourg) SA 19%
Dexia Crédit Local SA 100% Credit Suisse (Luxembourg) SA 17%
Bank of Ireland 100% Credit Suisse (Deutschland) AG 13%
ING-DiBa AG 100% Banque Privée Edmond de
Rothschild Europe
13%
SNS Bank N.V. 100% Oesterreichische Kontrollbank AG 9%
RCI Banque 100% Bethmann Bank 7%
30
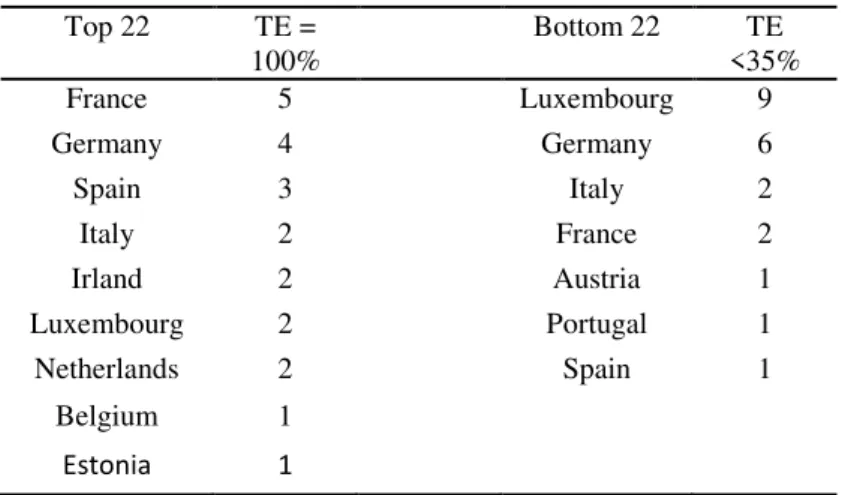
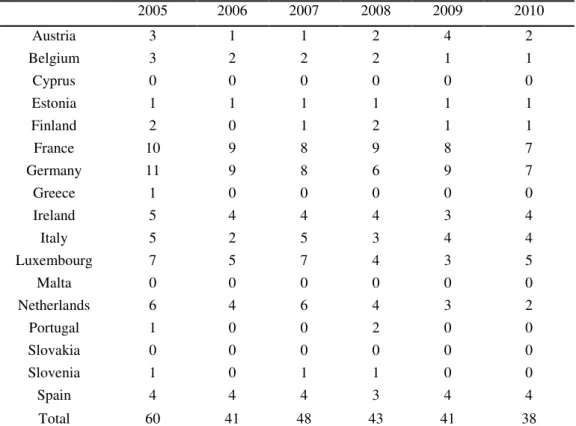
Table VI illustrates the composition of the Euro Zone efficient frontier and the worst bank performances by country. The Production Frontier has 22 technically efficient (TE) banks, for the entire time period, the countries with most TE banks France, Germany and Spain. Table VI also illustrates the country of origin from the worst performing banks, which come mostly from Luxembourg and Germany. Table VII shows the countries with banks that were at least at one time 100% technical efficient (TE). Table VII points out a significant drop of banks that constituted the production frontier from 2005 to 2006. The best bank performers were from France and
Germany and the least were from Luxembourg and Germany. It’s interesting to notice
that there were some countries that never had a bank in the production frontier and those countries were Cyprus, Malta and Slovakia, and with the exception of Malta the other two banking sectors were on the bottom as the least best performers, in mean terms.
Table VI – Banks totally efficient (TE=100%) and worst efficient (TE<35%)
from 2005 to 2010.
Top 22 TE =
100%
Bottom 22 TE
<35%
France 5 Luxembourg 9
Germany 4 Germany 6
Spain 3 Italy 2
Italy 2 France 2
Irland 2 Austria 1
Luxembourg 2 Portugal 1
Netherlands 2 Spain 1
Belgium 1
31
Table VII – Total efficient banks by country.
2005 2006 2007 2008 2009 2010
Austria 3 1 1 2 4 2
Belgium 3 2 2 2 1 1
Cyprus 0 0 0 0 0 0
Estonia 1 1 1 1 1 1
Finland 2 0 1 2 1 1
France 10 9 8 9 8 7
Germany 11 9 8 6 9 7
Greece 1 0 0 0 0 0
Ireland 5 4 4 4 3 4
Italy 5 2 5 3 4 4
Luxembourg 7 5 7 4 3 5
Malta 0 0 0 0 0 0
Netherlands 6 4 6 4 3 2
Portugal 1 0 0 2 0 0
Slovakia 0 0 0 0 0 0
Slovenia 1 0 1 1 0 0
Spain 4 4 4 3 4 4
Total 60 41 48 43 41 38
Notes: The values in this table show the frequency of efficient banks by country along the years.
It’s important to mention that the sample was subject to some bank exclusion,
with no existing data for at least one period, and therefore only the banks that reported their financial accounts for the time period in question were taken into consideration in this analysis. So one of the main problems is that perhaps a bank that bankrupted between this time may have had low levels of efficiency and would therefore diminish the results of efficiency of a determined banking sector and on the other hand it would, if everything remained constant, increase the levels of efficiency, on average, because if it would bankrupt there wouldn’t been taken into account its supposedly low levels of efficiency and would increase the overall country efficiency.
32
33
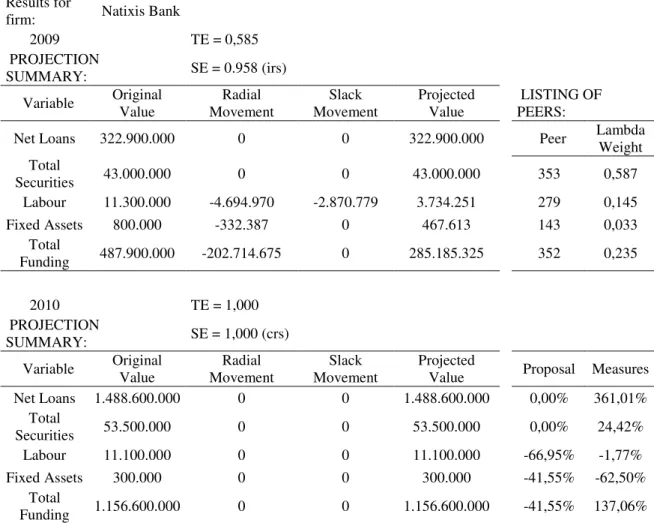
Table VIII –Bank projection to be in the production frontier.
Results for
firm: Natixis Bank
2009 TE = 0,585
PROJECTION
SUMMARY: SE = 0.958 (irs)
Variable Original Value Radial Movement Slack Movement Projected Value LISTING OF PEERS:
Net Loans 322.900.000 0 0 322.900.000 Peer Lambda
Weight Total
Securities 43.000.000 0 0 43.000.000 353 0,587
Labour 11.300.000 -4.694.970 -2.870.779 3.734.251 279 0,145
Fixed Assets 800.000 -332.387 0 467.613 143 0,033
Total
Funding 487.900.000 -202.714.675 0 285.185.325 352 0,235
2010 TE = 1,000
PROJECTION
SUMMARY: SE = 1,000 (crs)
Variable Original Value Movement Radial Movement Slack Projected Value Proposal Measures
Net Loans 1.488.600.000 0 0 1.488.600.000 0,00% 361,01%
Total
Securities 53.500.000 0 0 53.500.000 0,00% 24,42%
Labour 11.100.000 0 0 11.100.000 -66,95% -1,77%
Fixed Assets 300.000 0 0 300.000 -41,55% -62,50%
Total
Funding 1.156.600.000 0 0 1.156.600.000 -41,55% 137,06%
Notes: This table presents the changes in 2009 that they need to do in the input in order to become in frontier and 2010 represents the same company in the frontier with changes made. Radial and Slack movement are the movements, in the inputs, that it needs to be done in order to Natixis Bank reach the frontier. The Proposal stands for percentage of the Original Input value that must be decreased for reaching the frontier. And the measure are the effective measures that were made that lead to the frontier, in percentage.
34 5.2. Determinants of Bank Efficiency
Determinants of Bank Efficiency are found trough a regression that was performed resourcing to Stata 12, and the regression utilized, in order to test the several hypotheses, was the Tobit Regression for panel data, described in Equation 3. The results described in this section can be found in Appendix II and III.
In order to test the influence of the geographical location, the null hypothesis a equality of parameters was tested against the alternative hypothesis (H1) that one pair at least is unequal in each year. The result obtained allows the rejection of the null hypothesis, with a level of significance of 5%, indicating that the location does matter as a determinant of efficiency of banks, being the contributing difference for each country. To examine the power of the banks size, the null hypothesis H0: β9= β10=β11 in opposition to the alternative hypothesis that one pair at least is unequal in each year, the results points out the size importance on efficiency results, with the rejection of the null hypothesis at a level of significance of 5%, meaning that the differentiation of the size of the banks does matter with those results being positively related to the efficiency scores. The results mainly suggest that the bigger the bank, the bigger the results of efficiency.
35
differentiation of the country ratings statistically significant, meaning that the assigned rating to a country would be important when assessing the efficiency scores. In spite of not being statistically different the parameters of the country rating, at a level of significance of 5% or even at 10%, the BB rating of the country would be significant at a level of 15%, meaning that those banks with a BB rating are likely to suffer decreases of efficiency scores, since the coefficient is negative when associated to the efficiency results. A similar event happens on the banking sector risk, the differentiation of the ratings are not statistically significant, but the coefficient of the rating A is statistically significant at a level of significance of 15%, with a positive coefficient, suggesting that rating has contribute positively to the efficiency scores. The coefficient suggest that countries with a better rating may improve their efficiency scores, since rating denotation expresses an favorable opinion towards the country or banking sector. Ratings may provide a positive/negative look upon a determined sector or country attracting/not attracting investors, so it could be assumed that the better the rating, the better the efficiency scores.
36
counterparts (Berger & Bouwman, 2011). The crisis dummy wasn’t found statistically significant at a level of 5% significance, but its coefficient presented a negative sign, if the crisis dummy had to be found statistically significant the crisis had influenced the efficiency results negatively. As such, there does not appear to be a strong relationship between variation in bank capital adequacy and in crisis on efficiency levels.
VI. Conclusion and Future Research
This study investigates the cost efficiency of the Euro Zone banking industry, using a non-parametric function approach, over the period 2005-2010. During this period, a number of significant events took place, amongst them the subprime and the European sovereign debt crisis. These developments have raised questions about competition, bank size, capital adequacy, domestic and international economic conditions, and have brought the issue of bank efficiency to the forefront. Cost efficiency allows banks to have a better notion if their resources are being well employed and also to realize if they could improve their current situation by having a benchmark.
37
This document also investigated the main determinants of those efficiency results and the main results that were presented by the Tobit Regression for Panel Data suggest that the main drivers of efficiency were differentiation on size and on location of the banks. The banking sector and country ratings were also tested in this work but weren’t found statistically significant, at a level of significance of 5%, the ratings differentiation not being statistically significant, although individually the rating of the banking sector A were statistically significant at a level of significance of 10 %, having a positive a relation with efficiency. The crisis and capital adequacy appear to have not been statistically significant as a determinant of efficiency and were found to be negatively related.
In terms of size, this study suggests that larger banks are able to benefit from better efficiency scores, maybe due to the fact that larger banks should pay less for their inputs and there might be increasing returns to scale, i.e. input/outputs ratios could decline with increasing firm size. Larger banks are likely to be viewed as too-big-to-fail, and therefore enjoy higher credibility than their smaller counterparts. These results were also found by Hauner (2005) and Grigorian & Manole (2002), Miller & Noulas (1996), amongst others.
PSI-38
20 with their lower taxes and other incentives, this could result on more business for banks operating in the Netherlands.
Overall, in light of increasing financial crisis pressures, Euro Zone banks will need to further improve their performance in order to respond to new challenges lying ahead and to survive in a highly competitive global environment. While a rationalization of the industry is currently under way and authorities are tightening the regulatory regime, the outlook for the EU economies is still uncertain and this imposes further strains on the quality of the banks’ loan portfolios.
Despite the results, it is important to notice that this work presents some limitations, due to the methodology adopted, and consequently the results displayed do not reflect the entire reality of the bank performance.
39 VII. References
Ajlouni, M., Hmedat, M. & Hmedat, W. (2011). The Relative Efficiency of Jordanian Banks and its Determinants Using Data Envelopment Analysis. Journal of Applied Finance & Banking, vol.1, no.3, pp. 33-58.
Allen, L. & Rai, A. (1996). Operational efficiency in banking: An international comparison, Journal of Banking & Finance, Elsevier, vol. 20 pp. 655-672, May. Altunbas, Y., Gardener, E. & Molyneux, P. (1996), Cost Economies and Efficiency in
EU Banking Systems, Journal of Economics and Business, vol.48, pp. 217-230. Altunbas, Y., Gardener, E., Molyneux, P. & Moore, B. (2001). Efficiency in European
Banking, European Economic Review, Elsevier, vol.45.
Aigner, D., Lovell, C.A. & Schmidt, P. (1977).Formulation and Estimation of Stochastic Frontier Production Function Models, Journal of Econometrics, vol. 6, pp. 21-37.
Apergis, N. & Alevizopoulou, E. (2011). PANOECONOMICS, vol. 3, pp. 329-341. Assaf, A., Barros, C. & Matousek R. (2011). Productivity and efficiency analysis of
Shinkin banks: Evidence from bootstrap and Bayesian approaches. Journal of Bank and Finance, vol. 35, pp. 331-342.
Athanassopoulos, A. (1997). Service quality and operating efficiency synergies for management control in the provision of financial services: Evidence from Greek bank branches, European Journal of Operational Research, vol. 98, pp.300-313. Banker, R D., Charnes, A. & Cooper, W.W. (1984). Some Models for Estimating
Technical and Scale Inefficiencies in Data Envelopment Analysis. Management Science, vol. 30, pp.1078-1092.
Barros, C., Chen, Z., Liang, Qi. & Peypoch, N. (2011). Technical efficiency in the Chinese banking sector, Economic Modelling, Elsevier, vol.28, pp.2083-2089, September.
Barros, C., Managi, S. & Matousek, R. (2012). The technical efficiency of the Japanese banks: Non-radial directional performance measurement with undesirable output, Omega, Elsevier, vol. 40, pp. 1-8, January.
40
Barros, C., Ferreira, C. & Williams, J. (2007). Analysing the determinants of performance of best and worst European banks: A mixed logit approach, Journal of Banking & Finance, Elsevier, vol. 31, pp. 2189-2203, July.
Battese, G. & Coelli, T. (1995). A Model for Technical Inefficiency Effects in a Stochastic Frontier Production Function for Panel Data, Empirical Economics,
vol.20, pp. 325-332.
Benston, G. (1965). Branch banking and Economies of scale, The journal of finance, vol. 20,pp. 312-331, May.
Berger, A. (2007). International Comparisons of Banking Efficiency. Financial Markets, Institutions & Instruments, vol. 16, pp.119–144.
Berger, A. & Humphrey, D. (1997). Efficiency of financial institutions: International survey and directions for future research, European Journal of Operational Research
,vol.98, pp. 175-212.
Berger, A. & Mester, L. (1997). Inside the Black Box: What Explains Differences in the Efficiencies of Financial Institutions?, Journal of Banking & Finance, vol. 21, pp. 895-947.
Berger, A., Leusner, J. & Mingo, J. (1994). The Efficiency of Bank Branches. Center for Financial Institutions Working Papers 94-27, Wharton School Center for Financial Institutions, University of Pennsylvania.
Berger A., Hasan I. & Zhou M. (2009). Bank Ownership and Efficiency in China: What Will Happen in the Worlds Largest Nation?, Journal of Banking and Finance, vol.33, pp. 113–130.
Berger, A. & Bouwman, C. (2011). How Does Capital Affect Bank Performance During Financial Crises?, working paper, the University of South Carolina and Case Western Reserve University.
Bikker, A., Spierdijk, L. & Finnie, P. (2007). The Impact of Market Structure, Contestability and Institutional Environment on Banking Competition, Utrecht School of Economics, Tjalling C. Koopmans Research Institute, Discussion Paper Series 07-29, December.
Bolt, W. & Humphrey, D. (2010). Bank competition efficiency in Europe: A frontier approach, Journal of Banking & Finance, Elsevier, vol. 34, pp. 1808-1817, August. Brockett, P.L., Charnes, A., Cooper, W.W., Huang, Z.M. & Sun, D.B. (1997). Data
41
Charnes, A., Cooper, W. W. & Rhodes, E. (1978). Measuring the efficiency of decision making units, European Journal of Operational Research, Elsevier, vol. 2, pp. 429-444, November.
Chortareas, G. E., Girardone, C. & Ventouri, A. (2011). Financial Frictions, Bank Efficiency and Risk: Evidence from the Eurozone, Journal of Business Finance & Accounting, vol.38, pp. 259-87.
Coelli, T. (1998). A Multi-stage Methodology for the Solution of Oriented DEA Models. Centre of Efficiency and Productivity Analysis, University of New England, mimeo.
Coelli, T. (1996). A Guide to DEAP version 2.1.: Data Envelopment Analysis Computer Program. Discussion Paper 96/08, Department of Econometrics, University of New England, Armidale, Australia.
Coelli T., Rao D. & Battese G. (1998), An introduction to Efficiency and Productivity Analysis, London: Kluwer Academic Publisher.
Camanho, A.S. (1999). Performance Measurement and Improvement in the Management of Bank Branch Networks Using Data Envelopment Analysis, Ph.D. Thesis, Warwick Business School, University of Warwick, U.K.
Cameron, A. & Trivedi, P. (2009). Microeconometrics Using Stata. Stata Press.
Carbo, S., Gardener E.P.M., Williams, J. (2002). Efficiency in Banking: Empirical Evidence from the Savings. Banks Sector. Manchester School, vol. 70, pp. 204-228. Casu, B., Girardorne, C. & Molyneux, P. (2004). Productivity Change in European
Banking: A Comparison of Parametric and Non-parametric Approaches, Journal of Banking and Finance, vol. 28, pp. 2521–2540.
Casu, B. & Molyneux, P. (2003). A comparative study of efficiency in European banking, Applied Economics, vol.35, pp. 1865-1876.
Chen, T. (2002). Measuring firm performance with DEA and prior information in
Taiwan’s banks, Ming-chuan University, Applied Economics Letters, vol. 9, pp 201- 204.
Daley, J. & Matthews, K. (2009). Measuring bank efficiency: tradition or sophistication? – A note, Cardiff business school working paper series, E2009/24. Cardiff : Cardiff Univ, Cardiff Business School, Economics Section.
Farrel, M.J. (1957). The measurement of Productive Efficiency, Journal of the Royal Statistical Society, A CXX, Part 3, pp. 253-290.
42
Department of Economics at the School of Economics and Management (ISEG), Technical University of Lisbon.
Ferreira, C. (2011). Efficiency and integration in European banking markets, Working Papers 2011/08, Department of Economics at the School of Economics and Management (ISEG), Technical University of Lisbon.
Fethi, M. & Pasioura, F. (2010). Assessing bank efficiency and performance with operational research and artificial intelligence techniques: A survey, European Journal of Operational Research, Elsevier, vol. 204, pp. 189-198, July.
Grigorian, D. & Manole, V. (2002). Determinants of Commercial Bank Performance in Transition: An Application of Data Envelopment Analysis, IMF Working Paper
02/146.
Grigorian, D. & Manole, V. (2006). Determinants of Commercial Bank Performance in Transition: An Application of Data Envelopment Analysis, Comparative Economic Studies, Palgrave Macmillan, vol. 48, pp. 497-522, September.
Hauner, D. (2005). Explaining efficiency differences among large German and Austrian banks, Applied Economics, vol.37, pp. 969-980.
Holod,D. & Lewis, H.(2011). Resolving the deposit dilemma: A new DEA bank efficiency model , Journal of Banking & Finance, vol. 35, pp.2801-2810, November. Ioannis E. Tsolas, Dimitris I. Giokas, (2012),Bank branch efficiency evaluation by means of least absolute deviations and DEA, Managerial Finance, Vol. 38, pp. 768 – 785
Iršová, Z. (2009). Measuring Bank Efficiency. Master thesis. Charles University in Prague, Faculty of Social Sciences, Institute of Economic Studies.
Jayamaha, A. & Mula, J. (2011). Productivity and efficiency measurement techniques: Identifying the efficacy of techniques for financial institutions in developing countries. In: 2nd International Conference on Business and Information: Steering Excellence of Business Knowledge (ICBI 2011), October.
Kosmidou, K. (2008). The determinants of banks' profits in Greece during the period of EU financial integration, Managerial Finance, Vol. 34, pp.146–159.
Kumbhakar, S. & Lovell, C. (2000). Stochastic Frontier Analysis. Cambrige: Cambridge University Press.
43
Manandhar, R. & Tang, J. (2002). The evaluation of bank branch performance using data envelopment analysis a framework. Journal of High Technology Management Research, Spring 2002, Vol. 13, pp.1-17.
Maudos, J., Pastor, J., Perez, F. & Quesada, J. (2002). Cost and profit efficiency in European banks, Journal of International Financial Markets, Institutions and Money,
Elsevier, vol. 12, pp. 33-58, February.
Miller, S. & Noulas, A. (1996). The technical efficiency of large bank production,
Journal of Banking and Finance,vol.20, pp. 495-509.
Milma, A. & Hjalmarsson, L. (2002). Measurement of inputs and outputs in the banking industry. Tanzanet Journal. 2002. Vol. 3, pp. 12-22.
Naceur, S. B., & Kandil, M. (2009). The Impact of Capital Requirements on Banks' Cost of Intermediation and Performance: The Case of Egypt, Journal of Economics and Business, vol. 61, pp.70-89.
Kumbirai, M. & Webb, R. (2010). A financial Ratio Analysis of Commercial Bank Performance in South Africa, African Review of Economics and Finance, Vol.2, No.1, December.
Kumbhakar, S. e Lovell, C., (n.d.), Stochastic Frontier Analysis, Cambridge University Press.
Paula, M. (2009). Impacto da crise subprime no sector bancário português. ISCTE, Master Thesis.
Paradi, J. & Zhu, H. ( 2012). A survey on bank branch efficiency and performance research with data envelopment analysis. Omega, Elsevier, Article in Press, February .
Paradi, J., Vela, S. & Yang, Z. (2004). Assessing bank and bank branch performance. In Cooper WW, Seiford LM, Zhu J (Ed.). Handbook on Data Envelopment Analysis, pp.349-400, USA: Kluwer Academic Publishers.
Pastor, J., Perez, P. & Quesada, J. (1997)."Efficiency Analysis in Banking Firms: An International Comparison," European Journal of Operational Research, Vol. 98, pp. 395-407.
Phelps, B., Figueira, C.,Nellis, J. G. & Parker, D. (2003). International Banking Strategy and Efficiency: issues and directions. Cranfield School of Management, U.K., 7 th international conference of the decision sciences institute, shanghai, pp.4-8 July.
44
Said, A. (2012). Efficiency in Islamic Banking during a Financial Crisis-an Empirical Analysis of Forty-Seven Banks , Journal of Applied Finance & Banking, vol.2, no.3, 2012, pp. 163-197.
Sealey. C, & Lindley, J. (1977). Inputs, Outputs, and a Theory of Production and Cost at Depository Financial Institutions. Journal of Finance, vol. 32, pp.1251-66, September.
Scholtens, B. (2000). Competition, Growth, and Performance in the Banking Industry, Center for Financial Institutions Working Papers 00-18, Wharton School Center for Financial Institutions, University of Pennsylvania.
Sun, J. & Wang, H. (2011). Efficiency Evaluation of Commercial Bank Based on DEA,
School of Management , Tianjin University, pp. 792-794
Tavares, G. (2002). A Bibliography of Data Envelopment Analysis (1978 – 2001), Rutgers Center for Operations Research University, Rutcor Research Report RRR 01-02, January.
45 Appendices
Appendix I: Literature on Bank efficiency.
Authors (Year) Area /Time Period Methods Inputs/Outputs
Barros et al. (2011a).
Chinese Banks (1998-2008)
DEA Inputs: Employees/Deposits/Total
Assets
Outputs: Loans / Securities
Barros et al. (2011b).
Japanese Banks (2000-2007)
DEA Inputs: Employees/ Deposits/ Premises
Outputs: Securities/ Loans / Bad Loans
Barros & Borges (2010). Portuguese Banks (1990-2005) Fourier Regression Model Independent Variables:
ROA/ROE/Labour Productivity/ Capital Productivity/Log Total Assets(Sizea)/ Log Bank Product (size pb)/ - Log Total Deposits /Bank Capitalization/ Portfolio Composition
Dependent Variable: Profitability Barros et al.
(2007).
European Commercial Banks (1993-2001) Stochastic Frontier and Fourier (Cost and profit efficiency) Inputs Prices: Financial Capital/Labour/Physical Capital
Outputs: customer loans/ other earning assets/ off-balance sheet items
Berger &
Bouwman (2008).
US Commercial Banks (1984-2008)
Logit Regressions
Capital affects performance
Berger et al. (2003).
Argentine Banks (1993-1999)
Regression by OLS
Domestic, Foreign, State ownership M&A, Foreign Acquisitions and Privatization
Holod & Lewis (2011).
Bank Holding Companies (1986-2008) DEA t-test wilcoxon signed rank tests Spearman rank correlations Pearson Correlations
Inputs: fixed assets/employees
Intermediate Output: Deposits
Outputs: loans/other earning assets
Ferreira (2011). European Countries
(1994-2008)
SFA
Translog Cost Frontier Approach
Inputs: Borrowed Funds/Physical Capital/Labour Outputs:Total Loans/Securities/Other Earning Assets Grigorian & Manole (2002). 17 Countries
Armenia, Belarus, Bulgaria, Croatia, Czech Republic, Estonia, Hungary, Kazakhstan, Latvia,
Lithuania, Moldova, Poland, Romania, Russian
Federation, Slovak Republic, DEA Tobit Analysis
Inputs: Labour/Fixed Assets/Interest Expenditures
Output 1: Revenues/Net Loans/Liquid Assets
46 Slovenia, Ukraine
(1995-1998)
Camanho (1999). Portugal DEA
Cost-effectiveness Cost-efficiency
Intermediation Approach:
Inputs: non interest costs/interest costs from deposits/ interest costs from loans
Output 1: Total value of deposits/loans/off balance sheet; Prices:Fund transfer price of deposits/interest earned from loans/Income from off-balance sheet business
Output 2: total revenue of deposits/loans/off balance sheet Production approach:
Inputs: Nr branch and account managers/nr of administrative and commercial staff/number of
tellers/Operational costs (excluding staff costs)
Outputs: Total value of
deposits/loans/off balance sheet; Prices:Fund transfer price of deposits/interest earned from loans/Income from off-balance sheet business / Nr of general service transactions
Allen & Rai (1997).
11 European Countries Australia/Canada/USA/Japan (1988-1992) Stochastic Cost frontier approach (large and small banks)
Inputs: Price of Labor/Price of fixed Capital/Price of Borrowed Funds
Outputs: Traditional banking assets (Loans)/ Investment Assets Dummy: For time periods
Irsova (2012). US
(1995-2006)
SFA DEA
SFA
Inputs: price of labor/price of funds/price of capital
Outputs: Loans/Deposits/Other Earning Assets
DEA:
Inputs: Personnel Expenses/Deposits and Other Funding/Fixed assets/ Price of Personnel expenses/ Price of deposits/ Price of fixed assets
Outputs: Total Loans/Other Earning Assets/Deposits/Price of Total Loans Price of other earning assets/Price of Deposits
H0: Foreign Ownership/bank size H1: Estimation and definition of variables
Miller & Noulas (1996).
USA (1984-1990)
DEA Regression
Inputs: Total Transactions Deposits/Non-transactions
Deposits/Total Interest Expense/Total non-interest expense
47
Loans/ Investments/ Total Interest Income/ Total Non-interest Income Efficiency:
H0: bank size H1:market power H2:location H3:Profitability
Berger et al. (1997). USA (1989-1991) Fourier Distribution Free Frontier Intermediation Approach:
Inputs:Average wage rate/ Average rental on capital
Outputs:Consumer Transactions Accounts/Consumer non transactions accounts/ business transactions accounts/business non transactions accounts
Production Approach:
Inputs: the as the intermediation approach
Outputs:Nr deposit accounts/nr debits/nr credits/nr accounts opened/nr accounts closed/nr loans originated
Mlima & Hjalmarsson (2002)
Swedish banks (1996)
DEA Production approach:
Inputs: nr branch
offices/inventories/other costs/credit losses/labour/costs or alternatively hours worked
Outputs: loans/ guarantees/deposits/net commissions
Impact of variables Bolt & Humphrey
(2010).
11 European Countries (1987-2006) DFA Translog Functional forms Manandhar & Tang (2002).
Does not mention DEA Inputs: Labor/Supplies/office
space/technology
Output1 (operational):Total service work (e.g. nr transactions and nr accounts opened)/loans
Output2 (services): output 1 = quality of service
3 fases Maudos et al.
(1999).
11 European Countries (1993-1996) DFA FEM REM (Translog Frontier Cost)
Inputs: Cost of loanable funds/Cost of labor/Cost of physical capital
Outputs: Loans/other earning assets/deposits Kumbirai & Webb (2010). South Africa (2005-2009) Ratio Analysis Athanassopoulos (1997).
Greek Bank Branches Does not mention
DEA Inputs: Nr employees; On-line and
48
Outputs: Deposit accounts/Credit/ debit transactions/ loan applications/
transactions involving commissions
Said (2012). Islamci Banks
(2006-2009)
DEA Inputs: Labor cost, Fixed assets, total
deposits
Outputs: Total Loans, liquid assets and other income
Efficiency: H0: location H1: size
Assaf et al (2011). Japanese Banks (2000-2006)
DEA: Malmquist index
Inputs: Total deposits/Labour/ Physical capital
Outputs: Loans, securities
Ajlouni et al (2011).
Jordanian Banks (2005-2008)
DEA Inputs: Total deposits/Total expense
(interest and non-interest expenses)
Outputs: Total loans/Net investments
Daley &
Matthews (2009).
Jamaican Banks (1998-2007)
DEA Inputs: Operating costs/Deposits
Output 1: Total net interest income/ Non-interest income
Output 2: Gross Loans/Investments Output 3: Gross Loans – NPL (net)/Investments
Output 4: Net Loans + Investments NPL
Carbo et al. European Savings Banks
(1986-1996)
Fourier form and stochastic cost frontier
Inputs: labour/physical capital/deposits
Outputs: Total loans/ total securities/off-balance sheet items
Pastor et al. (1997).
7 European Countries USA Commercial banks (1992) DEA Malquimist index Added Value approach
Inputs: personnel expenses/non-interest expenses
Outputs: loans/other productive assets/deposits
Tsolas (2010). Greece
Commercial Bank (2006) DEA Two-stage Inputs:personnel expenses/rental expenses/other operational expenses/depreciation
Outputs: interest income/loans to clients/commissions/other non-interest income
49 Staikouras.(2012). (1998-2008)
Bankscope Technology distance function approach Profit maximization
Labor (personnel expenses)/physical capital (fixed assets)/ total deposits Input prices: of 3 inputs
Outputs: total loans net of provisions/other earning assets Output prices: of 2 outputs
Hauner (2005). German and Austrian banks
Commercial banks
DEA
Regression
Inputs: aggregate funds(interbank deposits/customer deposits/securitized liabilities)/ labour
Outputs: interbank loans/customer loans/fixed-income securities Efficiency:
H0: size Casu & Molyneux
(2003).
Banks from 5 European Countries Commercial/Savings and others (1993-1997) Bankscope DEA Tobit Regressions
Inputs: total costs (interest expenses/non-interest
expenses/personnel expenses)/ total deposits (total customers and short term funding)
Outputs: Total Loans/Other earning assets
Variables: Country dummies
ETA (equity to total assets ratio) ROAE
Commercial or not dummies Quoted dummies
Casu et al. (2004). European Banking 5 countries (large banks) (1994-2000)
DEA Intermediation approach
Inputs: average cost of labour/Deposits/Capital Outputs: total loans/ securities Brockett et al.
(1997).
Us Banking (300 large banks)
(1983-1985)
DEA Inputs: Interest expense ( Interest
expenses on deposits/expense for federal funds purchased and repurchased in domestic offices) Non-interest expense (Salaries and employees
benefits/occupancy expense, furniture, and equipment) Provision for Loan Losses, Total Deposits ( Sum of interest bearing and noninterest bearing
deposits)
Outputs: Interest income (interest and fees on loans/income on federal funds sold and repurchases in domestic office) Total Non-interest income; Allowances for loan losses;Total Loans ( Loans, net of unearned income)
Altunbas et al. (2001). 15 countries European Banking (1989-1997) Bankscope Fourier Functional form and Stochastic cost frontier methodologies
Inputs: Price of labour; Price of funds; Price of physical capital
Outputs: Total loans; Total securities; Off-Balance sheet activities