FACULDADE DE CIÊNCIAS
DEPARTAMENTO DE BIOLOGIA ANIMAL
Effects of Environment and Genetic Background on
Transposable Element Activity in Drosophila melanogaster
Mestrado em Biologia Evolutiva e do Desenvolvimento
Ana Teresa Mendes Eugénio
Dissertação orientada por:
Élio Sucena
(Faculdade de Ciências da Universidade de Lisboa)
Patrícia Beldade
Resumo em Português
Os transposões são sequência de ADN repetitivas que se replicam de forma independente e que são capazes de alterar a sua posição dentro do genoma hospedeiro. Estão presentes em todos os eucariotas estudados até à data e em cerca de 80% dos procariotas (Touchon et al. 2007), constituindo uma porção variável dos genomas, desde 1%, como no fungo Fusarium
graminearum (Cuomo et al. 2007), até cerca de 85%, como nas espécies de milho Zea mays e Zea luxurians (Tenaillon et al. 2011, SanMiguel et al. 1996). Em humanos, os transposões
constituem cerca 50% do genoma (Mills et al. 2007) e em Drosophila melanogaster cerca de 20% (Mukamel et al. 2013, Barr et al. 2014).
Os transposões são geralmente classificados de acordo com o seu mecanismo de transposição, ou seja, como se movem dentro do genoma hospedeiro. Wicker et al. (2007) propuseram um sistema de classificação que se tornou consensual e no qual os transposões são divididos em duas classes. A Classe I compreende os retrotransposões, semelhantes a retrovírus e que transpõem através de um intermediário de ARN, são reconvertidos em ADN pela enzima Transcriptase Reversa e são reintegrados novamente no genoma, num mecanismo ao qual se designou transposição de copiar-e-colar. Os membros desta classe dividem-se em duas ordens – os LTRs, que possuem longas repetições terminais (long terminal repeats) e os não-LTRs, que não possuem essas sequências. A Classe II inclui os transposões de ADN, que utilizam um mecanismo de cortar-e-colar, não passando por um intermediário de ARN, e que possuem, na sua maioria, repetições terminais invertidas (TIRs, terminal inverted repeats)(Pray 2008). Quando se movem dentro do genoma, os transposões podem causar mutações que contribuem para a criação de novos variantes genéticos que podem servir de matéria prima para a evolução (Wagner et al. 2005). A transposição pode afetar a regulação de genes fornecendo, por exemplo, promotores novos, locais de splicing e sinais de poliadenilação (Cowley et al. 2013). Há dados que indicam um papel dos transposões na adaptação em populações naturais (González et al. 2008) e de laboratório (Sousa et al. 2013) e na evolução de caracteres novos (Bourque et al. 2008).
Apesar de serem uma fonte de variação genética e inovação, a amplificação e mobilização de transposões tem geralmente efeitos prejudiciais ao hospedeiro, ao se inserirem em genes que codificam proteínas, alterando redes de regulação de transcrição e causando quebra de cromossomas e rearranjos genómicos a grande escala (McClintock 1951, Hedges et al. 2007). Para evitar estes efeitos, os organismos evoluíram mecanismos para reprimir e silenciar transposões, como os piARNs na linha germinal (Klattenhoff et al. 2007) e mecanismos epigenéticos como metilação e modificação da cromatina nas células somáticas (Slotkin et al. 2007).
Drosophila melanogaster, também conhecida por mosca da fruta ou mosca do vinagre, é um sistema laboratorial modelo para estudos de genética e é também muito usada em investigação na área da biologia evolutiva e do desenvolvimento (Arbuthnoot et al. 2014, Campos et al. 2014, Tiwari et al. 2015).
Existem várias ferramentas genéticas disponíveis para este organismo, inclusivamente para o estudo dos transposões que se encontram inseridos no seu genoma. Um desses recursos é o
Drosophila melanogaster Genetic Reference Panel (DGRP) (Mackay et al. 2012, Huang et al.
2014), que consiste num conjunto de cerca de 200 linhas isogénicas completamente sequenciadas, provenientes de uma única população natural. Através de anotação in silico das sequências genómicas, conhece-se a posição e identidade dos transposões inseridos nessas linhas.
Apesar dos grandes avanços que têm sido feitos no sentido de caracterizar transposões e de se descobrirem mecanismos que os silenciem e/ou controlem a sua expressão, tanto nas células da linha germinal como em tecidos unicamente somáticos, ainda não se sabe ao certo o que aciona e altera a transposição dos transposões. No entanto, é reconhecido que, como em muitos outros processos biológicos, a ativação destes elementos pode ser afetada por fatores genéticos e ambientais (Capi et al. 2000).
A temperatura é um fator ambiental importante que afeta o fitness do organismo a nível de fecundidade, viabilidade e sobrevivência (Allen et al. 2011, Stoks et al. 2011, Ciota et al. 2014). Em plantas, sabe-se que o aumento da temperatura pode levar a um aumento da expressão dos transposões (Grandbastien et al. 2005). Por outro lado, em Drosophila melanogaster, os estudos têm sido inconclusivos, havendo experiências onde o aumento de temperatura afeta e amplifica a expressão dos transposões (Zabanov et al. 1990, Vasilyeva et al. 1999, Bubenshchikova et al. 2002) e outras onde não se vê qualquer efeito (Arnault et al. 1997, Alonso-González et al. 2006, Vázquez et al. 2007).
Um outro fator ambiental potencialmente relevante é a presença da bactéria Wolbachia, maternalmente transmitida e presente em muitas espécies de insetos, crustáceos e nematodes filamentosos (Stouthamer et al. 1999). Este simbionte confere resistência a vírus em Drosophila melanogaster (Teixeira et al. 2008, Hedges et al. 2008) e, tendo em conta que muitos transposões possuem características semelhantes às dos vírus (Schaack et al. 2010, Xiong and Eickbush, 1988), é possível que este simbionte confira também alguma proteção contra transposões.
Nesta dissertação, utilizámos linhas DGRP para estudar potenciais efeitos do genótipo e dos fatores ambientais acima descritos na atividade dos transposões de Drosophila melanogaster. Focámos o estudo na expressão de transposões nos ovários, pois é na linha germinal que alterações na atividade destes elementos poderão ser herdadas pela geração seguinte e contribuir para a variação genética da população.
O nosso primeiro objetivo foi validar as previsões feitas in silico para as linhas do DGRP relativamente à localização e identidade das inserções de transposões. Para isso, sequenciámos várias inserções do painel e confirmámos a posição e identidade para a maioria dessas inserções. Isto nunca tinha sido testado e os nossos resultados conferem alguma robustez às previsões in silico feitas para o painel para que possam ser usadas com maior confiança em estudos futuros.
Observámos diferenças evidentes entre genótipos na expressão de alguns mas não todos os transposões. Também observámos que as diferenças entre os genótipos para um mesmo transposão não podiam ser explicadas pelo número de inserções.
Finalmente, testámos os efeitos da temperatura e Wolbachia, em várias linhas DGRP, na expressão de transposões e concluímos que ambos os fatores ambientais afetam a expressão destes elementos, embora a forma como são afetados varie de acordo com o transposão e com o genótipo.
A temperatura poderá estar a afetar transposões que se encontrem sob o efeito de enhancers ou fatores de transcrição sensíveis a temperatura ou a afetar os mecanismos de repressão dos transposões, como os piARNs. Tal podia ser testado procurando-se enhancers e fatores de transcrição cujas sequências estejam anotadas em bases de dados. Podia-se também sequenciar piARNs de uma linha do DGRP após ter sido sujeita a diferentes condições de temperatura e verificar se quando há efeito da temperatura também há alteração nos piARNs. Não se sabe ainda como é que Wolbachia confere resistência a vírus e, consequentemente, como poderá estar a afetar a expressão dos transposões. Para testar se o efeito de Wolbachia está relacionado com os mecanismos de repressão dos transposões poder-se-iam comparar piARNs de ovários de uma linha infetada com Wolbachia e piRNAs da mesma linha mas na qual
Wolbachia fora removida.
Tendo em conta que as observações feitas neste estudo foram focadas em ovários, seria também interessante testar tecidos da linha germinal masculina (testículos) e em tecidos unicamente somáticos (como os dos tóraxes) para compreendermos se os efeitos ambientais sobre os transposões são específicos de um tecido ou se é um efeito geral, afetando todo o corpo do organismo. Pensamos que é de esperar o favorecimento de um mecanismo que beneficie a geração de variabilidade genética na descendência, em caso de perturbação ambiental, pois alguns desses variantes genéticos poderão ter melhor capacidade de sobrevivência e reprodução nas novas condições ambientais.
English Summary
Transposable elements (TEs) are repetitive DNA sequences capable of changing their position within the genome, potentially causing mutations (Wagner et al. 2005). They play an important role in the evolution of novel gene regulation (Cowley et al. 2013) and novel traits (Bourque et
al. 2008). TE mobilization, however, can also be harmful to the host, by disrupting
protein-coding genes, altering transcriptional regulatory networks and causing chromosomal breakage and genomic rearrangements (Hedges et al. 2007).
Great advances have been made in characterizing TEs and in finding repression mechanisms to control their activity. However, what triggers and changes the transposition that leads to new insertions in natural populations is still largely unexplored. Still, it is recognized that it can be affected by both genetic and environmental factors (Capi et al. 2000).
Drosophila melanogaster is a genetic model vastly used for biological research, including in
evolution and developmental biology (Arbuthnoot et al. 2014, Tiwari et al. 2015). There are available genetic tools and information on TEs for this species, including the Drosophila
melanogaster Genetic Reference Panel (DGRP) (Mackay et al. 2012), which contains fully
sequenced isogenic lines and in silico predictions about TE insertions.
In this study, we used DGRP lines to test the effects of genotype and of environmental perturbations, namely temperature and Wolbachia, on TE expression. We first aimed at validating in silico predictions for TE insertions and identity in DGRPs, by sequencing insertions described in the panel. We confirmed most of the tested sites. We then searched for associations between TE expression and copy number, finding clear effects of genetic background on TE expression, albeit not the same for all TEs. Lastly, we checked for an effect of temperature and Wolbachia on TE expression and found that these factors affect TE expression in a different way for different TEs and genotypes.
Palavras-chave / Key-words
Variação Genética / Genetic Variation
Efeitos do Fundo Genético / Genetic Background Effects
Efeitos Ambientais / Environmental Effects
Index
Page
Acknowledgements 7
Introduction 8
Transposable Elements (TEs) 8
Study System 9
Aims &Tasks 11
Materials & Methods 12
Fly stocks, transposable elements and genotypes 12
gDNA extraction, amplification and sequencing for Task 1 15
Ovary dissection, RNA extraction, and cDNA synthesis for Tasks 2 and 3 16
Quantitative real-time PCR (qPCR) for Tasks 2 and 3 17
qPCR Data analysis 17
Results 19
Most in silico predictions for TE position and identity in tested DGRP lines
were confirmed 19
Genotype affects TE expression, albeit not equally for all TEs 20
Temperature, Wolbachia and the interaction of the two factors have effects on TE expression, depending on the TE and genotype 24
Discussion 28
Aim 1: Test the effect of genotype in TE expression 28
Aim 2: Test the effect of environmental perturbation and genotype on TE
expression levels 29
Hindsight and perspectives 30
Bibliography 32
Acknowledgments
This dissertation would not have been possible without the guidance and support of the amazing people that were always present for me during this journey.
First of all, I want to thank Patrícia Beldade for taking me in her group and trusting in my capacities and will. She was a great supervisor, giving me meaningful advice and autonomy to develop my ideas and being the pragmatic and assertive voice when I needed it.
Secondly, and no less important, I want to thank Marta Marialva. She is the person that most directly tutored me, as my dissertation was a branch of her PhD. I was extremely lucky to have had her by my side. She taught me all the techniques and protocols of this dissertation, being very patient and letting me learn with my mistakes. I felt that my opinions and doubts were valued and I will always be grateful for all the time and effort she dedicated me and this project.
I am also thankful to all the other members of our lab, for all opinions, interest and motivation, and also to the wonderful Evo-Devo community at IGC, especially for their feedback during labmeetings.
Finally, I want to thank my lovely family and friends, always there to motivate and support me in the good and not so good moments.
For them and everyone else that in one way or the other contributed to this project and to my growth as a scientist and as a person, thank you.
Introduction
1.1 – Transposable Elements (TEs)
Discovered by Barbara McClintock in 1948, (McClintock 1951, Pray and Zhaurova 2008) the transposable elements (TEs) are repetitive DNA sequences capable of changing their position and replicating independently in host genomes. They can be found in all eukaryotes studied so far and in about 80% of prokaryotes (Touchon et al. 2007), constituting from 1% of genomic sequences in some species, like the fungus Fusarium graminearum (Cuomo et al. 2007), up to 85% in some plants, like the maize species Zea mays and Zea luxurians (Tenaillon et al. 2011, SanMiguel et al. 1996). TEs constitute about 50% of the human genome (Mills et al. 2007) and 20% in Drosophila melanogaster (Mukamel et al. 2013, Barr et al. 2014).
TEs are usually classified according to their transposition mechanism inside the host genome. Wicker et al. (2007) proposed a consensual classification system, in which Class I TEs, also called retrotransposons, are similar to retroviruses and transpose via an RNA intermediary. They are first transcribed into RNA, which is then converted to DNA by the Reverse Transcriptase enzyme before re-integration in the genome. This results in a mechanism of
copy-and-paste for transposition. Retrotransposons can be divided into two major orders -
LTRs and non-LTRs, according to whether they possess Long Terminal Repeats or not, respectively (Wicker et al. 2007). Class II TEs, or DNA transposons, use a mechanism of
cut-and-paste, in which TE DNA is cut out of its original location and re-integrated in a new
location. Many Class II TEs have terminal inverted repeats (order TIR) (Pray 2008).
TE transposition can cause mutations, adding to the genetic variation in a population when they occur in the germline (Wagner et al. 2005). TEs can play an important role in the evolution of gene regulation by providing, for example, novel promoters, splice sites or polyadenylation signals (Cowley et al. 2013). They have been implicated in adaptation in laboratory (Sousa et al. 2013) and natural populations (González et al. 2008) and in the origin of novel traits (e.g. Bourque et al. 2008). For example, the primate CYP19 placenta-specific promoter and uterine-specific enhancers of prolactin are derived from transposable elements (Wagner et al. 2005). They are also implicated in the evolution of cichlid fish egg-spots (Santos
et al. 2014) and the pigmentation diversity observed in medaka fish is associated with the TE
Tol2 (Pray, 2008).
TEs can be a source of beneficial genetic variation and innovation, and many TE copies end up accumulating mutations at a neutral rate and eventually decay and disappear (Venner et al. 2009). However, TE mobilization and amplification can also be harmful to the host when, for example, they disrupt protein-coding genes, alter transcriptional regulatory networks, or cause chromosomal breakage and large-scale genomic rearrangements (McClintock 1951, Hedges et
al. 2007).Since, like other mutations, TE insertions are often deleterious, host genomes have evolved mechanisms to control TE activity and protect host genome and health. In D.
melanogaster somatic cells, TEs are mainly repressed by epigenetic mechanisms, such as
For example, nucleosomes associated with TE insertions can be enriched with methylated histones, repressing transcription in those genomic regions (Slotkin et al. 2007).
In the germline and somatic cells of Drosophila reproductive organs, one important mechanism of TE silencing is the piRNA pathway (Klattenhoff et al. 2007). PiRNAs are a class of small RNAs (Piwi-interacting RNAs), found in clusters throughout the genome (O’Donnell et al. 2007) and interacting with Argonaute proteins of the Piwi clade (Piwi, Aubergine, and Argonaute 3) (Aravin et al. 2007). There is a positive feedback loop between TE expression and piRNA biogenesis called the ping-pong cycle (Brennecke J et al. 2007), in which Piwi proteins engage in an amplification loop between piRNA clusters and active TEs. The TE transcript, loaded with antisense piRNA, is cleaved by Aubergine, triggering the production of Argonaute 3-bound piRNAs, which catalyze the production of more competent silencing piRNAs (Malone C D et al. 2009). Defects in the piRNA pathway and the consequent increase in TE activity have serious implications for the host genome, including the fragmentation of zygote genome during cleavage stage of embryonic divisions (Khurana et al. 2010) and hybrid dysgenesis phenomena, both documented for D. melanogaster (Bregliano et al. 1980, Brennecke et al. 2007).
Great advances have been made in characterizing TEs and in finding host repression mechanisms in somatic and germline tissues. However, what triggers and changes the transpositionthat leads to new insertions in natural populations is still largely unexplored. Still, it is recognized that, like many other biological processes, the mechanism is affected by genetic and environmental factors, as well as by interactions between them (Capi et al. 2000).
1.2 – Study System
DROSOPHILA MELANOGASTER AS MODEL ORGANISMDrosophila melanogaster, commonly known as fruit fly or vinegar fly, is a model genetics
system widely used in biological research, including evolutionary and developmental biology (Arbuthnoot et al. 2014, Campos et al. 2014, Tiwari et al. 2015). The study of TEs in D.
melanogaster is made easier by the fact that they are well annotated and their main
mechanism of repression in the germline, the piRNA pathway, is well described (Olivieri et al. 2012, Muerdter et al. 2013, Shibata et al. 2015). The plethora of genetic tools and resources available for D. melanogaster include information about TE composition and position in different genetic backgrounds.
The Drosophila melanogaster Genetic Reference Panel (DGRP) (Mackay et al. 2012, Huang et
al. 2014) consists of around 200 fully sequenced isogenic lines derived from a single natural
population collected from Raleigh, North Carolina, USA, in 2003. Mackay et al. used whole-genome sequence data of 147 of the DGRP lines to make in silico predictions about TE insertions. They identified 149 families of TEs and estimated the number and position of the 147 genomes, for a total of 197,402 insertions. Based on whether they are or not found in the
We used information about TE insertions in the DGRPs to select in which lines to test different aspects of TE activity. We reasoned that shared insertions, which are also present in most DGRP isogenic lines, are presumably more ancestral and/or of inactive TEs. Conversely, for novel insertions, which are unique to a single isogenic DGRP (around 50%) or present in just a few DGRP lines, we reasoned that they are likely to be more recent and/or of active TEs. We selected target genotypes and TEs to cover a wide range in numbers of novel insertions and quantified TE expression to check for an association with TE number and to test the effects of environmental perturbations.
ENVIRONMENTAL PERTURBATIONS(
ABIOTIC AND BIOTIC FACTORS)
It is well documented that the environment can affect the production of phenotypic variation. This includes effects on mutation rates or types, which result in the generation of novel genetic variants, as well as effects on developmental rates and trajectories, which underlie phenotypic plasticity (Beldade et al. 2011). Both abiotic and biotic environmental factors can play a role and, among these, external temperature and interactions with endosymbionts have well described effects in the biology of organisms and which were the focus of this study.
Temperature is an important and well-studied abiotic factor that can affect organisms’ fitness traits such as fecundity, viability, and survival (Allen et al. 2011, Stoks et al. 2011, Ciota et al. 2014). Temperature differences have also been implicated in TE dynamics. While in plants it has been described that temperature perturbation can increase TE expression, similar studies in D. melanogaster have had mixed results (Grandbastien, 2005). In some studies, higher temperatures were described to increase TE expression (Zabanov et al. 1990, Vasilyeva et al. 1999, Bubenshchikova et al. 2002), while others described no effect whatsoever (Arnault et al. 1997, Alonso-González et al. 2006, Vázquez et al. 2007). The work of Ratner et al. (1992) and Arnault et al. (1994) are good examples of this. Both studied the effect of increasing temperature on the activity of TE 412, but had different results. While Ratner et al. reported an increase in transposition, Arnault et al. found no effect. It is unclear to what extent these contradicting results might be explained by genetic background effects or by differences in other environmental factors, such as bacterial infections.
The maternally transmitted endosymbiont Wolbachia is a genus of bacteria that infects many species of insects, crustacean and filarial nematodes (Stouthamer et al. 1999). Wolbachia
pipientis is known to protect Drosophila melanogaster against viral infections (Teixeira et al.
2008, Hedges et al. 2008) and, since TEs are in many ways virus-like and some even produce virus-like particles (Schaack et al. 2010), we hypothesized that Wolbachia might also affect TE activity.
Here, we will use D. melanogaster isogenic lines and respective TE information from the DGRP to study the effect of genetic background and of environmental factors (temperature and
2 – Aims & Tasks
AIM 1:
TEST THE EFFECT OF GENOTYPE ON TE EXPRESSIONTask 1: Experimentally validating in silico predictions of TE insertions and respective identity in DGRPs, in order to confirm the reliability of the panel’s information about TEs.
Task 2: Checking whether there is an association between TE expression in the ovaries and TE copy number, within different DGRP isogenic lines. We expect to see TE expression depending on number of novel insertions (TEs with higher number of novel insertions, hence higher activity, should be more expressed).
AIM 2:
TEST THE EFFECT OF ENVIRONMENTAL PERTURBATION AND GENOTYPE ON TE EXPRESSIONTask 3: Checking the effect of temperature (an external abiotic factor) and of Wolbachia (an internal biotic factor) on TE expression in different DGRP isogenic lines. We hypothesize that temperature has an effect on TE expression, probably not the same for all genotypes, and that the levels of TE expression should be lower in the presence of Wolbachia.
Materials & Methods
Fly stocks, transposable elements and genotypes
FLY STOCKSWe selected Drosophila melanogaster lines from the Drosophila Genetic Reference Panel (DGRP) (Mackay et al., 2012): 026, 357, 381, 443, 761, 810, RAL-812, RAL-892 and RAL-908 for Task 1, RAL-021, RAL-237, RAL-321, RAL-357, RAL-358, RAL-375, RAL-391, RAL-790, and RAL-908 for Task 2 and RAL-021, RAL-237, RAL-321 and RAL-790 for Task 3.
Flies were reared at 25°C, 60% humidity, 12hr:12hr light:dark cycles and on standard food, unless otherwise mentioned.
In Task 2 and 3, some lines used were naturally infected with Wolbachia – RAL-021, RAL-237, RAL-321 and RAL-790, and for them we derived new lines with same genetic background from where we removed Wolbachia. Infected lines were treated with 0.05 mg/ml of tetracycline hydrochloride (Sigma) mixed with standard food (Teixeira et al., 2008), administrated by feeding for two generations (Min and Benzer, 1997). After Wolbachia removal, we restored the gut flora by sterilizing embryos with 2% sodium hypochlorite and placing them in standard food mixed with gut bacterial inoculum from the respective non-treated lines, as described in Chrostek et al. (2013). We then confirmed that Wolbachia had been completely removed by PCR, using the same primers and amplification conditions as described in Teixeira et al. (2008). For Task 2 we only used flies cleaned of Wolbachia, for Task 3 we used both stocks, with and without Wolbachia infection.
TASK 1:
VALIDATING DGRP IN SILICO PREDICTIONS FOR TE INSERTIONS AND IDENTITYTransposable elements: For each in silico prediction of a TE insertion site, there were several TEs possibly inserted, each with an associated probability based on sequence similarity (Mackay et al., 2012). In this study, we considered the TE with highest probability for each insertion position. We then randomly selected 52 predicted novel insertions of ten distinct TEs (TEs in Table 1). For more information about the genomic place of each insertion, TE associated and corresponding probability of identity see supplementary Table S1.
DGRP lines: We used eight DGRP lines to confirm the 52 selected insertions (DGRP lines in Table 1). Some insertions were confirmed in more than one genotype. RAL-026 was used as negative control, as no TE insertion was predicted in the selected positions of that genotype. See also supplementary Table S1 for more information about the insertions confirmed in each DGRP line.
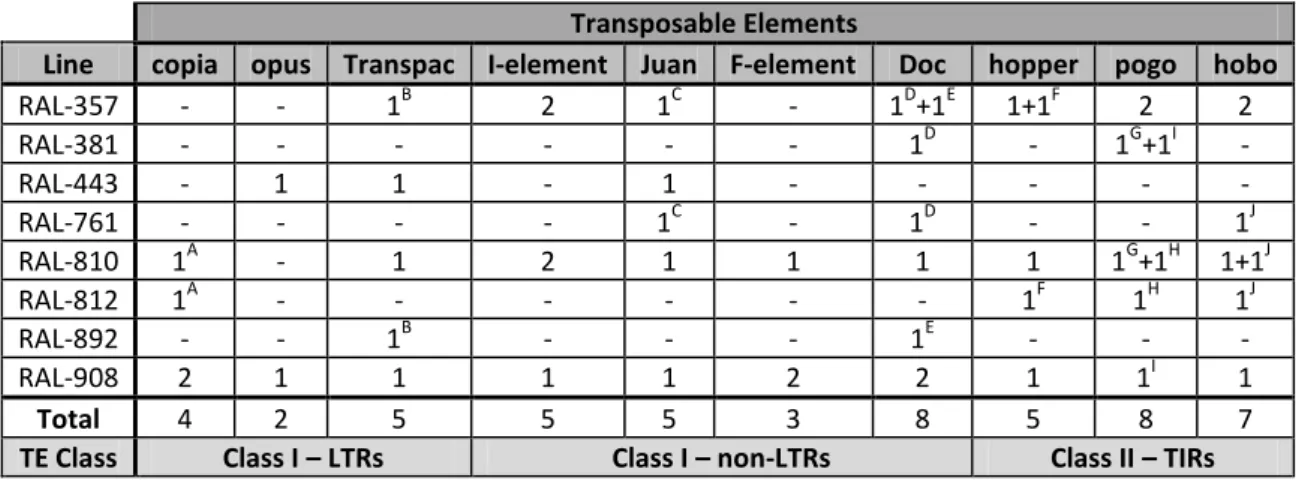
Table 1: TEs and DGRP lines used in Task 1, with respective number of novel insertions studied. The
same insertions tested in more than one genotype are represented with the same letter. “-” indicates a line in which we did not study any insertion of that TE.
Transposable Elements
Line copia opus Transpac I-element Juan F-element Doc hopper pogo hobo
RAL-357 - - 1B 2 1C - 1D+1E 1+1F 2 2 RAL-381 - - - 1D - 1G+1I - RAL-443 - 1 1 - 1 - - - - - RAL-761 - - - - 1C - 1D - - 1J RAL-810 1A - 1 2 1 1 1 1 1G+1H 1+1J RAL-812 1A - - - 1F 1H 1J RAL-892 - - 1B - - - 1E - - - RAL-908 2 1 1 1 1 2 2 1 1I 1 Total 4 2 5 5 5 3 8 5 8 7
TE Class Class I – LTRs Class I – non-LTRs Class II – TIRs
TASK 2:
CHECKING FOR ASSOCIATION BETWEEN TE EXPRESSION AND COPY NUMBERTransposable elements: We studied the expression of the ten TEs with the highest number of novel insertions in the DGRP lines and Cr1a, an element with many shared insertions but almost no novel insertion in the DGRP (TEs in Table 2).
DGRP lines: We checked TE expression in nine DGRP lines (Table 2), albeit not all lines for each TE. These lines have variable number of novel and shared insertions for the TEs in study (number of insertions of each TE for all lines can be found in supplementary Table S3). We removed Wolbachia of the lines that are naturally infected with this endosymbiont.
TASK 3:
CHECKING THE EFFECT OF TEMPERATURE AND WOLBACHIA ON TE EXPRESSION IN DIFFERENTDGRP LINES
Transposable elements: We looked at the expression of seven TEs (in Table 3), a subset of the TEs that were also used in Task 2.
DGRP lines: We used DGRP lines naturally infected with Wolbachia and the lines derived from them where Wolbachia was removed (Table 3).
Experimental setup for temperature perturbation: For each line (with and without
Wolbachia), five virgin females and two males (both genders were 0-8h old) were kept
together in vials for three days at 25°C. Males were then removed and females were placed at different temperatures (21°C, 25°C, and 29°C) for four days (preliminary data using flies from the “wild-type” OregonR line showed changes in TE expression in ovaries at day 4 after temperature perturbation).
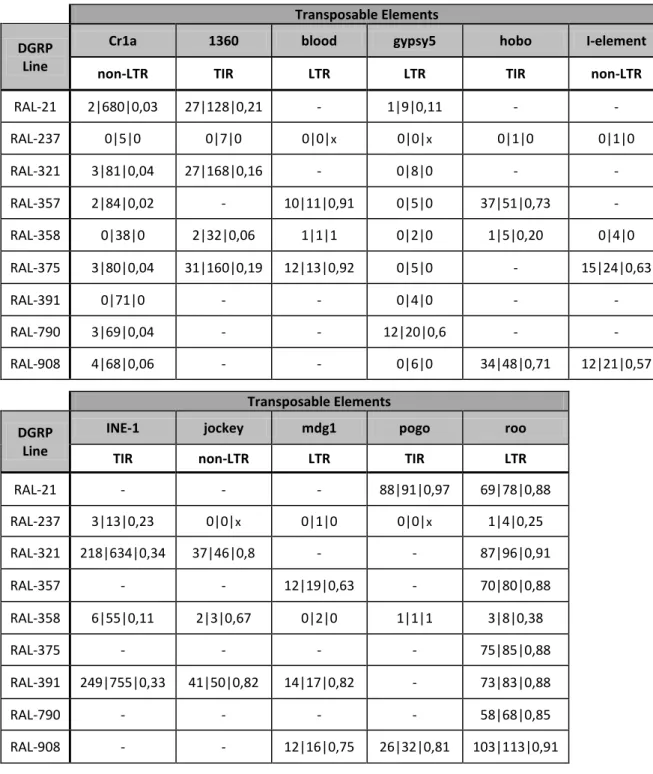
Table 2: TEs and DGRP lines used in Task 2, with respective number of novel l total l proportion of novel
(ratio novel/total) insertions. “-” indicates a line in which the TE was not studied.
Transposable Elements DGRP
Line
Cr1a 1360 blood gypsy5 hobo I-element
non-LTR TIR LTR LTR TIR non-LTR
RAL-21 2|680|0,03 27|128|0,21 - 1|9|0,11 - - RAL-237 0|5|0 0|7|0 0|0|x 0|0|x 0|1|0 0|1|0 RAL-321 3|81|0,04 27|168|0,16 - 0|8|0 - - RAL-357 2|84|0,02 - 10|11|0,91 0|5|0 37|51|0,73 - RAL-358 0|38|0 2|32|0,06 1|1|1 0|2|0 1|5|0,20 0|4|0 RAL-375 3|80|0,04 31|160|0,19 12|13|0,92 0|5|0 - 15|24|0,63 RAL-391 0|71|0 - - 0|4|0 - - RAL-790 3|69|0,04 - - 12|20|0,6 - - RAL-908 4|68|0,06 - - 0|6|0 34|48|0,71 12|21|0,57 Transposable Elements DGRP Line
INE-1 jockey mdg1 pogo roo
TIR non-LTR LTR TIR LTR
RAL-21 - - - 88|91|0,97 69|78|0,88 RAL-237 3|13|0,23 0|0|x 0|1|0 0|0|x 1|4|0,25 RAL-321 218|634|0,34 37|46|0,8 - - 87|96|0,91 RAL-357 - - 12|19|0,63 - 70|80|0,88 RAL-358 6|55|0,11 2|3|0,67 0|2|0 1|1|1 3|8|0,38 RAL-375 - - - - 75|85|0,88 RAL-391 249|755|0,33 41|50|0,82 14|17|0,82 - 73|83|0,88 RAL-790 - - - - 58|68|0,85 RAL-908 - - 12|16|0,75 26|32|0,81 103|113|0,91
Table 3: TEs and DGRP lines used in Task 3, with respective number of novel l total l proportion of novel
(ratio novel/total) insertions.
gDNA extraction, amplification and sequencing for Task 1
A pool of ten males per line was used for genomic DNA (gDNA) extraction, with Qiagen - DNeasy Blood & Tissue Kit, following the manufacturer’s instructions. Males were preferred because they have less fat, which ensures a higher efficiency of the DNA extraction and purification procedure, as seen in preliminary studies. We pooled the 10 males into microcentrifuge tubes, killed them on dry ice and then their bodies were disrupted in 180µL of Buffer ATL (Qiagen protocol) using pestles. We used 200µL of Buffer AE to elute gDNA and its concentration was measured in Nanodrop (Nanodrop Technologie, Inc.) and stored at -20°C. For all 52 selected insertion sites on gDNA from the control line RAL-026, we performed a PCR (total volume of 10μL with 1μL of gDNA, 0.5μL of each primer 10μM) with the following program cycle: 94°C for 4 min; 94°C for 1 min; 35 cycles of 94°C for 30s, primer pair annealing
temperature for 30s and 72 °C for 30 s; 72 °C for 5 min. We used primers flanking the site of
each insertion, designed in PRIMER3 (Untergrasser et al. 2012) (primer sequences, PCR
annealing temperature and expected amplicon sizes without inserted TE in supplementary
Table S2).
Transposable Elements DGRP
Line
1360 blood gypsy5 I-element
TIR LTR LTR non-LTR RAL-21 27|128|0,21 8|8|1 1|9|0,11 10|17|0,59 RAL-237 0|7|0 0|0|x 0|0|x 0|1|0 RAL-321 27|168|0,16 5|5|1 0|8|0 11|21|0,52 RAL-790 15|124|0,12 9|9|1 12|20|0,6 8|17|0,47 Transposable Elements DGRP Line mdg1 pogo roo LTR TIR LTR RAL-21 7|12|0,58 88|91|0,97 69|78|0,88 RAL-237 0|1|0 0|0|- 1|4|0,25 RAL-321 8|11|0,73 13|19|0,68 87|96|0,91 RAL-790 5|8|0,63 15|21|0,71 58|68|0,85
For the other eight DGRP lines, we performed longPCR (Sigma-Aldrich - Amplification of 5-25 kb DNA with the Expand Long Range dNTPack protocol and cycle program) (total volume of 10μL, 0.2μL of gDNA, 1μL of each primer 5μM) to amplify the 52 TE insertion sequences, and checked amplicon size by gel electrophoresis (primer sequences were the same as used for the control line PCR and can be found in supplementary Table S2).
The identity of inserted TEs was tested by sequencing the products resulting from longPCR, using TermoFisher - BigDye Terminator protocol and following manufacturer’s instructions. Sequencing was performed using the forward primers (same primers as used for longPCR). The 52 sequences obtained were then compared with the Drosophila melanogaster transposon sequences on FlyBase.org database (Altschul et al. 1997) – canonical set (NT) database of the BLAST program (blastn 2.2.18, 2008). We defined TE identity for each position based on the best hit, regardless of e-score. For TEs identified which did not match DGRP in
silico predictions or with a BLAST score lower than 200, we sequenced the other end of the
corresponding amplicons using the reverse primers used in longPCR. The sequences obtained were processed in the same way as those obtained with the forward primers.
Ovary dissection, RNA extraction, and cDNA synthesis for Tasks 2
and 3
We dissected ovaries from seven day-old females (eight pairs of ovaries per replicate, eight replicates per line per treatment) in cold PBS 1x. Tissues were disrupted in 400μL of Trizol with pestles and samples were stored at -80°C until RNA extraction.
We used Zymo Research - Direct-zol RNA Miniprep kit for RNA extractions, following the manufacturer’s instructions. We eluted total RNA in 25μL of RNase-free water (Sigma). RNA purity and concentration of each sample was measured with Nanodrop and typically ranged from 200 to 800 ng/µL.
All RNA samples of the same line (with and without Wolbachia) were processed on the same day, first for removal of gDNA contamination and then for cDNA synthesis. We took 1µg of each RNA sample (dilution in RNase-free water) and removed contaminating genomic DNA using DNAse (Promega) treatment, following manufacturer’s protocol (total volume of 10µL), and confirmed that all gDNA had been removed by electrophoresis.
For cDNA synthesis, we followed the Reverse Transcription System (Promega) protocol (10μL of not denatured RNA, for a total volume of 25μL reaction), using Oligo dT primers (0.5µM, 1μL) and incubating the reaction at 42°C for 60min. Samples were then heated at 95°C for 5min and then incubated on ice for 5min to inactivate the Reverse Transcriptase. cDNA was diluted in RNAse-free water (1:10) and stored at -20°C until quantitative real-time PCR (qPCR).
Quantitative real-time PCR (qPCR) for Tasks 2 and 3
We measured TE expression by qPCR (BioRad CFX384 thermal cycler) using 5µL SyBR green mix (BioRad), 0.4µM primers, 4µL of diluted cDNA (1:10) and the following program: 50°C for 2min; 95°C for 10min; 40 cycles of 95°C for 30s, 60°C for 1min and 72°C for 30s. Primers for target TEs plus RpL32 (control gene) were designed not spanning an intron (1360, Cr1a, gypsy5, hobo, INE-1, jockey and pogo were designed in PRIMER3, blood was obtained from Handler et al. 2011, I-element and roo from Specchia et al. 2010, mdg1 from Navarro et al. 2009 and RpL32 from Ponton et al. 2010) (see primer sequences and amplicon sizes in supplementary Table S4). qPCR melting curves were analyzed to confirm specificity of amplified products.
We used standard curves to calculate the concentration (in nanograms) of amplicon DNA from qPCR Ct values for each gene and qPCR plate. For that, we first obtained a known concentration of each amplicon (for each TE and control gene) by amplifying it from gDNA of OregonR (commonly used “wild-type” D. melanogaster line) and the same primers used for the qPCR. PCR amplicons were cleaned using a PCR clean-up kit (Macherey-Nagel - NucleoSpin Gel and PCR Clean-up), following the manufacturer’s instructions. DNA was eluted in 15µL of Buffer NE and post-cleanup DNA concentration was measured in Nanodrop. We prepared eight 1:5 serial dilutions of each amplicon, diluting samples in RNAse free water, and used 4μl for qPCR reactions. We included a range of dilutions that included the range of Ct values for the actual qPCR on cDNA template, down until we reached a plateau in Ct values corresponding to decreasing template concentrations. The point at which the plateau is reached gives us information about the minimum concentration and maximum Ct value that can be detected. For all target TEs and control gene, we obtained Ct values lower than the detection threshold. Standard curves were used to obtain absolute values of expression and those values were normalized to the “housekeeping” gene RpL32, which is commonly used as reference (Parnell et al. 2006, Kemp C et al. 2007, Becker T et al. 2010, Haghaveghi A et al. 2010, Wu M et al. 2010), to ensure that we were using comparable levels of expression between lines. Standard curves allowed us to control for plate effects.
For each TE, we ran eight biological replicates of all experimental conditions that we wanted to compare (temperature and Wolbachia state) in the same plate. For each cDNA sample, we also included two technical replicates in two separate reactions ran on the same plate. In every plate, we also ran the control gene RpL32, four negative controls for each TE and control gene (RNAse free water replacing cDNA) and the standard serial dilutions for the TEs tested and control gene.
qPCR Data analysis
For each qPCR plate, we obtained Ct values using default threshold settings (BioRad CFX Manager). Biological replicates were only considered for the analysis if the standard deviation obtained for Cts of the two technical replicates was inferior to 0.5 (as advised in Real-Time PCR – Advanced Methods Series, edited by M. Tevfik Dorak, Oxford: Taylor & Francis, 2006).
We calculated the average Ct of the technical replicates for each biological and transformed those values into absolute expression (ng DNA / µl) using a linear equation obtained for each standard curve, as described in the qPCR BioRad protocol. We then normalized TE expression to RpL32 by dividing TE expression for RpL32 expression.
The statistical analysis of the data was performed in R Studio, version 3.2.2 (rstudio.com). We checked for normal distribution of our data using a Shapiro-Wilk test, and, as it was not normally distributed (alpha=0.05), we chose a general linear model (glm) with quasi-poisson distribution. For Task 2 we used the model glm(TE expression/RPL32 expression ∼ genotype, family=quasipoisson). For Task 3 we started with the most complex model glm(TE expression/RPL32 expression ∼ temp*wolb, family=quasipoisson), that considers the effect of temperature, Wolbachia and the interaction of the two, and compared with the simplified model glm(TEexp/RPL32exp ∼ temp+wolb, family=quasipoisson), that does not contemplate the interaction of the factors, using anova. If these two models were not statistically different (p=0.05), we proceeded with the most simplified model, otherwise we used the most complex, to make pairwise comparisons using a least-squares means (lsm) with a Tukey’s range test (alpha=0.05).
Results
Most in silico predictions for TE position and identity in tested
DGRP lines were confirmed
In silico predictions for TE insertions in DGRP lines (Mackay et al. 2012) have never been
confirmed experimentally. In Task 1, we aimed at validating those predictions so that we could use the data in our experiments.
We sequenced 40 positions in the genome of eight DGRP lines (Table 1). Some of the predicted insertion positions were present in more than one of the selected DGRP genotypes so, in total, we aimed at validating predictions for 52 novel insertions of a total of ten different TEs (Table 1).
We used as negative control the line RAL-026, predicted to not contain any of our target insertions. The PCR amplicons for the control line of the genomic locations of our 40 target insertion positions were all smaller than 400bp. This is shorter that the predicted inserted TEs (all larger than 400bp) and confirmed that there were no TE insertions in those positions in RAL-026 (see supplementary Table S1).
For the eight DGRP lines in study, we amplified the 52 insertions by longPCR and observed that all amplicon sizes were consistent with there being an insertion at the predicted locations. This corresponds to 100% validation of predicted insertion locations. Related to the size of the 52 amplicons, we found 16 amplicons (31%) that had the size corresponding to the length of the predicted full TE (cf. transposon sequence set on flybase.org), 13 amplicons (25%) that were longer than the predicted TE (suggesting possible insertion of more than one TE) and 23 insertions (44%) that were longer than the corresponding amplicon from the control line, but smaller than the sequence of the predicted TE (suggesting insertion of incomplete TEs) (see Table 4 and supplementary Table S1).
From sequencing the longPCR amplicons from one or both ends, we could determine if the TE amplified had the identity predicted by the in silico analysis of the DGRP genomic data. By blasting the insertion sequences to TE databases, we established that out of 52 amplicons, 48 (92%) had a TE of the correct predicted identity while the remaining four had other TEs inserted. In this situation were a predicted F-element, in one position of a line, which our analysis established that was, in fact, a pogo element, and a Doc element, predicted for one other position in three of the lines, that was a Stalker element (see Table 4 and supplementary Table S1). Therefore, out of the 40 positions in study, we found a total two mismatched TE identities.
Table 4: DGRP in silico predictions confirmation for a total of 52 insertions of ten TEs. TE Number of
insertions tested
Amplicon Size ID
confirmation
Inferior Correct Superior
copia 4 - 1 3 4 opus 2 2 - - 2 Transpac 5 - 1 4 5 I-element 5 4 1 - 5 Juan 5 2 1 2 5 F-element 3 - 3 - 2 Doc 8 2 4 2 5 hopper 5 - 4 1 5 pogo 8 8 - - 8 hobo 7 5 1 1 7 TOTAL 52 23 16 13 48
Looking at the size, the amplicons corresponding to predicted insertions of opus and pogo were always smaller than predicted if those elements were complete. Only for F-element insertions did amplicons always have the correct size for that TE, even though one predicted insertion of this element did not correspond to the predicted TE identity (Table 4). Although in
silico predictions of TE insertions in the DGRPs might be over-estimating insertions of complete
TEs (only 31% with correct size for predicted TEs), we did confirm 100% of predicted insertion sites and 92% of corresponding predicted TE identities. Based on these validations, we were confident about using the in silico predictions of TE insertions to select which DGRP lines to study genotype effect on TE expression, testing for an association between TE copy number and levels of TE transcript in adult ovaries.
Genotype affects TE expression, albeit not equally for all TEs
TE expression should not be used as a proxy for TE activity without taking into account TE copy number in the genome. We set to test the correlation between TE copy number and TE expression levels using some selected DGRP lines. We selected lines with different numbers of copies of particular target TEs, paying special attention to the number of “novel insertions” (not shared between DGRP lines and the Drosophila reference genome, and typically also not shared between many DGRPs; Mackay et al. 2012), because of the expectation that “novel” insertions are more likely to correspond to active TEs than those for which insertions are “shared” (with the reference genome and typically also between DGRPs; see Introduction). We expected that genotypes with more novel insertions would also have higher expression levels of the corresponding TEs.
We chose nine DGRP lines (RAL-021, RAL-237, RAL-321, RAL-357, RAL-358, RAL-375, RAL-391, RAL-790 and RAL-908) and 11 TEs (seven copy-and-paste—blood, Cr1a, gypsy5, I-element, jockey, mdg1, and roo, and four cut-and-paste elements—1360, hobo, INE-1, and pogo). We expected Cr1a, an element with many shared but almost no novel insertions, to be an inactive TE and to have low expression. Conversely, we expected TEs with more novel than shared insertions (e.g. blood, gypsy5, hobo, I-element, INE-1, jockey, mdg1, pogo and roo) to be active and expressed at higher levels (Table 2).
We did not test all TEs in all DGRP lines, only Cr1a, gypsy5, and roo were tested in all selected DGRPs. For the remaining TEs, we generally quantified expression in four lines, two with high and two with low numbers of novel insertions for those TEs (Table 2). We focused on TE expression in ovaries because this is a tissue where increased TE activity is expected to impact heritable variation in copy-paste TE number and lead to increase in copy-paste TE copy number between generations.
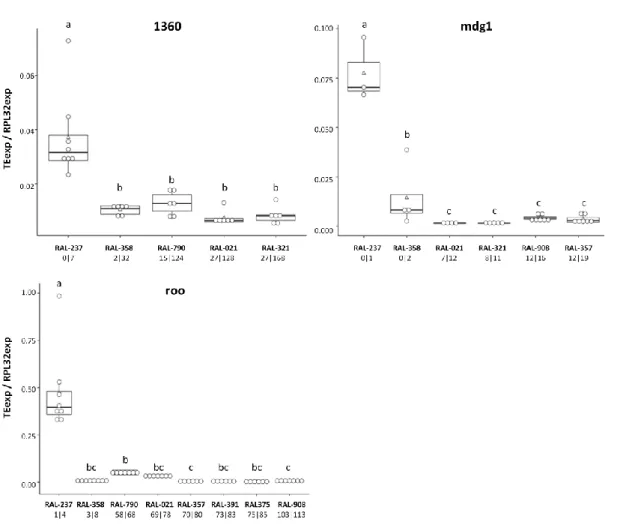
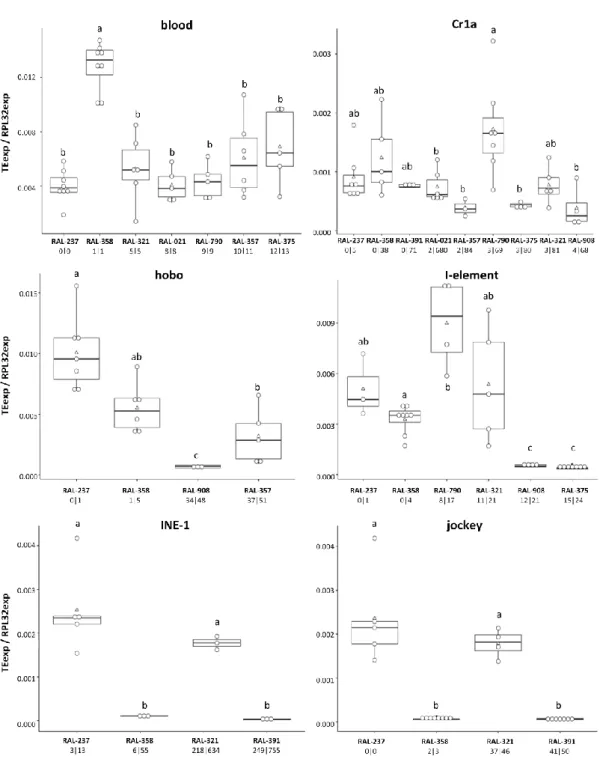
In general, we observed no association between the number of novel or total insertions and the expression levels for the corresponding TEs in adult ovaries. The only TEs for which we saw higher levels of expression in genotypes with more novel insertions were pogo and gypsy5 (Figure 1). For the other TEs, we either saw decreased expression with increasing copy number (mdg1, roo, 1360) (Figure 2) or no directional trend in the association between copy number and expression (Cr1a, blood, I-element, jockey, INE-1, and hobo) (Figure 3). As complement, see supplementary Figure S1. As expected, Cr1a, with few novel insertions was expressed at low levels relative to most elements tested. However, so did INE-1, for which we had many novel insertions, and Jockey, with a number of novel insertions comparable to 1360, hobo, and pogo (Figures 1-3). We observed high gypsy5 expression in line RAL-790, comparing with other genotypes and TEs (Figure 1). RAL-790 had an unusually high number of gypsy5 insertions (20 total, 60% novel) while most other DGRPs had either close to no insertions of this element or few insertions, that tended to be shared with the reference genome and between DGRP lines. Relative to the different DGRP lines, we did not find any genotype particularly permissive to general TE activity (judged as high levels of expression). The same genotype could have high expression of some TEs but not for others. RAL-237 and RAL-358 were the lines with the lowest number of novel insertions for the TEs in study and, therefore, we expected TE expression to be lower in them, but that was not the case – TE expression was not especially low in these lines when comparing with the others. In fact, RAL-237 was the line that showed the highest expression levels for 1360, hobo, INE-1, jockey, mdg1, and roo (Figures 2 and 3).
Figure 1: Positive correlation between gypsy5 and pogo expression (normalized to RpL32), in ovaries of
DGRP lines, and respective different predicted copy numbers. The DGRPs (RAL lines) in the X-axes are ordered by number of novel insertions. The numbers underneath each DGRP name correspond to the predicted number of novel and total insertions for the corresponding TE. Each white circle corresponds to one biological replicate, white triangles represent the mean and the black line the median. Boxplots
Figure 2: Negative correlation between 1360, mdg1 and roo expression (normalized to RpL32), in ovaries
of DGRP lines, and respective different predicted copy numbers. The DGRPs (RAL lines) in the X-axes are ordered by number of novel insertions. The numbers underneath each DGRP name correspond to the predicted number of novel and total insertions for the corresponding TE. Each white circle corresponds to one biological replicate, white triangles represent the mean and the black line the median. Boxplots include 25-75% percentile and whiskers represent 95% confidence interval. Model: glm(TEexp/RPL32exp ∼ genotype, family=quasipoisson). Results of pairwise comparisons between genotypes for each TE (least-squares means analysis, alpha=0.05) are represented with letters: same letter indicates no statistically significant difference and different letters indicates statistically significant difference.
Figure 3: No directional trend observed between blood, Cr1a, hobo, I-element, INE-1 and jockey
expression (normalized to RpL32), in ovaries of DGRP lines, and respective different predicted copy numbers. The DGRPs (RAL lines) in the X-axes are ordered by number of novel insertions. The numbers underneath each DGRP name correspond to the predicted number of novel and total insertions for the corresponding TE. Each white circle corresponds to one biological replicate, white triangles represent the mean and the black line the median. Boxplots include 25-75% percentile and whiskers represent 95% confidence interval. Model: glm(TEexp/RPL32exp ∼ genotype, family=quasipoisson). Results of pairwise comparisons between genotypes for each TE (least-squares means analysis, alpha=0.05) are
Temperature, Wolbachia and the interaction of the two factors have
effects on TE expression, depending on the TE and genotype
TE activity can cause mutations that add to the genetic variation of the population. To test whether environmental perturbation of adults affected TE activity in a way that could impact the extent of genetic variation in their progeny we focused on TE expression in ovaries. We chose to study temperature, an external abiotic external factor, and Wolbachia infection, an internal biotic internal factor.
We tested the expression of seven TEs – 1360, blood, gypsy5, I-element, mdg1, pogo and roo in females of four different genetic backgrounds – DGRP lines RAL-21, RAL-237, RAL-321, and RAL-790. We compared TE expression under three different temperature treatments – 21°C, 25°C and 29°C – in lines with and without Wolbachia (Table 3).
Although our experimental design aimed at characterizing expression of seven TEs in four different genetic backgrounds (28 combinations TE x genotype), several TEs had ovary expression levels undetectable by qPCR. We limited our comparisons to the TEs and lines that showed detectable expression in at least three biological replicates (17 out of 28). Only 1360 and roo had detectable expression levels in all genetic backgrounds. Blood and mdg1 had detectable expression in three genotypes, pogo in two and gypsy5 showed expression in only one DGRP line (RAL-790) (see Figures 4 – 6). I-element did not have enough biological replicates with detectable levels of expression for all conditions in any line, so we could not study this element.
We observed that temperature, Wolbachia and the interaction between the two factors had an effect in TE expression, that depended on the TE and genetic background. We discerned temperature effect by looking at differences in TE expression under the three temperatures, 21°C, 25°C and 29°C, within each line with and without Wolbachia. In addition, we determined
Wolbachia effect by looking at TE expression in lines with and without Wolbachia, under one
particular temperature at a time. Out of the 17 TE x genotype combinations we saw effect of temperature in 10 (59%), Wolbachia in 8 (47%) and interaction of the two factor in 3 combinations (18%). Figures 4 – 6 show the temperature effects on the expression relative to control gene for the various TEs, in genetic backgrounds with and without Wolbachia.
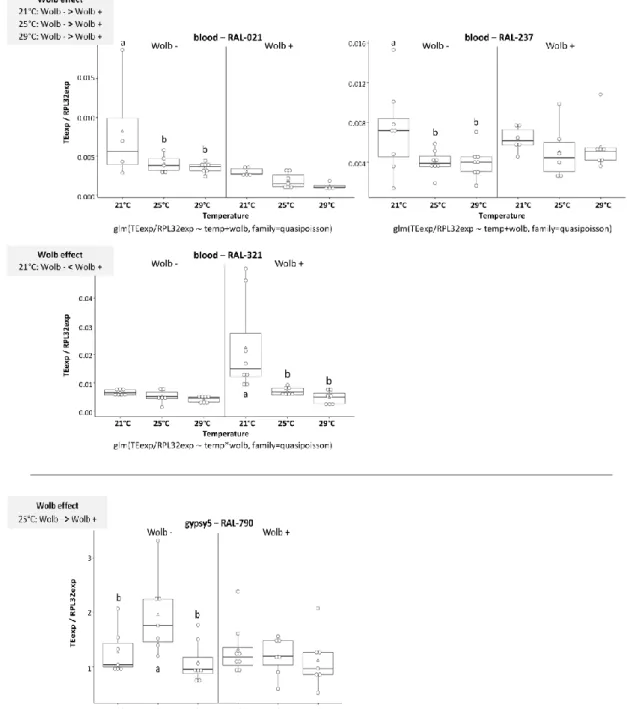
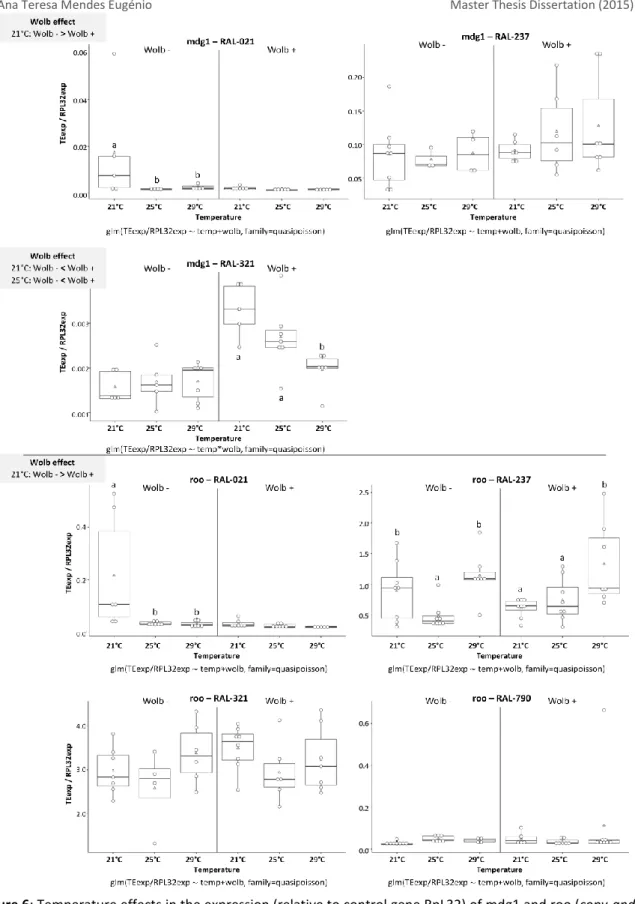
Overall, looking at temperature effects, we saw more cases in which TE expression levels under 21°C were different from the other temperatures, usually in lines were Wolbachia was absent (see Figures 4, 5 and 6). Studying Wolbachia effects, we saw again that TE expression levels usually varied at 21°C and, whenever we saw differences, the expression levels were usually higher in the absence of Wolbachia, with two exceptions (blood and mdg1, both in RAL-321, with higher expression levels with Wolbachia). We only saw statistically significant effect of interaction of the factors for blood in RAL-321 value=0.043), mdg1 in RAL-321
(p-value=0.021) and pogo in RAL-237 (p-value=0.005). The DGRP line in which we saw most
variation in TE expression under both environmental factors was RAL-21.
Figure 4: Temperature effects in the expression (relative to control gene RpL32) of 1360 and pogo (cut-and-paste TEs) in ovaries of adults of different DGRP lines, with or without Wolbachia. The X-axes
correspond to the treatments in study – three temperatures (21°C, 25°C and 29°C), with and without
Wolbachia(Wolb). In the Y-axes, the expression levels are shown separately for the different genotypes
(one genotype per panel). Each white dot is a biological replicate, the white triangle represents the mean and the black line the medium of the values. Boxplots include 25-75% percentile and whiskers represent 95% confidence interval. The glm model used is under the X-axes, for each panel. Results of pairwise comparisons between genotypes for each TE (least-squares means analysis, alpha=0.05) are represented with letters: same letter indicates no statistically significant difference and different
+
Figure 5: Temperature effects in the expression (relative to control gene RpL32) of blood and gypsy5
(copy-and-paste TEs) in ovaries of adults of different DGRP lines, with or without Wolbachia. The X-axes correspond to the treatments in study – three temperatures (21°C, 25°C and 29°C), with and without
Wolbachia(Wolb). In the Y-axes, the expression levels are shown separately for the different genotypes
(one genotype per panel). Each white dot is a biological replicate, the white triangle represents the mean and the black line the medium of the values. Boxplots include 25-75% percentile and whiskers represent 95% confidence interval. The glm model used is under the X-axes, for each panel. Results of pairwise comparisons between genotypes for each TE (least-squares means analysis, alpha=0.05) are represented with letters: same letter indicates no statistically significant difference and different letters indicates statistically significant difference. “Wolb effect” grey box shows Wolbachia effects in TE expression (least-squares means analysis, alpha=0.05). “<” and “>” indicate in which Wolbachia status (“Wolb -”:absent, “Wolb +”:present) the levels of TE expression were respectively lower or higher, within temperatures in which we found statistically significant difference.
b b
+
Figure 6: Temperature effects in the expression (relative to control gene RpL32) of mdg1 and roo (copy-and-paste TEs) in ovaries of adults of different DGRP lines, with or without Wolbachia. The X-axes correspond to
the treatments in study – three temperatures (21°C, 25°C and 29°C), with and without Wolbachia (Wolb). In the Y-axes, the expression levels are shown separately for the different genotypes (one genotype per panel). Each white dot is a biological replicate, the white triangle represents the mean and the black line the medium of the values. Boxplots include 25-75% percentile and whiskers represent 95% confidence interval. The glm model used is under the X-axes, for each panel. Results of pairwise comparisons between genotypes for each TE (least-squares means analysis, alpha=0.05) are represented with letters: same letter indicates no statistically significant difference and different letters indicates statistically significant
+
+
Discussion
TEs are phylogenetically widespread, being represented in essentially all genomes sequenced to date. They are an important source of genetic novelty and their contribution to evolutionarily relevant genetic variation has recently started to accumulate experimental evidence. TEs have been implicated in adaptation in natural (González et al. 2008) and laboratory (Sousa et al. 2013) populations and in the origin of novel traits (Wagner et al. 2005, Santos et al. 2014, Pray 2008). The molecular mechanisms responsible for TE silencing are topics of very active research and much progress has been made to characterize them on selected model systems like Drosophila melanogaster. Nonetheless, our understanding of the factors and mechanisms that can make TEs jump in natural populations is still poorly explored. In this work, we set out to test the effects of genotype and environment on TE expression. We focused specifically on female ovaries because it is in the germline that TE activity can impact genetic variation in the progeny, which can be the raw material for evolution by natural selection.
We used different genetic backgrounds of Drosophila melanogaster genotypes from a panel of wild-derived, isogenic and fully sequenced lines, the DGRPs (Mackay et al. 2012). Sequence information available for these lines includes in silico predictions of TE insertion sites in the host genome and respective TE identities. The lines differ in how many insertions of different TEs they carry. These insertions have been characterized as “shared” or “novel”, depending on whether they were or not also found in the reference genomic sequence of Drosophila
melanogaster. Novel insertions tend to also not be common between different DGRPs and we
argued that TEs producing them are likely more recent and/or of active. We used this information to guide our choice of DGRP lines, TEs and TE insertion sites to study. We defined two main aims for this work and planned three tasks to meet those aims.
Aim 1: Test the effect of genotype in TE expression
Our Aim 1 was to test the effect of genotype, specifically, the number of copies of a particular TE, on TE expression. To pursue this, we first set out to validate some of the in silico predictions of TE insertion sites and identity (Task 1). These had never been experimentally validated before. We validated 100% of the 52 insertion sites we tested and for 92% thereof we also confirmed the identity of the predicted TE, albeit sometimes not in a single copy and often not of the full-size TE (Table 4 and supplementary Table S1). We note that we only tested a very small proportion of all insertions (52 of approximately 50 thousand novel insertions, in about 200 thousand total insertions). It is unclear to what extent our estimated high rates of validation of both position and identity would hold for a more comprehensive sample of insertions, including other TEs and host genotypes.
With more confidence on the in silico predictions, we used the DGRP information to guide our selection of lines with more and fewer novel insertions of specific target TEs, with which we set to test whether the number of copies of a TE in a genome could predict its levels of expression (Task 2).
We found differences between genotypes in levels of TE expression in ovaries, albeit not the same for all TEs (Figures 1-3). However, the differences between genetic backgrounds could not be explained by number of insertions (novel or total).
Consequently, we could not confirm our hypothesis that TE expression levels are dependent on number of novel insertions of that TE. It can be that TE activity is not directly proportional to the number of novel insertions, that TE expression is not a good proxy for TE activity, or a combination of both. Importantly, our design suffered from an important limitation, in that the distinct genotypes we studied differ not only in copy number of the target TEs but also in other aspects that might be confounding any potential signal copy number might have on TE expression. We also note that for some TEs (specifically, blood, jockey and pogo) we observed detectable levels of expression in a line (RAL-237) not predicted to have any insertion for these elements (see Table 2 and Figures 1 and 3). This means that the in silico annotation probably failed to detect some of their insertions. Less likely seems to be the possibility of an invasion of those elements since the time the lines were sequenced, as the different lines are supposedly kept isolated from other genotypes.
We noted that the gypsy5 TE had unusually high copy number and also unusually high expression in one particular genotype (RAL-790), suggestive of a recent burst and/or very active TE. It is unclear whether this apparent increased activity of gypsy5 in RAL-790 is due to an effect of the genetic background (being especially permissive to jumping of gypsy elements) and/or of the gypsy5 in RAL-790. The effect of the genetic background could be verified by checking the expression of other elements of the gypsy family (assuming that all elements of the gypsy family behave in a similar manner, which is an assumption that would need to be validated), as well as by checking the flamenco piRNA cluster, responsible for silencing gypsy5 (Sarot et al. 2010), in RAL-790. An effect of specific properties of the gypsy5 found in RAL-790 could be checked by sequencing all gypsy5 insertions from this line and searching for mutations that might be associated with change in its activity.
Aim 2: Test the effect of environmental perturbation and genotype
on TE expression levels
Our Aim 2 was to test the effect of different types of environmental perturbation on TE expression levels. We chose to study the effect on an external abiotic environmental factor (temperature) and one internal biotic factor (Wolbachia infection) on TE expression, in different genetic backgrounds. Our choice of environmental factors to test was based on their prevalence in natural populations, as well as on previous studies suggesting their effect on TE activity. Temperature variation had been previously implicated in TE activity in some, but not all previous studies (Capi et al. 2000). Wolbachia, a very common endosymbiont in natural populations of insects, had been previously shown to confer D. melanogaster hosts resistance against infection by virus (Teixeira et al. 2008), which have many properties in common with TEs. We found that temperature, Wolbachia and their interaction affect TE expression in a
The mechanisms underlying the effect of external temperature and of Wolbachia infection on TE expression in D. melanogaster ovaries have not been explored. Temperature may affect TEs that are under the control of temperature-sensitive enhancers or temperature-responsive transcription factors.To check for this, we could search for temperature-responsive elements in the TE sequences for which we found temperature effects on expression. It is also conceivable that temperature effects on TE activity are mediated by the TE-repressing piRNA pathway. Its key protein Piwi is only phosphorylated and active if associated to Hsp90, a heat-shock protein (Sato et al. 2010, Specchia et al. 2010, Gangaraju et al. 2011). If Hsp90 were ever limiting, its recruitment to chaperone functions involved in the response to temperature stress could limit phosphorylation, and thus activity, of Piwi. To test this hypothesis, we could, for genotypes where TE expression was affected by temperature, investigate temperature effects on Piwi phosphorylation (with a Western-like gel detecting phosphorylated and unphosphorylated Piwi), and/or temperature effects on piRNA levels (by sequencing piRNAs). For the mechanism whereby Wolbachia might affect TE expression, we know even less. In D.
melanogaster, Wolbachia provides protection against virus (Teixeira et al. 2008). We were
expecting our results to be consistent with this effect direction (lower TE expression with
Wolbachia) and that is indeed what we saw. Still, for two TEs in RAL-321 we observed lower
expression in the absence of Wolbachia and most effects were only seen at a temperature of 21°C. The fact is that the mechanism by which this symbiont confers protection to D.
melanogaster against virus is still unknown, and, therefore, we do not know how, whatever
that mechanism is, can be also affecting TEs. To check whether Wolbachia is interfering with the piRNA pathway, a follow-up study could sequence piRNAs in ovaries from a line naturally infected with Wolbachia and the same line after Wolbachia removal.
Hindsight and perspectives
Aside for the experimental design limitations we identified and discussed above, we can see a number of ways by which our dataset could be improved and better able to solve the biological questions we set forth and/or understand the mechanisms of the phenomena we describe. These are highlighted below.
As the control gene in our qPCR analysis, to assess TE expression levels in ovaries, we used RpL32. This gene is very commonly used as reference gene in measurements of TE expression in Drosophila melanogaster (Parnell et al. 2006, Kemp et al. 2013, Haghayeghi et al. 2010). Because finding a control genes suitable for all treatments (three temperatures x two
Wolbachia status) and genotypes is difficult, we suggest that further studies should include
other type of controls. These could be other house-keeping genes that presumably have rather invariable expression levels (e.g. TBP, Lam et al. 2012), Hsp70 to account for response environmental perturbations like temperature (Hoekstra et al., 2013, Štětina et al. 2015) and ovary-specific genes, such as Vasa (Pek et al. 2011), to account for potential environmentally-induced changes in ovary development. It would also be interesting to add a Wolbachia-specific gene (e.g. surface protein Wsp) to estimate potential temperature, genotype and individual differences in Wolbachia load (Poisont et al. 1998, Osborne et al. 2012).