M
ASTER OF
S
CIENCE IN
FINANCE
M
ASTERS
F
INAL
W
ORK
PROJECT
EQUITY RESEARCH
:
NH
H
OTEL
G
ROUP
S.A.
R
HODA
T
ICHATSCHEK
M
ASTER OF
S
CIENCE IN
FINANCE
M
ASTERS
F
INAL
W
ORK
PROJECT
EQUITY RESEARCH
:
NH
H
OTEL GROUP
S.A.
R
HODA
T
ICHATSCHEK
S
UPERVISOR
:
VICTOR
MAURÍLIO
SILVA
BARROS
Abstract
The following report was written in accordance with the recommendations of the CFA
Institute. In this project, a detailed evaluation of NH Hotel Group S.A. was performed.
Materials on this report only the public information about the company issued until the
30
thof September of 2017.
NH Hotel Group is an international hotel operator and one of the leading urban hotel
companies worldwide in terms of number of rooms.
The careful analysis of the company’s management, financials, risks and competitors
together with the forecast analysis based on reasonable assumptions, facilitated a
suitable valuation on the company’s target price.
The target price was obtained using two different methods, an absolute valuation
method, where the Discounted Cash Flow (DCF) was used and a relative valuation
method, where the method of Comparable Multiples was used.
Having reached a price target of € 5.69/sh at 2017YE, with an upside potential of 0,35%
from the current stock price of € 5.67/sh on the 29
thSeptember 2017 our
recommendation for NH Hotel S.A. is to hold. The hold recommendation is supported
by complementary valuation methods and stress test.
JEL classification: G10; G32; G34.
Keywords: Equity Research; Valuation; Mergers & Acquisitions; NH Hotel Group S.A.,
Hotel Industry.
Resumo
O seguinte relatório foi redigido de acordo com as recomendações do Instituto CFA.
Neste projeto, foi realizada uma avaliação detalhada do NH Hotel Group S.A. Os
materiais neste relatório apenas refletem a informação pública sobre a empresa
emitida até 30 de setembro de 2017.
NH Hotel Group é um operador hoteleiro internacional e uma das principais empresas
hoteleiras urbanas em todo o mundo em termos de número de quartos.
A análise cuidadosa da gestão, financeira, riscos e concorrentes da empresa,
juntamente com a análise de previsão baseada em premissas razoáveis, facilitou uma
avaliação adequada do preço-alvo da empresa.
Tendo atingido um preço-alvo de
€ 5.69/sh no final de 2017, com uma vantagem
potencial de 0,35% do atual preço das ações de € 5.67/sh em 29 de Setembro de
2017, nossa recomendação para NH Hotel S.A. é segurar. Nossa recomendação de
segurar é suportada pelos métodos de avaliação complementares e teste de estresse.
Classificação JEL: G10; G32; G34.
Palavras-Chave: Equity Research; Avaliação de Empresas; Fusões e Aquisições; NH
Hotel Group S.A., Indústria hoteleira.
Acknowledgements
I want to dedicate this project to my father, mother, sister, brother, husband and son.
A special thanks to my supervisor Victor for all the guidance and support.
Index
Abstract
i
Resumo
ii
Acknowledgements
iii
Index
iv
List of Figures
v
List of Tables
vi
1.
Research Snapshot
1
2.
Business Description
2
3.
Management and Corporate Governance
6
4.
Industry Overview and Competitive Positioning
8
5.
Investment Summary
12
6.
Valuation
13
7.
Financial Analysis
16
8.
Investment Risks
17
Appendices
20
Appendix 1: Statement of Financial Position
20
Appendix 2: Income Statement
21
Appendix 3: Cash Flow Statement
22
Appendix 4: Key Financial Ratios
23
Appendix 5: Common-Size Statement of Financial Position
24
Appendix 6: Forecasting Assumptions
25
Appendix 7: Business Structure
30
Appendix 8: Discounted Cash Flow Assumptions
31
Appendix 9: Discounted Cash Flow Analysis
32
Appendix 10: Risk Matrix
34
Appendix 11: Peer Selection
35
Appendix 12: Risks to Price Target
37
Appendix 13: Return on Equity
39
Appendix 14: Abbreviations
40
List of Figures
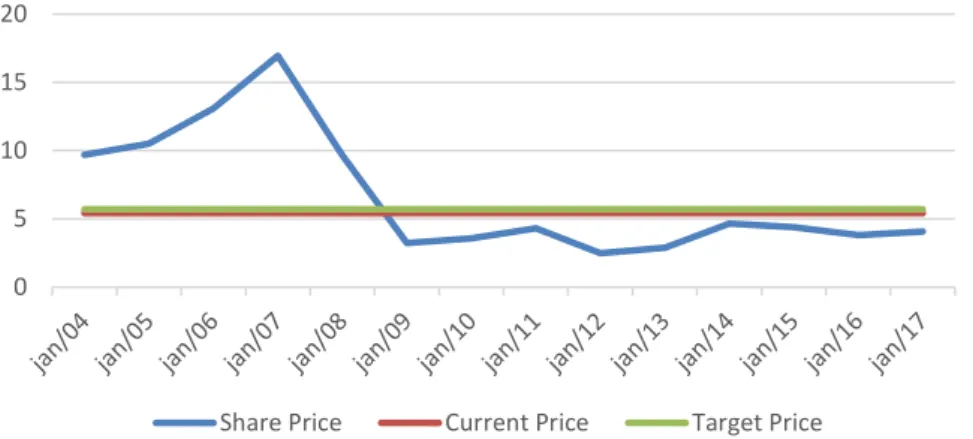
Figure 1: Historical Share Price Source: Reuters
1
Figure 2: Operating breakdown by geography
2
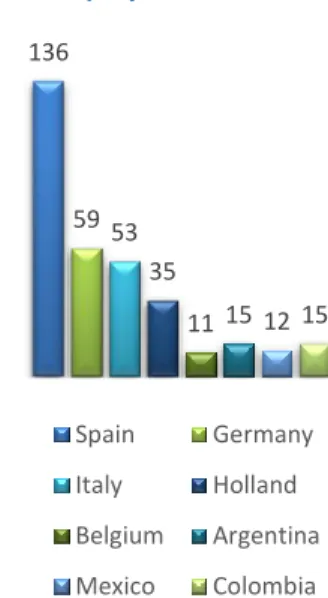
Figure 3: Number of Hotels by main markets
2
Figure 4: Percentage of rooms in the Upper Upscale
2
Figure 5: Staff cost evolution
3
Figure 6: GDP Evolution
3
Figure 7: Repositioning Plan Status Sept. 2016 (number of hotels)
4
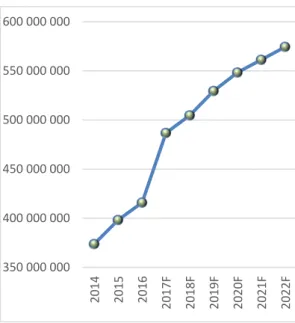
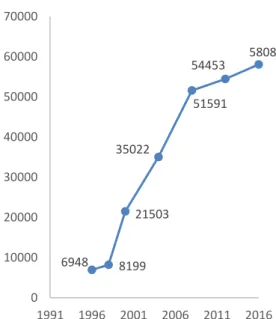
Figure 8: Number of rooms evolution
4
Figure 9: Shareholder structure
5
Figure 10: Revenues per B.U.
7
Figure 11: International tourist’s arrivals Spain
8
Figure 12: International tourist’s arrivals Europe
8
Figure 13: International tourist’s arrivals World
9
Figure 14: Operating breakdown by contracts
9
Figure 15: RevPar Evolution
10
Figure 16: Porter´s 5 Forces
11
Figure 17: FCFF Evolution
12
Figure 18: Revenues evolution
13
Figure 19: CAPEX Evolution
14
Figure 20: Net Profit Evolution
16
Figure 21: EBIT Evolution
16
Figure 22: ROE Evolution
16
Figure 23: Risk Matrix
17
List of Tables
Table 1: Analyst’s Risk Assessment
1
Table 2: NH sensitivity analysis Source: Author
1
Table 3: Board of Directors Remuneration
6
Table 4: Ownership structure
6
Table 5: Company management structure
6
Table 6: Occupancy
9
Table 7: ADR
10
Table 8: RevPar
10
Table 9: Revenues by B.U.
13
Table 10: WACC
14
Table 11: DCF Valuation
15
NH: Building up the Future
(YE2017 Price Target of € 5.69 (+0,3%); recommendation is to Hold)
Hold is our recommendation for NH Hotel S.A. with a price target of € 5.69/sh at the end of 2017, using the discounted cash flow method which compares with the current € 5.67/sh on the 29th September 2017. Relative valuation through multiples supports our view that NH is currently slightly undervalued, but this approach is only considered as complementary although with medium risk.
Figure 1: Historical Share Price Source: Reuters
The leading driver of the group’s performance are the room revenues. Room revenues are primarily influenced by the occupancy rate and ADR (Average daily rate). Both are strongly correlated to general economic conditions, the strength of the travel industry and the supply and demand of hotel accommodation in a specific market. We predict an increase in the occupancy rate due to a global GDP growth projection of 3.40% and a GDP growth in the Eurozone of 1.50% in 20171. Europe’s international tourism arrivals will increase between 2% and 3% in 2017 and the new hotel supply growth is expected to be very low.2
In recent years, the hotel industry has been facing the threat of non-traditional accommodation providers. In this context, NH has gone through a transformation to differentiate itself fully from this segment by improving both the service and the product, betting on the quality versus quantity. Assets that were not adapted to the new requirements came out of the portfolio and most of the hotels are being fully or partially reformed. With the implementation of this repositioning plan, we believe that NH will surpass the industry results in the next years.
Table 2: NH sensitivity analysis Source: Author
Change in Occupancy 5,69 56,24% 62,48% 69,43% 76,37% 84,01% 75,00 0,02 1,21 2,59 4,01 5,63 Change in ADR 83,30 1,21 2,58 4,16 5,80 7,68 92,60 2,59 4,17 5,69 7,91 10,11 101,90 4,02 5,82 7,91 10,12 12,67 112,00 5,62 7,68 10,10 12,65 15,63
1Global Economy Watch- Projections, PWC in
https://www.pwc.com/gx/en/issues/economy/global-economy-0 5 10 15 20
Share Price Current Price Target Price
1.
Research Snapshot
NH Hotel
Group S.A
HOLD
Medium risk
29 September 2017Portugal
Table 1: Analyst’s Risk Assessment
Low Medium High Our risk assessment reflects medium competition in company's domestic and international markets. However, the sector has a high dependence of international growth and general economic conditions.
NH Hotel group (officially NH Hotel Group S.A.) is a Spanish based hotel chain founded in 1978 in Navarra, Spain, by Antonio Catalan Diaz, and is headquartered in Madrid. NH stands for Navarra Hotels, and its first establishment was in Ciudad de Pamplona. Only four years later, it started its national expansion by opening “NH Calderon de Barcelona”. This was followed by many other hotel openings in the decade of the 80´s, leading the company to establish itself as one of Spain’s leading chains, running hotels in Madrid, Barcelona and Zaragoza. By the end of 1995 NH counted with 54 establishments nationwide.
GEOGRAPHIC EXPANSION AND GROWTH
The end of the 90´s decade marked the beginning of the Company’s international expansion, starting by the acquisition of a stake in Jolly Hotels in Germany (19.1%) and followed by the total acquisition of the Dutch hotel chain, Krasnapolsky, a transaction which doubled its size. After this deal NH had 168 hotels, 7.300 employees and a presence in 15 Countries and the company was positioned as the third largest hotel chain in Europe.
In the 2000 decade the group continued to expand not only through its acquisitions like the Mexican hotel chain Chartwell in 2001 and the German chain Astron Hotels in 2002 but also through the entering in additional new markets. By the end of 2007 the group had 341 hotels and 35.000 rooms in 21 countries in Europe, Latin America and Africa. Another important year for NH was 2009, when it merged the hotel management business with the other Spanish hotel chain Hesperia. Thanks to this transaction, NH took over the management of the 51 hotels owned and operated at the time by Hesperia.
In 2015 the group completed the acquisition of the Latin American chain Hoteles Royal, which allowed NH Hotel group to launch its brands in Colombia, Chile and Ecuador. NH is a benchmark operator of city hotels operating by December 2016 close to 378 hotels in 30 markets mainly in Europe. Its biggest presence is in Spain followed by Italy and Benelux.By 2016 NH had 58.085 rooms available, employed 13.850 people and generated a total revenue of € 1,447 million.
SEGMENTS
In 2014, NH Hotel Group carried out a clear segmentation of its hotels with the design of a new brand architecture and an improved value proposition for its customers, based on the needs of consumers and the experience offered by the company. The goal is to have more and more hotels operating in the upper upscale, and upscale categories and less in the midscale category. The new brand structure defines the NH Hotel Group portfolio as follows:
Upper Upscale:
o NH Collection: This is the upper-upscale brand of NH Hotel Group. It has
hotels located in the main cities of Europe and Latin America.
o nhow: The hotel brand for travellers with their own style. nhow is NH´s most
surprising and exclusive brand. Each hotel is a unique creation. New forms of contemporary architecture, design, technology and smart luxury by prestigious architects and interior designers.
Upscale:
o NH Hotels: NH Hotels, four and three-star urban hotels for those travellers
who for business or leisure purposes are looking for an excellent location with the best value for money. Comfortable and functional rooms, with services and amenities adjusted to their needs.
Midscale:
o Hesperia Resorts: This is the vacational brand. Hesperia Resorts, holiday
resorts with a renewed concept of modern accommodation and customized
2.
Business Description
10% 24% 19% 21% 26% America Spain Italy Benelux Central Europe 136 59 53 35 11 15 12 15 Spain Germany Italy Holland Belgium Argentina Mexico Colombia 1% 10% 15% 21% 2013 2014 2015 2016Figure 2: Operating breakdown by geography
Source: Company Data
Figure 4: Percentage of rooms in the Upper Upscale
Figure 3: Number of Hotels by main markets
Source: Company Data Source: Company Data
service that is surprising at every level. Situated in stunning locations, they are the perfect choice for couples and families who need the ideal combination of rest and enjoyment.
By the end of 2016 NH Hotel group had 21% of rooms in the Upper Upscale. The rest of the 79% is divided between the Upscale, Midscale and Hesperia Resorts, but the exact division percentages are not disclosed.
Nh Meetings: NH Hotel Group creates memorable and inspiring events that help its
customers achieve remarkable success. Creative and versatile spaces with state-of-the-art technologies to create high impact events and high-performance meetings. KEY DRIVERS OF PROFITABILITY
The key drivers of Revenues for NH Hotels are: “Hotel Occupancy”, “Catering”, “Meeting rooms and others”, “Rentals and other services”. Approximately 70% of the revenues come from the Hotel Occupancy which grew from € 1,376.634 in 2015 to € 1,447.903 in 2016. The RevPAR ratio is also very important and grew from 53.3 in 2014 to 58.3 in 2015 and finally to 62.0 in 2016. Hotel Occupancy and RevPAR can be affected by many different factors but mainly by GDP per capita or rising of the purchasing power. Stronger growth and employment within the different economies will fuel demand for holidays. Stronger economic performance will also provide a likely boost to international business visits, which is again great news for the industry due to the greater spend per night of business-related stays.
Another essential part and important key driver of profitability are the expenses. The expenses are divided by NH as follows: “Personnel Expenses”, “Lease rentals”, “External services” and “Others”. The costs for a hotel are generally very steady from year to year. In NH’s case in 2016, the groups higher level of activity in the hotel business led to an increase in some operational expenses. Also, the increase recorded in the RevPar explains the increase associated to agency commission expenses. The Personnel expenses grew from € 398,148 in 2015 to € 415,889 in 2016 (Figure 5) and the “Other Operating Expenses” grew from € 787,089 in 2015 to € 795,174 in 2016. COMPANY STRATEGIES
NH Hotel Group's five-year strategic plan (2014-2018) is based on the fundamental pillars of the new NH's value proposition. It is structured in four major levers of value creation and 24 initiatives, each of which has its objectives, action plans, calendar, budget and implementation managers.
2016 was the third year of the execution of the Strategic Plan, an exercise in which the company has undergone a profound transformation thanks to the good evolution of the initiatives of the plan and its positive results.
These initiatives have focused on improving revenues, as well as increasing margins, further expansion and the implementation of what were defined as facilitators of NH hotel group transformation: a new human resources strategy. Sustainability and information systems. The four major levers of the strategic plan are the following: 1. Increase in income (Revenues): The increase in income is to be achieved by two
main strategies.
o Value proposition: Meeting the expectations and needs of its customers is a priority for NH Hotel Group. For this reason, the company bases its work on the operational and service promise defined for each of its brands, focusing on maintaining the highest quality and innovation standards, while always remaining transparent in its actions. The company is committed to guaranteeing excellence in its services, with a view to always exceeding customer expectations.
In 2015, NH Hotel Group also increased the investment in targeted marketing in order to build up brand value and gain recognition from consumers in all countries where the company operates, by designing campaigns that convey the quality, locations, services and experiences offered by its hotels.
350 000 000 400 000 000 450 000 000 500 000 000 550 000 000 600 000 000 2014 2015 2016 2017F 2018F 2019F 2020F 2021F 2022F
Figure 5: Staff cost evolution
1,50% 2,00% 2,50% 3,00% 3,50% 4,00% Spain GDP World GDP EU GDP
Source: Company Data, Author
Source: PwC
o Portfolio optimization: During 2015, NH Hotel Group continued to apply a pricing strategy that makes it possible to improve financial performance by increasing average daily rates per occupied room (ADR), one of the 24 initiatives in the Strategic Plan. On this year, NH Hotel Group began using new and sophisticated tools that make it possible to establish dynamic pricing strategies based on hotel capacity. With these tools, the company is able to forecast the demand of available rooms in real time, making the most of Big Data for an intelligent pricing system.
There has also been in place a repositioning plan that has been successful in its first three years, with the goal of investing € 200M in key hotels to enable portfolio segmentation. By the end of 2015, hotels representing 64% of the EBITDA of the company are already in “perfect shape” (Figure 7). Once the repositioning will be completed, 81% will be in “perfect shape”. This will lead to an optimized portfolio with less brand damaging and unprofitable hotels.
2. Increase in margins: The increase in margins is also divided in two subcategories. o Cost efficiency: The plan is to reduce the intermediation costs by increasing direct
sales online (website and mobile applications). This is to be achieved by reviewing the sales and pricing strategies.
o Debt refinancing: The goal is to improve capital structure and reduce financing costs. 3. Expansion plan: NH aims to strengthen the presence in Europe (France, UK, Germany and Italy) and Latin America (Mexico, Colombia, Chile, Peru) providing top- line growth and compensate non-core disposals.
At the end of February 2015 NH Hotel Group and HNA created “Beijing NH Grand China Hotel Management Co. Ltd”. The Beijing-based joint venture’s corporate purpose is to build a portfolio of NH Hotels and NH Collection brand hotels in the midscale and upscale segments in China owned by HNA or by third parties, in the Chinese territories, Hong Kong, Taiwan and Macao. The target is to develop 120 to 150 hotels by the year 2020 in this market. This business approach fits with NH Hotel Group’s strategy of pursuing growth using capital-light formulas.
4. Facilitators: IT transformation plan: The integration to the SAP system will allow NH to have the front, back and CSR systems integrated, to outsource the administration to a shared services center with concrete savings, and to having unique data with quick access to it.
Generally, NH´s main strategy and focus is in the goal to having more hotels in operation in the upscale category. (Growing from 66 hotels and 10.332 rooms in September 2016 to 71 hotels and 11.150 rooms by 2017). So more and more the group has been investing in reforming totally or partially the hotels, contributing to a rise in the quality and prices of the rooms. These initiatives have allowed NH to differentiate themselves from the rest by its commitment to quality.
59 4 0 20 40 60 80 Completed In execution 6948 8199 21503 35022 51591 54453 58085 0 10000 20000 30000 40000 50000 60000 70000 1991 1996 2001 2006 2011 2016
Source: Company Data
Figure 7: Repositioning Plan Status Sept. 2016 (number of hotels)
Source: Company Data
SHAREHOLDER STRUCTURE
In 2016, the share capital of NH Hotel Group S.A. was represented by 350,271,788 bearer shares with a par value of 2 € each, fully subscribed and paid. Following the latest notifications received by the Company and the communications sent to the National Stock and Securities Commission by the closing of every financial year, the most significant holdings as at 28 April 2016 were as shown in the Graph. (Figure 9)
• HNA
HNA Is the biggest shareholder of NH holding 29.50% of the shares. HNA is a Chinese conglomerate headquartered in Haikou, Hainan, China, a group involved in industries such as aviation, real estate, financial services, tourism and logistics.
• Oceanwood
Oceanwood Capital Management LLC holds 12.00% of NH´s shares. It is a venture capital company founded in 2006 with headquarters in London and Malta. It manages interests of a diverse group of investors, including major private and public funds for pensions, foundations, financial institutions and insurers around the world.
• Grupo Hesperia
The third biggest shareholder is Grupo Hesperia with 9.30% of the shares. This company is based near Barcelona and it owns and operates hotels through its subsidiaries.
• Free Float
49.30 % of the Hotels shareholder structure is represented by the Free Float. The Shareholder structure is suitable for the company. All shares have the same voting and financial rights and are listed on the Continuous Stock Market.
29,50% 9,30% 12,00% 49,30% HNA Grupo Hesperia Ocenwood Free Float
Source: Company Data
NH Hotel Group is constantly updating its Corporate Governance system, which encompasses its Articles of Association, corporate policies, internal rules and regulations, and various internal codes and procedures approved by the competent corporate bodies.
BOARD OF DIRECTORS
The Board of Directors is the Company’s oversight and control body. I t is charged with defining the Company’s management strategies and guidelines, as well as its corporate organization framework in order to achieve greater efficiency, by ensuring that the Company follows appropriate shareholder and market reporting procedures. As part of its oversight and control role, the Board of Directors takes decisions on major business and financial operations and approves the basis for its own organization and operation in order to ensure that it fulfils its role in the best possible manner. The Board of Directors has 11 members by the end of 2016, of which 2 are women and 9 are men. As at 31 December 2016, the structure of the Board of Directors was the following: Chairman of the Board: Mr. Alfredo Fernandez Agras (Proprietary, representing Ocenwood)
Vice-Chairman of the Board: Mr. José Antonio Castro (Proprietary, representing Hesperia)
CEO: Ramón Aragonés Marín (Independent).
Ramon Aragones Marin (Madrid 1954) studied hotel management and tourism in Palma de Mallorca and Louvain universities, and in the Centro Superior de Hosteleria in Palma de Mallorca. He joined Hoteles Hesperia in 2000 as Operations Manager, was appointed Director of operations (2000-2009) and belonging at the same time to the Board of Directors of Hoteles Hesperia. He was subsequently appointed General Director of operations of NH Hotel Group and in 2011 he was appointed Chief Operating Officer. His extensive experience in the hospitality industry led to him being appointed CEO of the group in January 2017.
DELEGATED COMMISSION
The Delegated Commission is set up as a body with decisional capacity of general scope and with express delegation of all the authorities vested in the Board of Directors, except non-delegable powers either by Law or by Articles of Association. Specifically, the Board Regulation of NH Hotel Group, S.A. instructs the Delegated Commission the goal to give perspective and high-level view both to the Board and the executive team, in order to facilitate the Board of Directors in its decision-making process in matters of its competence.
As at 31 December 2016 the Chairman and Vice-Chairman of the Delegated Commission were Mr. José Antonio Castro (Hesperia) and Alfredo Fernandez Agras (Oceanwood) respectively.
AUDIT AND CONTROL COMMITTEE
The Audit and Control Committee is responsible for ensuring efficient internal controls, liaising with auditors, and supervising the preparation and reporting of financial information. It is also responsible for internal audits, risk management systems, and all other functions falling under its scope of competence under the legislation in force, the Articles of Association, and the Regulation of the Board.
As at 31 December 2016 the Chairman of the Audit and Control Committee was Mrs. Koro Usarraga Unsain.
APPOINTMENTS, REMUNERATION AND CORPORATE GOVERNANCE
COMMITTEE
The Appointments, Remuneration and Corporate Governance Committee is responsible for functions related to proposed appointments and terminations of
3.
Management and Corporate Governance
Source: Company Data
Source: Company Data Source: Author
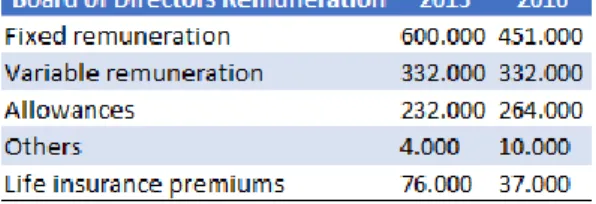
Table 3: Board of Directors Remuneration
Table 4: Ownership structure
directors and senior managers of the Company, as well as for approving compensation scales and senior management contracts. It also deals with matters concerning the remuneration of Board members, Corporate Social Responsibility and Corporate Governance.
As at 31 December 2016 the Chairman of the Appointments, Remunerations and Corporate Governance Committee was Mr. Jose Maria Sagardoy Llonis.
The governance structure is suitable for the company. The members of the board of directors can hardly act in their own interest, because a majority of the voting members is needed for taking the decisions. The Appointments, Remuneration and Corporate Governance committee and the Audit and Control committee also participate in monitoring and auditing the board to protect shareholders from decisions that could affect the company.
The corporate governance is a system of principles, policies and procedures, and clearly defined responsibilities and accountabilities used by stakeholders to overcome the conflicts of interest inherent in the corporate structure. The corporate governance has the objective to ensure that the assets of the company are used efficiently and in the best interest of its investors and stakeholders.
The current composition of the board of directors comprises “External proprietary directors” who are the directors that owned significant shareholding interest in the capital stock, or whose appointment was proposed by significant shareholders and “External independent directors” which are professionals who can contribute their experience and knowledge to corporate governance and who fulfill the remaining conditions required by regulations, including not being connected to the executive team or to significant shareholders.
Out of the 11 members of the board of directors, 3 are “External Proprietary directors” and 8 are “External independent directors”.
The CEO of the company appointed in the beginning of 2017 is independent and has a wide experience in the Industry. This is another important point in showing NH´s governance structure suitability.
25% 18% 21% 19% 7% 10% Spain Italy Germany Benelux Central Europe Latin America
Source: Company Data Figure 10: Revenues per B.U.
GLOBAL AND EUROPEAN ECONOMIC CONDITIONS
The year 2016 started with a modest and decelerating rate of growth. The beginning of the year was marked by some situations that increased the uncertainty as to the future stability of the economy. These factors were the concern regarding the growth dynamics in China, and the British referendum regarding the continuity of the U.K. in the European Union.
After the uncertainty caused by the weakness of the emerging economies in the first quarter and the outcome of the referendum on the UK's retention in the European Union in the second quarter, between July and September, volatility levels in the financial markets declined considerably, in spite of the shareholder devaluation of the European banking sector, as well as the increase in the probability of a new rise in interest rates by the Fed. The improvement in investor sentiment was reflected, among other things, in the appreciation of the main index of the US stock market index (S&P 500) for a new historical high.
This environment of higher optimism has driven demand for safe haven assets, which has led to falling precious metal prices and rising US and German public debt yields. On the exchange side, the dominant note in the third quarter was the strong depreciation of the sterling pound.
SPAIN ECONOMIC CONDITIONS
After six years of recession, the recovery started in the second half of 2013 and continued to strengthen in 2015 and 2016, with year on year growth exceeding 3% of GDP. Stimulated by domestic demand, growth was boosted by the confidence of households and investors, in turn stimulated by job creation, deflation, better credit conditions, lower oil prices, recovery in Europe, the depreciation of the euro and the implementation of reforms. Growth surpassed expectations in 2016 (3.1% of GDP), supported by domestic demand.
Spain's unemployment rate has fallen due to the decline in the workforce and the creation of new temporary contracts, but it is still very high (under 20%), and a third of wage earners receive a maximum of EUR 707 per month. The crisis has led to a general decline in the standard of living and an increase in inequality. Catalonia has not abandoned its demands for independence, and a new referendum should be convened at the end of 2017. Luckily, the referendum happening or its outcome shouldn’t have any impact on NH.
Tourism is the country's largest source of income, which has become the second largest tourist destination in the world, stimulating exports of goods and services. The service sector accounts for two thirds of GDP and employs more than 75% of the population. Figure 11 shows the International tourists arrivals in Spain in past years.
HOSPITALITY INDUSTRY
The hospitality industry is a broad group of businesses that provide services to customers.
This industry is divided in three primary areas:
1. Accommodation: This area includes hotels, motels, bed and breakfasts, and other lodging businesses.
2. Food and beverage: This area comprises restaurants, fast food chains, and other establishments that provide food and beverage.
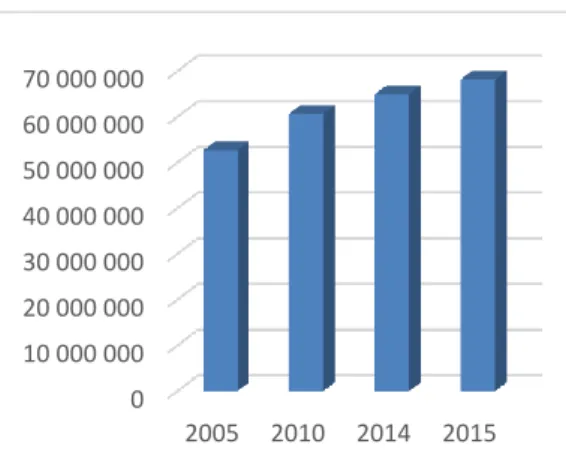
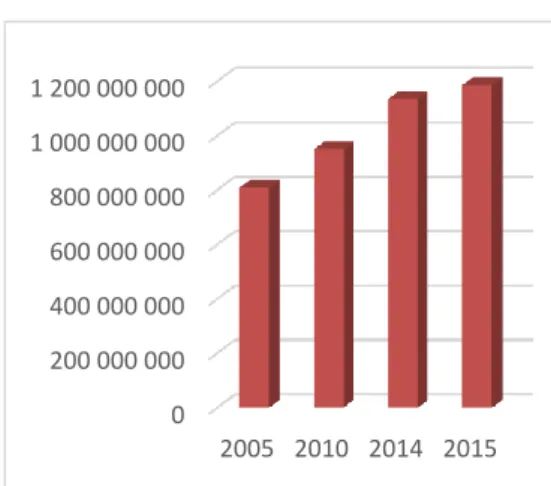
3. Travel and tourism: This area includes airlines, trains and cruise ships. The travel and tourism industry is a highly profitable and valuable industry to the global economy, making a direct economic impact of more than two trillion U.S. dollars each year. The largest contribution is made by the European Union, followed by North America and North-East Asia. The number of international tourist arrivals throughout the world grew from 949 million in 2010 to 1,13 billion in 2014 (Figure 13). This number
4.
Industry Overview and Competitive Positioning
0 100 000 000 200 000 000 300 000 000 400 000 000 500 000 000 600 000 000 700 000 000 2005 2010 2014 2015 0 10 000 000 20 000 000 30 000 000 40 000 000 50 000 000 60 000 000 70 000 000 2005 2010 2014 2015 Source: UNWTO Source: UNWTO
Figure 11: International tourist’s arrivals Spain
has increased steadily almost every year and has more than doubled from 527 million in 1995 to approximately 1,19 billion in 20153.
Intrinsically linked with the travel and tourism industry is the other area of the hospitality industry: Accommodation.
Globally, the Accommodation industry comprises approximately 15,5 million rooms. In 2014 the global hotel industry revenue was 427,69 billion U.S. dollars. This number is set to continue growing at a strong pace also due to faster and cheaper new ways of travelling.
At a European level, the continued conflicts and instability in the Middle East and North Africa may have played an important role in travelers choosing European destinations. Growth has been astonishing despite negative incidents that have impacted tourism economies and travel patterns throughout the world. These included terrorism attacks in Tunisia, Egypt, France and England and political turmoil and continued unrest in Syria. Travel volumes were also driven by improving economic conditions. The weaker euro stimulated travel from outside the Eurozone especially the US and the UK. In contrast, spending from Germany, Italy and Australia grew at a slower rate, while demand from Canada and France was rather weak4.
There are different business models within the hotel industry: (Figure 14)
Owned hotels: These hotels are owned and operated by an owner who bears all the costs associated with the hotel but also benefits from all of the income;
Leased hotels: This model is similar to the owned hotels model, except that the owner-operator of a hotel does not have outright ownership of the hotel but pays rental fees to the ultimate owner of the property.
Managed hotels: In this model, the owner of a hotel uses a third-party manager to operate the hotel on its behalf and pays the manager management fees.
Franchised hotels: These hotels are owned and operated by an owner under a third-party brand name, and the owner pays a brand licensing fee to the brand owner.
DEMAND AND SUPPLY
Supply and demand is the fundamental concept behind any industry in the economy. Supply of new hotels cannot be easily or rapidly adjusted on any large-scale basis because the addition of a hotel takes a large investment and a long time. Low levels of new supply help hotels to increase their occupancy rate.
In contrast to this time lag in supply, demand fluctuates daily. One of the main drivers of the demand is the economic recovery and GDP. Eurozone GDP is expected to continue to expand in 2017 by 1.7% 5, its fastest growth rate since 2011. Demand is also affected by global security concerns as we have already mentioned before (terrorism) so depending on the area demand can grow or decrease based on these happenings. Another factor that can stimulate the travel is a variety of regular as well as one-off events like Football Championships, Expos, Olympics and so on.
As we will see next, occupancy rate increase suggests an increase in the demand. Occupancy
The occupancy rate is one of the three main indexes used for the Revenue Management in the accommodation industry. It is the share of total rooms available which are occupied or rented at a given time.
• Occupancy= Number of occupied rooms /Number of total available rooms
3UNWTO Tourism highlights, 2017 Edition in https://www.e-unwto.org/doi/pdf/10.18111/9789284419029
4European Cities Hotel Forecast 2017&2018, PWC in
https://www.pwc.pt/pt/temas-actuais/european-hotels-forecast.html
23%
21% 56%
Managed Owned Leased
Source: Company Data
0 200 000 000 400 000 000 600 000 000 800 000 000 1 000 000 000 1 200 000 000 2005 2010 2014 2015 Source: UNWTO
Source: Company Data
Figure 13: International tourist’s arrivals World
Figure 14: Operating breakdown by contracts
In 2016 NH Hotels had an occupancy rate of 68.7% the highest rate in the last years and 0.7% higher than in 2015 where the occupancy was 68.0%. The European occupancy was up around 0.6% to 70.4% in 20166.
ADR (Average Daily Rate)
The Average Daily Rate is a measure of the average rental income per paid occupied room in a given period. This statistical tool together with the hotels occupancy are the foundations for the hotels financial performance.
• ADR = Rooms Revenue / Rooms Sold
The ADR of NH Hotels in 2015 was € 87,1, representing a price increase of 10.4% since 2014 where the ADR was € 78,9. In recent years, the only higher ADR was in 2008, before the crisis, with a rate of € 89,0. In 2016 the ADR of NH Hotels reached € 90,2. The European ADR rose 1.5% from 2015 to 2016 to € 111,77 according to the hotel data supplied by a sample of hoteliers7.
RevPAR
RevPAR is a ratio commonly used to measure financial performance in the accommodation industry.
When an analysis is carried out, RevPAR figures can be compared to RevPAR of the hotel during the same time frame of the previous years. It is calculated as follows:
• RevPAR = Rooms Revenue / Rooms Available
RevPAR only evaluates the income as a percentage of room sales, not including any other factors that also take account into making profitability (like tour sales, room service, and spa bookings. Because it is calculated on a per room basis, one hotel can have a higher RevPAR than another, but still have lower total revenues if the second hotel has more rooms.
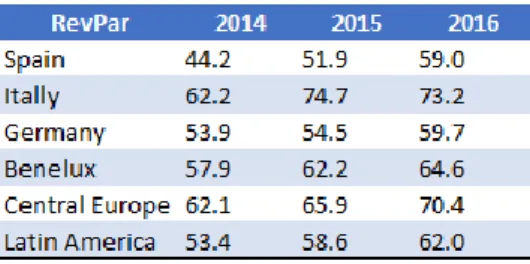
RevPAR ratio of NH Hotels has been growing steadily from 53.3 in 2014 to 58.3 in 2015 and finally to 62.0 in 2016 (Figure 15). Overall in 2016, the European hotel industry saw RevPAR increase 2.1% to € 78,64, and it was the seventh year of growth since 20108.
COMPETITIVE ANALYSIS
NH’s main competitors are similar hotel chains with a wide international presence. We will not divide the competitors by more luxurious or low-cost hotels, because NH hotels has chosen to leave the low-cost market sector by improving the product and the service and focusing in the upper scale segment.
The main European competitors of NH Hotels based in Spain are: Melia Hotels International, Riu Hotels and Resorts, Barceló Hotels and Resorts and Iberostar Hotels and Resorts. All of the above have their origins focused in the Spanish holiday sector, but have expanded its business models to other segments, eventually also expanding to other European locations. Other NH´s competitors with origins in U.K., U.S.A. and others are the following: Intercontinental Hotels Group, Hilton Hotels and Marriot International. The success of the above multinationals is based on a much greater offer than NH, offering certain services and additional products like suites for long stays up to one year and fully equipped aparthotels. In spite of this, the segments in which they compete with NH (urban and vacation) are qualitatively and geographically comparable. In this way, NH has less global presence, but within the Geographical area of Europe and Latin America, it can be compared in magnitude with any of them.
6STR Global – Hotel Market Data & Benchmarking, in https://www.strglobal.com/
7 STR Global – Hotel Market Data & Benchmarking, in https://www.strglobal.com/
8 STR Global – Hotel Market Data & Benchmarking, in https://www.strglobal.com/
53,40 58,60 62,00 52,00 54,00 56,00 58,00 60,00 62,00 64,00 2013 2014 2015 2016 2017
Source: Company Data Source: Company Data
Source: Company Data Table 7: ADR
Table 8: RevPar
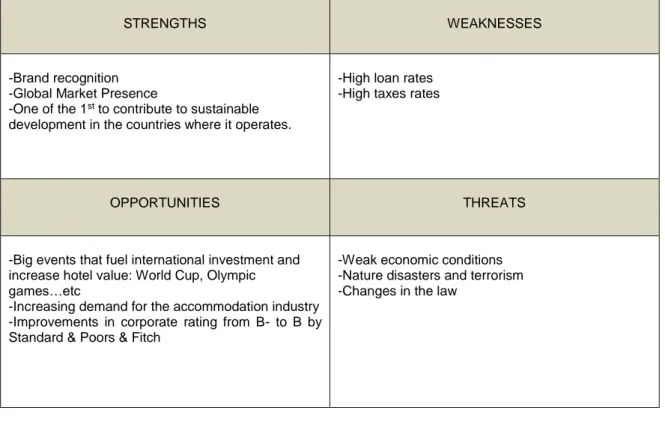
SWOT ANALYSIS
STRENGTHS WEAKNESSES
-Brand recognition -Global Market Presence
-One of the 1st to contribute to sustainable development in the countries where it operates.
-High loan rates -High taxes rates
OPPORTUNITIES THREATS
-Big events that fuel international investment and increase hotel value: World Cup, Olympic games…etc
-Increasing demand for the accommodation industry -Improvements in corporate rating from B- to B by Standard & Poors & Fitch
-Weak economic conditions -Nature disasters and terrorism -Changes in the law
PORTERS 5 FORCES
Bargaining power of Suppliers: Medium -High
Intermediaries as Expedia.com, Tripadvisor and Booking.com have increased their bargaining power and they pressure hotel profits.
Bargaining power of Customers: High
Nowadays customers have many online tools to compare prices and book las minute affecting hotel chains profits. Because of the very big quantity of hotels available for customers for their choice, they can change from one to another at little or at no cost. Threat of new entrants: Low
The entry barrier is very high because of the very high capital requirement. Another point is the loyalty programs that offer existing customers incentives for their patronage. This makes it very hard for new hotel brands to attract new customers. Threat of substitutes: Medium - High
Many cities have seen significant growth in serviced apartments and shared accommodation platforms and this growth in the peer-to-peer rental stock could continue to outpace hotel room supply in 2017. In this sense, the threat to NH is only medium as they are focusing on improving the quality, betting on the product differentiation and upgrading the hotels to the Upper Upscale.
Competitive rivalry between existing players: High
Usually hotels compete on services and not on prices. They focus specially in product differentiation in their segmented markets. With the refurbishment plan started in 2012 NH is improving its products and services, differentiating itself from its competitors.
0 1 2 3 4 5 Bargaining Power of suppliers Bargaining Power of customers Threat of new entrants Threat of substitutes Competitiv e rivalry between existing players Source: Author
Our recommendation for NH stands for hold with a 2017YE target price of € 5.69/sh and a three-month upside potential of 0.35% with medium risk. In the relative valuation through multiples analysis we have an average price target of € 6.63/sh, supporting our view that NH is currently slightly undervalued.
VALUATION METHODS
For evaluating NH Hotels S.A., we used two different valuation methods: • Absolute valuation model
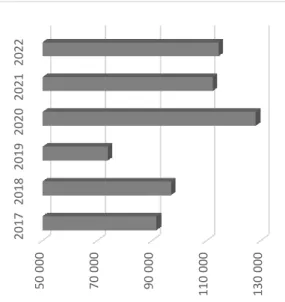
For this model, the Discounted Cash Flow approach was used. This approach determines the total value of the firm to all investors. It is the most suitable approach for NH as the company’s dividends distribution for the future is not clear. The value of the company was determined using WACC to discount the Free Cash Flow to the Firm (FCFF) (Figure 17). FCFF is calculated adjusting the EBIT for the net debt.
• Relative valuation model
For this model, we used the Market Multiples approach. In this approach, the goal is to value assets based upon how similar assets are currently priced in the market. In relative valuation, the multiple is computed for all the companies in a group then compared across these companies to make judgements if they are overpriced or underpriced.
Investment Risks
This industry can be strongly affected by changes in the demand which would affect the Occupancy rate. Risks such as terrorism attacks, although being difficult to predict but that have been growing in Europe in latest times, can potentially lead to the loss of costumers.
Risks to Price Target
To assess the investment risks and its possible repercussions on our price target, a sensitivity analysis has been performed. The main variables tested were the occupancy and the ADR rates to analyze how small changes in these variables could impact our target price.
5.
Investment Summary
50 000 70 00 0 90 000 110 000 130 000 2017 2018 2019 2020 2021 2022 Source: Author Figure 17: FCFF EvolutionDCF VALUATION APPROACH
Using a discounted cash flow (DCF) valuation method, a target price of € 5.69/sh was reached with an upside potential of 0.35% from its closing price of € 5.67/sh on the 29th September 2017.
In our opinion, NH is currently slightly undervalued and based on the above valuation, we recommend to Hold, although with medium risk.
The DCF model is deeply influenced by the following factors:
Total Revenue
In this research, we consider the revenues of the company as a whole, without splitting them by geography or business segment. The reason for this is that NH also doesn’t consider the revenues as split in its annual income statements, so we have decided to follow the same path.
Total Revenues is the sum between room revenues and other operating income. It includes hotel revenue from owned and leased hotels, fee revenue from management agreements, real estate revenues and other non-hotel revenues. Revenue from owned and leased hotels consists of room sales and food and beverage sales through restaurants, bars, conference facilities and in-room dining. Additionally, we obtain revenue from renting conference rooms for meetings, conventions and other events as well as telephone, parking and all other guest services.
Room revenues
Revenue from our existing hotels is primarily affected by Occupancy and ADR. Both Occupancy and ADR are strongly correlated to general economic conditions, the strength of the travel industry and the supply and demand of hotel accommodation in a specific market. Occupancy is also affected by the supply of hotel rooms in the area surrounding each of our hotels, and increases in hotel room supply, which can increase competition and make it more difficult to achieve high Occupancy. Overall, Europe is expected to continue to see relatively low levels of new hotel supply growth and a growth in international tourism arrivals of between 2% and 3% in 2017. (PWC). For forecasting the revenues, the ADR and Occupancy Rates were forecasted, assuming a growth based on the average growth of the last 3 years.
Other operating income
Other operating income includes extraordinary income not allocable within the regular operations, including operating subsidies, compensation paid to NH in connection with termination of contracts, indemnities and the capitalization of expenses related to work completed with respect to its own hotels. As for other operating income, it was assumed that it will remain stable over time adjusted only for the forecasted inflation rate.
Staff cost
Personnel is the second largest cost in NH, in the last 3 years it accounted for an average of 29.21% of the total revenues. Staff costs have increased steadily in the last 3 years together with total Revenues and higher Occupancy. As we predict further increase in Occupancy and Revenues in the coming years, we predict that Staff Cost will also increase.
Other operating expenses
Other operating expenses account for the largest cost in NH. A significant portion of other operating expenses is rent expense, which is primarily determined by NH´s ability to negotiate favorable terms under its lease agreements and the general economic conditions in the region in which the hotel is located. Other operating expenses include fees paid for professional and other services; commissions payable to third parties; energy costs; repair and maintenance costs; laundry expenses; sales and distribution
6.
Valuation
2014 2016 2018 2020 2022
Source: Company Data
Source: Company Data, Author Table 9: Revenues by B.U.
telecommunication; allowances for contingency provisions; operational taxes, including real estate and property taxes; and property insurance payments.
We believe that as also shown in the past years, the above expenses will remain stable over time, and will only be adjusted by the predicted inflation rate.
Capital Expenditure (Capex)
NH´s capital expenditures consist primarily of expenditures towards maintenance of the hotel facilities, the opening of new hotels and information technology. Maintenance capital expenditures include repairs, ordinary course maintenance expenses and expenditures necessary to comply with legal requirements, such as occupational, health and safety standards.
In 2014, 2015 and 2016, investments in property, plant and equipment were mainly related to the brand development initiative, refurbishment program and the maintenance of the hotel facilities.
In the year ended December 31, 2016, NH invested approximately € 82,0 million as part of the repositioning initiative started in 2014 and it expects to invest approximately an additional € 9,7 million during 2017 to complete approximately € 200 million of investments since the plan was launched in 2014. In this scenario, we predict that CAPEX will largely decrease in 2017, as 58 of 65 hotels have already been refurbished and the company expects to invest € 9,7 million for this in 2017. As the refurbishment plan will end in 2017, the CAPEX related to property, plant and equipment will be largely lower in the coming years.
As per the capital expenditures associated to Intangible assets, these are mainly related to investments for the overhaul of the IT management systems and the upgrade of the software applications. These expenditures we assume that will remain stable over time as they have been for the last years, considering that the IT systems will continue needing maintenance and upgrades over the coming years. Altogether, we predict a stable lower CAPEX as from 2017 considering the investments in property, plant and equipment will decrease greatly. (Figure 19)
Depreciation and amortization
Depreciation allowances mainly include the amortization of the tangible fixed assets, consisting primarily of buildings, technical installations, machinery, fittings, furniture and equipment. As we have predicted that the tangible fixed assets will remain steady over the coming years, the depreciation and amortization allowance will also be relatively steady accordingly.
Net Working Capital
NH´s working capital requirements largely arise from its trade and other receivables, which primarily consist of amounts owed by its customers. The liabilities to the trade creditors include accounts payable arising from regular trading activities, and advance payments from customers, which includes customer deposits arising from the hotels. Historically NH has funded its working capital requirements through funds generated from operations, from borrowings and other indebtedness and through funds from other finance resources. We predict a decrease in the net working capital in the next years mainly due to the decrease in the trade and other receivables and in the trade creditors accounts.
WACC Assumptions
WACC is the weighted average of the after (corporate) tax required rates of return for debt and equity and uses the weights of debt and equity of the company’s target capital structure.
For calculating the WACC we assumed a Risk-free rate (Rf) of 0.60% based on the 10-year German government bunds. The Country Risk Premium (CRP) was assumed in 1.12% and the Market Risk Premium (MRP) in 6.00% based on market reports. In order to calculate the beta levered (β) we first researched for the unlevered beta of the industry, which is 0.64 as per Aswath Damodoran in January 2017, and then applied the below formula to reach our levered betas for the years 2017F to 2022F.
0 20 000 000 40 000 000 60 000 000 80 000 000 100 000 000 120 000 000 140 000 000 160 000 000 180 000 000 2014 2015 2016 2017 2018 2019 2020 2021 2022
Source: Company Data, Author
Source: Author
Figure 19: CAPEX Evolution
βl = Unlevered Beta (1 + (1- tax rate) (D/E Ratio)
We calculated the Cost of Equity (ke) using the Capital Asset Pricing Model (CAPM). It is the rate of return a firm pays to its equity investors. For this we used the below formula:
Ke= Rf + β(Rm-Rf) + CRP
We used a fixed cost of debt (kd) of 6.54% calculated by dividing the interest expenses by the company’s total debt and a Marginal Tax Rate (T) of 25% according to Spanish law. (Table 10)
RELATIVE VALUATION
The relative valuation approach is complementary and the objective is to cross check the results already obtained in our absolute valuation model. One of the main supposition is that a company can be valued based on the value of its peers. This is why selecting the correct peers is so important. Next, I will describe the peer selection process.
Peer Group
The first step was to get all biggest hotel chains in the world. This first list consisted of 30 firms. However, even if the essence is similar to NH´s, there are some other differences that had to be considered. Of our first list, we filtered by checking first if the company is traded in a stock exchange, second if it is international, and last if it had at least 50 000 rooms in Europe. The remaining companies in the list were filtered in terms of revenues, total rooms, Beta, ROE and ROA. As a result, we selected the following 5 firms considered as appropriate peers for our Valuation: Melia Hotels International (ES), Hilton Hotels (U.S.), Marriot International (U.S.), Intercontinental Hotels Group (U.K.) and Accor (FR).
To calculate NH´s stock value by the multiple valuation the multiple EV/EBITDA and Price/Earnings (P/E) was used.
EV/EBITDA realized a target price of € 7.75/sh for 2017YE, representing an upside potential of 42%.
For the P/E a target price of € 5.51/sh was reached for 2017YE, representing an upside potential of 1%.
The result of the P/E strengthens the results concluded by the DCF valuation and reinforces our perspective that NH is indeed undervalued. However, considering the two multiples, we reach an average price target of € 6.63 representing a difference of € 0.94 compared to DCF valuation. (Table 12)
Despite the very useful information provided by the multiples valuation approach, as already mentioned before, it is considered a complementary approach. The approach supports our view and our recommendation remains to Hold.
Source: Author Source: Author Table 11: DCF Valuation
EBITDA Margin
From 2014 to 2015 EBITDA increased from € 88,1 million to € 124,3 million, an increase of € 36,2 million. Or 41.1%. In 2016 the EBITDA increased further, to € 219,3 million, an increase of € 94,9 million or 76.3%. This increase was primarily due to an increase in net turnover, primarily driven by increased ADR and Occupancy rates, as well as an improvement in efficiency in operating expenses. EBITDA increased despite certain external factors such as the security problems in Belgium relating to terrorist attacks and the fluctuations in exchange rates in Latin America. The ongoing implementation of its strategic plan since 2013 has been a key driver underlying the increase in NH´s EBITDA. It will continue to grow steadily and reach € 254,570 million in 2022.
Liquidity
NH´s main sources of liquidity are cash flows from operations and cash proceeds from financing activities. Sales of non-strategic assets provide additional liquidity. NH´s cash flows have historically been sufficient to meet its liquidity requirements. In 31.12 2016. the group had cash and cash equivalents amounting to € 136,733 thousand. It also has capacity to increase its financial borrowing. Operational improvements and deleveraging have helped to reduce costs and risks. The debt burden and the cost of debt have been reducing in the last years. Considering the groups focus on operational improvements, it should keep decreasing between 2017 and 2022.
EBIT
Revenues are mainly affected by Occupancy and ADR rates. Both are strongly correlated to general economic conditions. EBIT has increased greatly from € 17,128 million in 2014 to € 106,703 million in 2016. With the GDP growth projection in the Eurozone and U.S. in the coming years the groups EBIT will see further increase reaching € 169,138 million in 2022. (Figure 21)
Costs
Since 2013, NH has implemented a cost savings initiative to reduce its fixed cost. The group has already consolidated the janitorial and maintenance services on a regional basis and outsourced the janitorial services. This restructuring makes the groups cost structure more efficient, allowing to increase or decrease services in accordance with occupancy levels. In 2015, the centralization of the administrative staff was completed in most countries through the implementation of a shared service center. With the ongoing implementation of the strategic plan, the operating expenses will decrease as a percentage of revenues.
Dividend policy
NH has not paid any dividends in the years 2014 and 2015. Its dividend policy is uncertain. In 2016 dividends were distributed of € 0,003 per outstanding share representing € 1,056 million. In 2017 there is a proposal for General Shareholders Meeting approval of a new long-term incentive plan aligned with value generation for shareholders and of the distribution of a dividend for a maximum gross of € 0,05 per outstanding share, representing an estimated pay-out of € 17 million.
Return on Equity (ROE)
NH´s ROE was negative in the years 2014 and 2015, standing at -3.7% and -0.2% respectively but recovered in 2016 reaching 3.2%. From 2016 until the end of the valuation period, the ROE will continue increasing at an average of 0.6% per year. This growth is to be attributed to the higher profits achieved. (Figure 22)
7.
Financial Analysis
-60 0 00 0 00 -20 0 00 0 00 20 000 000 60 000 000 100 000 000 2014 2015 2016 2017 2018 2019 2020 2021 2022 -4,00% -2,00% 0,00% 2,00% 4,00% 6,00% 8,00% 0 20 000 000 40 000 000 60 000 000 80 000 000 100 000 000 120 000 000 140 000 000 160 000 000 180 000 000 2014 2015 2016 2017 2018 2019 2020 2021 2022Source: Company Data, Author
Source: Author
Source: Company Data, Author Figure 20: Net Profit Evolution
Figure 21: EBIT Evolution
Market and Economic Risk
-Change in demand /Macroeconomics (MER1)
The change in demand can depend on many factors that affect the global travel and business activity. These events can be for example unforeseen public health crises, such as pandemics and epidemics; political crises, such as terrorist attacks, war, and other political instability; and other catastrophic events, whether occurring in Europe or internationally. NH Hotels operations are exposed to the risk of the above-mentioned events that adversely affect domestic or international travel. And significantly affect the group’s results.
-Terrorism (MER2)
As we have seen already before in this research, terrorism can potentially adversely affect the domestic or international travel. The recent terrorist attacks in Paris, London and Manchester could result in people travelling less out of fear, decreasing the hotels industry occupancy rate. This would have a big impact in the groups revenues. A good example is Paris, where after the terrorist attacks in November 2015 the Occupancy has decreased from 77% in 2015 to 69% in 2016.
Regulatory and Legal Risk -Litigation (RL1)
In the normal course of the accommodation industry business, hotels are often involved in various legal proceedings. The outcome of these proceedings cannot be predicted. If any of these proceedings were to be determined adversely to the hotel or a settlement involving a payment of a material sum of money were to occur, there could be a material adverse effect on the group’s financial condition and results of operations. Contractual and other disagreements with third-parties could also result in litigation costs or other expenses, which could lower the profits.
- Regulatory Requirements (RL2)
NH is subject to numerous laws and regulations in the jurisdictions in which they operate. Compliance with applicable rules and regulations and related dialogue with regulatory authorities involve significant costs and resources. This could increase the costs and liabilities, reduce the margins and cash flow and impact their ability to run the business.
-Tax rates (RL3)
NH´s Hotels that are profit making are subject to profit and income tax, among others in the markets in which it operates. Changes in tax laws and tax rates may lead to higher tax expenses and liabilities and could have a material adverse effect on the business, results of operations or financial condition. This type of changes are unpredictable and there is no guarantee that they may not be changed in the future.
Operational Risk
-Personnel (OR1)
Increased labor costs due to labor shortages could restrict NH´s ability to operate the properties and to grow its business. NH´s success depends in large part upon the ability to attract, retain, train, manage and engage the employees. Because personnel expenses are a major component of the operating expenses at its properties, a shortage of skilled labor could also require higher wages, which would increase the personnel expenses, and could reduce profits and cash flow.
-Reputation Risk (OR2)
For chain hotel operator, the brand, image and reputation constitute a significant part
8.
Investment Risks
Source: Author Figure 23: Risk Matrix
across Europe, and to leverage this reputation in other markets where it has a growing presence. Travelers expect a consistent level of quality and value, and any event, such as the poor quality of products and services, whether as a result of the actions of employees or financial limitations, that leads to customer complaints or negative publicity or reviews by customers could damage the hotel´s image, reputation or brand, which could negatively affect the business.
Financial Risk
-Liquidity (FR1)
In 2016 NH invested approximately € 82,0 million as part of our repositioning initiative started in 2014 and it is expected to invest approximately an additional € 9,7 million during 2017 to complete approximately € 200 million of investments since the plan was launched in 2014. As of December 31, 2016, a total of 58 hotels have been refurbished and, upon completion of this initiative, 65 hotels will have been refurbished, representing approximately 17% of the hotels portfolio.
The refurbishment program involves modernizing rooms and common areas by refreshing paint and floor coverings and replacing furnishings and finishings. NH´s ability to execute this capital-intensive refurbishment program will depend on its ability to generate cash, and there is no guarantee that it will generate sufficient cash in order to complete the refurbishment program. The inability to generate sufficient cash to carry out work necessary to maintain such properties could have a material adverse effect on the operations in these hotels and ultimately the value of these assets. Another point is that the business may not generate sufficient cash flows from operations, and additional debt and equity financing may not be available in an amount sufficient to enable it to pay its debts when due.
If NH´s future cash flows from operations and other capital resources are insufficient to pay its obligations as they mature or to fund its liquidity needs it may be forced to reduce or delay business activities and capital expenditures; sell its assets or obtain additional debt or equity financing.
-Capital /Debt (FR2)
The hotel industry is a capital-intensive business that requires significant capital expenditures to develop, operate, maintain and renovate properties. Access to the capital that hotel proprietors need to finance the construction of new properties or to maintain and renovate existing properties is critical to the continued growth of the business and the net turnover.
If NH Hotels Group is unable to access the capital necessary to fund current operations or implement its growth plans, profits could be reduced and the ability to compete effectively could be diminished.
Recently, the credit markets and the financial services industry have experienced a period of significant disruption, increased volatility in securities prices and diminished liquidity and credit availability. As a result of these market conditions, the cost and availability of capital has been and may continue to be adversely affected by illiquid credit markets and wider credit spreads. These disruptions could also result in reductions of credit ratings, which would increase the cost of borrowing.
-Foreign Currency (FR3)
NH is subject to foreign exchange risk because its net turnover in each region is generated in the local currencies of the region. Conducting business in currencies other than the euro, subjects NH to fluctuations in currency exchange rates that could have a negative effect on the financial results. However, foreign currency risk has a low impact as NH´s smallest Business Unit is America with only 10% of the total operations of the Group.
-Interest Rates (FR4)
Rising interest rates could limit the ability of NH to refinance existing debt when it matures and increase interest costs on any refinancing indebtedness. Although there is the option to entering into agreements such as interest rate swaps or other interest rate hedging agreements designed to reduce any such floating interest expense payment, these agreements would also expose NH to other risks.
Risk to price Target
A sensitivity analysis was performed, for being able to compute the impact to our price target, of the main risks associated to the industry.
For the sensitivity analysis, the change in many variables were tested as changes in Terminal Growth, Country Risk Premium, and Staff Cost, but the main focus was on the impact of changes in Occupancy and ADR.
Figure 24: Sensitivity analysis
Change in Occupancy 56,24% 62,48% 69,43% 76,37% 84,01% 5,69 2,56 4,13 5,69 7,86 10,05 Change in ADR 75,0 83,3 92,6 101,9 112,0 5,69 4,77 5,79 5,69 7,91 10,10 Source: Author