A comparison between native and immigrant students
David Aas Correia
Dissertation submitted as partial requirement for the conferral of
Master in Economics
Supervisor:
Prof. Joaquim J.S. Ramalho, Full Professor, ISCTE Business School,
Department of Economics
PI
SA
201
5:
S
T
U
D
E
N
T
A
C
H
IE
V
E
M
E
N
T
I
N
N
O
R
W
A
Y
D
avi
d
A
as
C
or
re
ia
PI
SA
201
5:
S
T
U
D
E
N
T
A
C
H
IE
V
E
M
E
N
T
I
N
N
O
R
W
A
Y
A
c
om
pa
ri
son
be
tw
ee
n
na
ti
ve
a
nd
im
m
ig
ra
nt
s
tude
nt
s
D
avi
d
A
as
C
or
re
ia
Student achievement is often considered a product of student background, school variables, and institutional setting. Literature also indicates that these educational inputs have varying effects on students. This dissertation performs an in-depth analysis of student achievement in Norway, us-ing the data from PISA 2015, to see which educational inputs contributed to the fact that Norway performed better than the OECD average. The persisting achievement gap between native and im-migrant students was also thoroughly researched. Student achievement was measured through two main channels: 1) characteristic effects, and 2) return effects, and these were elaborated using de-scriptive statistics, t-tests, educational production functions, and Blinder-Oaxaca decompositions. Results indicate that home possessions such as cultural items and books at home, student motivation and expectations, and parental background had significant positive impacts on student achievement, while significant negative effects were found for wealth items, study time outside of class, emo-tional support, student anxiety, and absenteeism. The school variables were not found very relevant for student achievement. Furthermore, immigrant students experienced significantly worse endow-ments, particularly for language, home possessions, and parental background, and this, together with experiencing worse returns than native students, helped to explain the negative differences between the groups.
Keywords: Student achievement, ethnic group differences, Norway, PISA 2015 JEL Classification: C10, I24
O desempenho dos alunos é frequentemente considerado um produto da formação do aluno, recur-sos escolares e do ambiente institucional. A literatura também indica que esses fatores têm efeitos variados nos alunos. Esta dissertação realiza uma análise aprofundada do desempenho dos alunos na Noruega, usando os dados do PISA 2015, para ver quais fatores educacionais contribuíram para o fato de a Noruega ter tido um melhor resultado do que a média da OCDE. A lacuna persistente entre estudantes nativos e imigrantes também foi investigado. O desempenho dos alunos foi me-dido através de dois canais principais: 1) efeitos característicos, e 2) efeitos de retorno, e estes foram elaborados usando estatística descritiva, testes t, funções de produção educacional e decom-posiçãos de Blinder-Oaxaca. Os resultados indicam que bens domésticos como posses culturais e livros em casa, motivação e expectativas dos alunos, e o trabalho e a educação dos pais tiveram um impacto significativamente positivo no desempenho do aluno, enquanto efeitos negativos foram encontrados para posses de riqueza, tempo de estudo fora da aula, apoio emocional dos pais, an-siedade estudantil e absenteísmo. Por outro lado, as características das escolas não parecem ter um efeito importante para o desempenho dos alunos. Além disso, estudantes imigrantes tinham dotações significativamente piores, particularmente para linguagem, posses em casa, e o trabalho e a educação dos pais, e isso, juntamente com piores retornos do que os estudantes nativos, ajudou a explicar as diferenças negativas entre os grupos.
Palavras-chave: Desempenho dos alunos, diferenças entre grupos étnicos, Noruega, PISA 2015 Classificação JEL: C10, I24
To be able to live life, be happy and help others.
To my family and friends that inspires, challenges and enriches my life. To all the people around the world that strives to make a positive difference. To nature that provides us with all we need.
To how chance and probability makes life beautiful.
To my supervisor that have patiently supported and helped me. This would not have been possible without you.
To Gonçalo that have given me valuable advice for my dissertation.
To my professors and colleagues that have inspired and helped me get where I am. This dissertation, with all its contents, is my responsibility alone.
1 Introduction 1
2 Literature review 4
2.1 Framework . . . 4
2.2 Student achievement . . . 6
2.3 Efficiency and costs . . . 12
3 Hypothesis 13 4 Data 19 4.1 PISA design . . . 19 4.2 Data description . . . 24 5 Methodology 30 5.1 Sampling variance . . . 30 5.2 Model specifications . . . 31 6 Results 36 6.1 Preliminary analysis . . . 36 6.1.1 Descriptive statistics . . . 38 6.1.2 Percentile differences . . . 42
6.1.3 T-test, mean score differences . . . 44
6.1.4 Missing values . . . 52
6.2 Educational production functions . . . 54
6.2.1 Base model . . . 54
6.2.2 Sub-group models . . . 55
6.2.3 Final model . . . 60
6.3 Decomposition methods . . . 63
Bibliography 75
Annex A: Variable explanations 80
Annex B: Standard deviations 82
Annex C: Percentile means 84
Annex D: T-tests, characteristic proportions 86
Annex E: Educational production function 89
4.1 Variable description for all used variables, PISA 2015 . . . 26
5.1 Variable modifications, categorical variables . . . 32
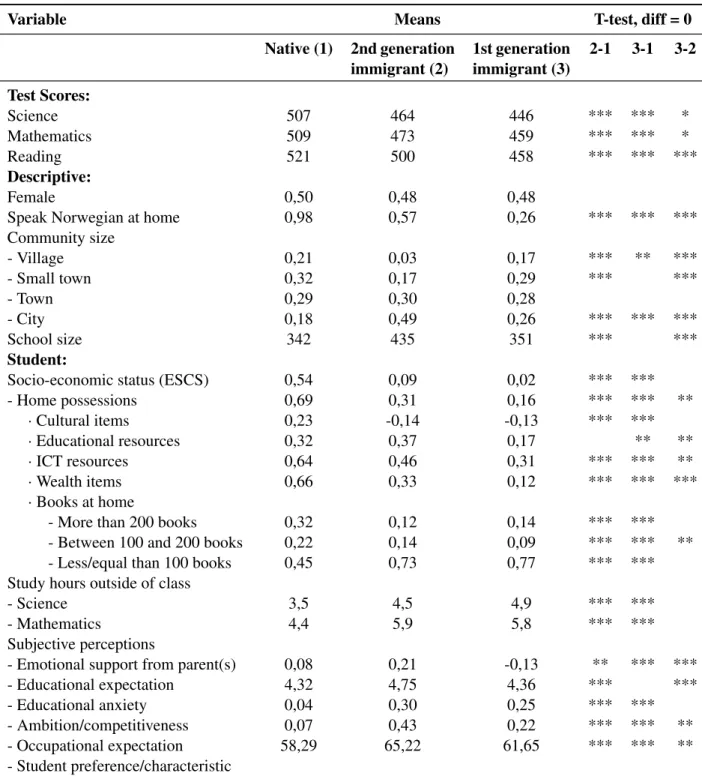
6.1 Student endowments, variable means and differences, PISA 2015 . . . 38
6.2 T-test, mean score differences by categories, PISA 2015 . . . 45
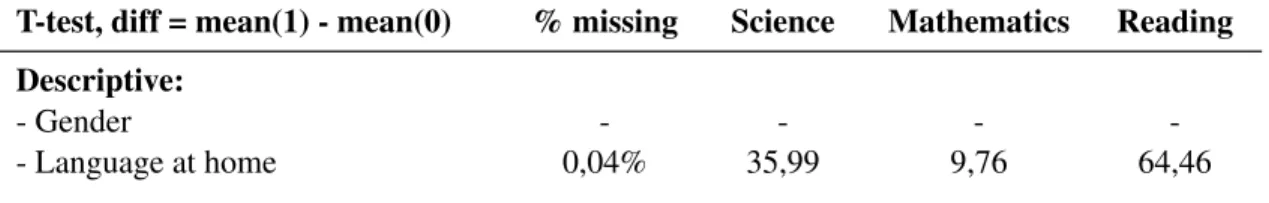
6.3 T-test, between missing and non-missing observations . . . 52
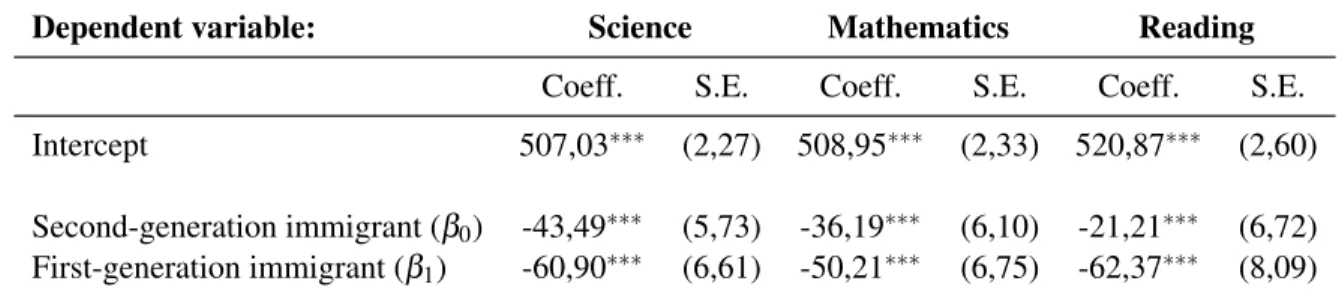
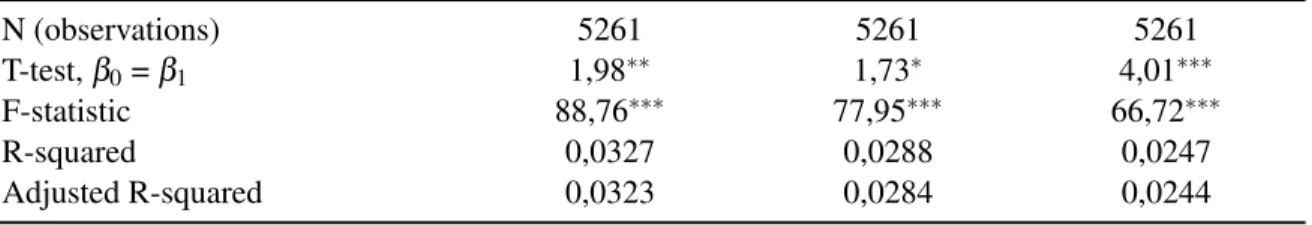
6.4 Preliminary regression model, immigrant categories . . . 54
6.5 Educational production function, descriptive variables . . . 55
6.6 Educational production function, student variables . . . 56
6.7 Educational production function, parent variables . . . 58
6.8 Educational production function, school variables . . . 59
6.9 Educational production function, final model . . . 60
6.10 Blinder-Oaxaca decomposition, between natives and second-generation immigrants 64 6.11 Blinder-Oaxaca decomposition, between natives and first-generation immigrants . . 66
A.1 Indicators for home possessions (homepos) for Norway, PISA 2015 . . . 80
A.2 Upper and lower bounds for the quantitative and index variables . . . 81
B.1 Variable standard deviations, PISA 2015 . . . 82
C.1 Science scores, percentile means, PISA 2015 . . . 84
C.2 Mathematics scores, percentile means, PISA 2015 . . . 84
C.3 Reading scores, percentile means, PISA 2015 . . . 85
D.1 Characteristic proportions and differences, PISA 2015 . . . 86
E.1 Educational production function, final model, upper and lower bounds . . . 89
F.1 Blinder-Oaxaca decomposition, between second-generation and first-generation im-migrants . . . 92
1.1 Immigrants by country, Norway 1970-2017 . . . 1
3.1 Test scores, PISA 2000-2015 . . . 14
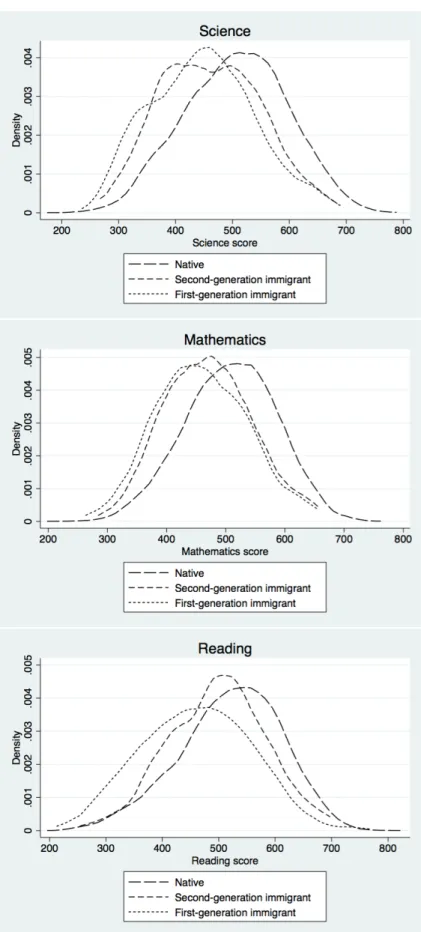
6.1 Test score distributions, PISA 2015 . . . 37
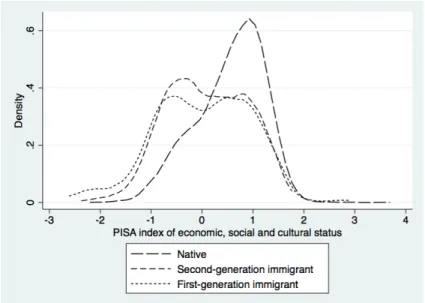
6.2 Socio-economic status (ESCS) distribution, PISA 2015 . . . 41
2PLM Two-parameter-logistic model BRR Balanced Repeated Replication Coeff. Estimated coefficient
Diff Mean difference
EPF Educational production function
ESCS PISA index of economic, social and cultural status ICT Information and Communication Technology ISCED International Standard Classification of Education ISCO International Standard Classification of Occupations ISEI International Socio-Economic Index of occupational status
N Number of Observations
NPM New Public Management
OECD Organisation for Economic Co-operation and Development OLS Ordinary Least Squares
PIRLS Progress in International Reading Literacy Study PISA Programme for International Student Assessment PPS Probability Proportional to Size
S.D. Standard deviation S.E. Standard error SSB Statistics Norway
1 Introduction
Education is considered a fundamental social channel and plays a key role in the well-being and sustainability of a population. It helps both individuals and nations to develop knowledge and skills required to ensure better jobs and lives, and thus prosperity, as well as social inclusion and cohesion. A population’s happiness can also be considered a measure of social progress and, with this in mind, Norway was recently (2017) rewarded as the world’s happiest country1. Since education plays a major role in social formation, it is therefore reasonable to expect equity in Norwegian students’ achievement, and thus, small differences between native and immigrant students in Norway.
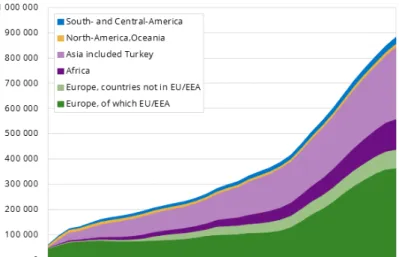
Early 2017, 16,8% of the Norwegian population were immigrants, and Norway has during the last decade experienced strong migration flows and the number of immigrants has doubled during the last ten years (see figure 1.12). With this increasing migration flow, Norway’s ability to preserve
and promote social cohesion depends highly on its ability to integrate immigrants (OECD, 2018). Figure 1.1: Immigrants by country, Norway 1970-2017
Migration flows pose challenges for societies, but also represent opportunities through diver-sity, as immigrants bring new culture, knowledge, and traditions that can enrich the host society.
1World Happiness Report (2017), url:http://worldhappiness.report/ed/2017/. (Accessed on 23 February
2018)
2Statistics Norway, SSB (2017), Immigrants and Norwegian-born to immigrant parents, 1 January 2017,
However, these opportunities need to be unlocked through effective social policies and education. In its essence, an education system shapes the future of its participants since it conditions a per-son’s participation in the labour market and integration into society. According to recent data (2014), Norway was one of the OECD countries with the highest educational spending per student (OECD)3on primary and secondary education. Government expenditure on education aims to pay off through labour and production, and thus it is very important to analyse whether the Norwegian example is successful or not. Not only whether it is successful in terms of student achievement, but also for the integration and social formation of the population.
The existence of wide international studies, that include large representative samples of stu-dents, such as OECD’s Programme for International Student Assessment (PISA), Trends in Inter-national Mathematics and Science Study (TIMMS) and Progress in InterInter-national Reading Literacy Study (PIRLS) are examples of international datasets that allow researchers to study academic achievement. They also collect vast amounts of contextual background information for students and schools which furtherly provide a strong foundation for analysis. PISA assesses 15-year-old students in three key areas: science, mathematics, and reading.
I will in this dissertation use the data from PISA 2015 to investigate student achievement in Norway, more specifically which factors are conducive and adverse for students, and compare how these processes are manifested between native and immigrant students by comparing their performance on PISA. Student achievement is in this context referred to by the students’ PISA test scores. Empirical work suggests that language barriers, socio-economic disadvantage, peer effects and cultural differences are some of the main factors that create differences and adverse learning conditions for immigrants students (Ammermueller, 2007b; Brunello and Rocco, 2013; Jensen and Rasmussen, 2011; Makarova and Birman, 2015; OECD, 2018; Rangvid, 2007; Schnepf, 2007).
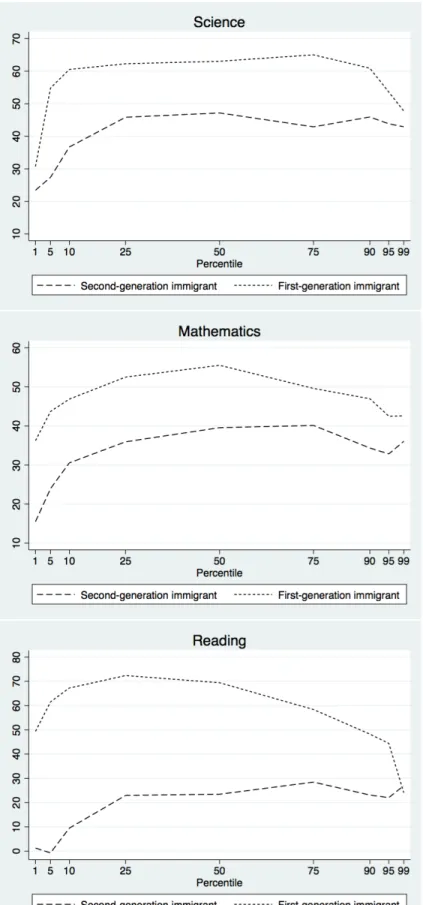
I found that native students performed significantly better than immigrant students in all the three PISA main domains. This difference was found across all percentiles of the score distribu-tion, but smaller differences were found for the three lowest percentiles (1%, 5%, and 10%). Fur-thermore, results indicated that distinguishing second-generation immigrants from first-generation immigrants was reasonable. Immigrants were found to experience worse endowments, and par-ticularly first-generation immigrants, for most of the variables, but parpar-ticularly language, home
possessions, parental background, and school environment. Furthermore, student variables such as socio-economic status, motivation and expectations, and parental background were found most important to explain student achievement. Additionally, socio-economic status and parental back-ground were also found important in explaining differences between native and immigrant students. Lastly, for the Blinder-Oaxaca decompositions, substantial proportions of the estimated gaps be-tween native and immigrant students were explained by the characteristic or return effect. Further-more, the predictors used in this dissertation, in particular, the student and parent variables, helped to explain the differences between native and immigrant students.
This dissertation is organised into seven sections. This section introduces the main framework and idea of this study. Section 2 is a literature review that elaborates more on the Norwegian context and student achievement. Section 3 formalises the research proposal of this dissertation. Section 4 explains the sampling methodology and complexity of the PISA data. Section 5 describes which specific procedures were employed in this dissertation as well as a more elaborated description of modified variables. Section 6 presents the results that I obtained. Section 7 highlights and concludes the main findings of this dissertation.
2 Literature review
This literature review is divided into two main sections: 2.1 Framework and 2.2 Student Achieve-ment. The first section explains and gives a perspective of the Norwegian education system, while the second section is divided into several subsections that discuss student achievement, more specif-ically what contributes to a student’s achievement, how education systems relate to each other, how achievement gaps between native and immigrant students can arise, and research methodologies that have previously been employed in similar analyses. Lastly, a third section 2.3 is included which briefly discusses the cost and efficiency of educational inputs.
2.1 Framework
This section provides a description for the Norwegian education system and some explanations about its evolution. Firstly, 633 029 students were registered in the compulsory school system in 2017. Compulsory schooling is free in Norway and is primarily public with 96,2% of total enrolment (Statistics Norway)4. Students start at the age of 6 and attend compulsory school for 10 years, regularly split into 7 years of primary school and 3 years of secondary school. This implies that PISA normally assesses students attending their last year of compulsory education.
In economic terms, educational expenditure on primary and secondary school in Norway was 2,06 % and 2,42% of GDP in 2014, equivalent to 13 104 US dollars/student in primary school and 15 149 US dollars/student in secondary school. The only country with higher expenditure (US dollars/student) on both school levels was Luxembourg, while countries such as Germany had 8 546 $/student in primary and 11 684 $/student in secondary, and United States with the respective expenditure of 11 319 $/student and 12 995 $/student. In contrast, Mexico only spent 2 896 $/student and 3 219 $/student on the same education levels (OECD)5.
The Norwegian parliament (the Storting) and the Government define the goals and decide the budgetary framework for education. A common educational standard is ensured through national curricula, regulation, and legislation. Furthermore, the National Education Office ensures, in
coop-4Statistics Norway, SSB (2017), Pupils in primary and secondary school, url:
https://www.ssb.no/en/utdanning/statistikker/utgrs. (Accessed on 20 February 2018)
5OECD (2018), Education spending (indicator), doi: 10.1787/ca274bac-en. (Accessed on 19 February
eration with municipal and county authorities, that appropriate schooling is provided. The munici-palities are responsible for running schools at compulsory educational level.
"The aim is for Norway to have high-quality schools that equip individuals and society with the tools they need in order to add value and to build a prosperous and sustainable future. The Norwegian school system is based on the principles of equality and adapted learning for everyone within an inclusive environment. All students should develop key skills, and in the course of their education they should both face challenges and experience a sense of achievement."6
The quote above was taken from the front page of the website for the Norwegian government on education topics for primary and secondary education. It is emphasised that the educational system strives for equality and inclusion. Educational policies are aimed to create both equal and equitable opportunities and conditions for all social groups. Møller et al. (2005) decomposed this Norwegian equality concept into two aspects: 1) providing equal access to education by meeting financial and economic differences, and 2) assuring equity by meeting the diversity in individual learning abili-ties with necessary attention and resource allocation. To achieve this, and by being predominantly public, recent legislature in the educational system has implied liberalisation. Møller and Skedsmo (2013) discussed how the Norwegian education system has been modernised through the New Pub-lic Management (NPM) reforms that started in the 1990s. These poPub-licies aimed at reducing pubPub-lic expenditure and bureaucracy by fostering competition of public services, including deregulation, decentralisation, and organisational flexibility.
International educational surveys, such as PISA, TIMMS, and PIRLS, were important triggers for the modernisation of the Norwegian education system and lifted the debate on education through their potential for international comparison. Norway performed under the OECD average dur-ing the first PISA surveys (2000-2006) and worse than most of its neighbourdur-ing Nordic countries on all/some of the main domains. The poor results led to intense political discussions. Møller and Skedsmo (2013) argued that with the publication of PISA findings, accountability and school leadership became more important. Furthermore, that being listed among the "lower performing" countries during the first PISA assessments, could have started a further development of education
6Norwegian Government (2018), Primary and Secondary Education,
reforms such as the implementation of national tests (in Norwegian, math, and English) in 2004, as a system of quality control. A consolidation and confirmation of this can be learned through the Report No. 30 to the Storting (2003-2004) which often is recognised as one of the turning points for the Norwegian education system. Partially as a response to the publications of the recent interna-tional education surveys, it contained research and a thorough evaluation of the compulsory school system. Furthermore, it led to an important Norwegian education reform, The Knowledge Pro-motion ("Kunnskapsløftet"), which among several other things renewed the national curriculum, increased local autonomy, added more classes in core subjects, and set higher emphasis on teacher quality and education. With this, Nilsen (2010) discussed in his paper how the new neo-liberal ideology, reflected through the NPM reforms, could contradict central focus areas such as inclu-sion and diversity for the Norwegian education system. However, Arnesen and Lundahl (2006) concluded that, despite liberalisation, social-inclusive aspects were still strong in Norway (Nordic countries).
It is important to notice that the poor and worsening PISA results through 2000-2006 involved students that were either completely or partially exempted from the education reforms. The results have continuously improved since PISA 2009 and current results are clear: Norwegian students performed better than the OECD average in all three PISA main domains in 2015.
2.2 Student achievement
With a better performance than the OECD average, it becomes important to discuss what made it possible and which factors contributed to this achievement. Secondly, does it vary between native and immigrant students and what create gaps in student achievement? And does an educational system work similarly across countries? These questions are addressed in this section as well as the main research methodologies used in previous studies.
Educational effects
Which factors can explain variation in student achievement? And how can they be classified? This type of analysis got its benchmark when James Coleman and his colleagues published "Equality of Educational Opportunity" (Coleman et al., 1966), often denoted The Coleman Report. They found that variation in academic achievement in American schools mostly came from external
contex-tual factors and socio-economic indicators, rather than school-specific variables. Ammermueller (2007b), Fuchs and Wößmann (2007), Hanushek and Luque (2003) and Wößmann (2003) also found student background to be the most decisive factor for academic achievement.
In line with Willms (2010) recent research, Dar and Resh (1986) found that classroom composi-tion was more effective than school composicomposi-tion and that the intellectual composicomposi-tion in classrooms positively affected academic achievement. It was also found that compositional quality and per-sonal ability interacted in a way that low-resource students were more sensitive than high-resource quality students to compositional quality. This could imply a trade-off in mixing high- and low-resource students. Similarly, Caldas and Bankston (1997) studied how peer effects affected aca-demic achievement, i.e the influence of the socio-economic profile of classes and schools. They found that attending a school with classmates coming from families with higher socioeconomic status tended to positively raise the students’ academic achievement, independently of one’s own background, race or characteristics. Perry and McConney (2010) found similar results for Aus-tralia.
Apart from student background, school variables are also expected to affect academic achieve-ment. However, the effects are inconclusive. Hanushek and Wößmann (2017) stated little con-fidence on school inputs on educational production. Gundlach et al. (2001) also found evidence suggesting that resource expansions over time, in most countries of the OECD, were not signifi-cantly important for academic achievement. For the US, Hanushek and Luque (2003) confirmed this by demonstrating that school resources were not significantly important for student outcomes. On the other hand, Krueger (2003) found evidence of a relationship between class size and student achievement, in particular, small positive effects of smaller classes on achievement, and similarly, Hedges et al. (1994) showed a positive relationship between resource inputs and school outcomes. By including teachers as school resources, Darling-Hammond (2000) found that teacher "quality" was a powerful predictor of student achievement, while Egalite et al. (2015) analysed the student achievement effect of own-race teachers and found small, positive effects. Consequently, it seems that school resources have an intricate and complex relationship with student performance and Robinson (2007) discusses this widely in her book.
A student’s achievement is also affected by its belonging school system and how the institu-tional setting constitutes the learning environment of the students. Wößmann (2016) found that
a significant part of international differences was explained due to institutional features. External exit exams and increased competition from private sector positively affected student achievement, while school autonomy was found to be positive in developed countries, but negative for devel-oping countries. The same effects of school autonomy were also found in Hanushek et al. (2013) research. Fuchs and Wößmann (2007) found roughly 25% of international differences to be due to institutional variation. Lavy (2015) findings also showed that instructional time had a significant, positive effect on student achievement. However, the results were heterogeneous as he found that the effects were higher for immigrants, girls, and students that had lower socio-economic status.
Thus, the literature suggests that socio-economic status has been an important explanatory vari-able and that it mainly contribute through two channels: 1) directly through own student back-ground, and 2) through its composition within schools/classes. School variables and institutional setting are also central to student achievement, but results have been ambiguous.
Individuality of educational systems
Education systems vary amongst countries. Is there a construct of an "ideal" system or does it depend on its context? Heyneman and Loxley (1983) conducted a study with 29 different countries to see how family background and school quality affected academic achievement, and how the level of economic development in a country conditioned the relative strength between the two individual effects, of family inputs and school resource quality, on student achievement. They reported that lower-income countries had weaker family effects and greater effects coming from teacher and school quality. Their results implied that the success of an education system not only depended on certain inputs but also on its context. However, both Baker et al. (2002) and Bouhlila (2015) found that the Heyneman-Loxley effect has declined over time and no longer was applicable in the same way. Baker et al. (2002) also found that there was a positive relationship between GDP per capita and mean national student achievement (in mathematics and science). More recent studies have researched the cross-country variation of student achievement (Fuchs and Wößmann, 2007; Hanushek and Wößmann, 2017; Wößmann, 2016) and suggest that country-specific elements are important. School systems and institutional settings were found to be important components for student achievement.
and cross-country differences have been found more important in the explanation of variation in student achievement. The idea of a successful, universal education system seems controversial and focus should rather be put on each individual system.
Student achievement gaps
What causes gaps in academic achievement between native and immigrant students? Most contem-porary theories fall into two general theories: 1) how cultural aspects promote/discourage academic achievement, and 2) how the structural position of ethnic groups affects children’s (school, peer and parent) environments. Ethnic groups have different cultural orientations which can be ben-eficial or negative for educational achievements (DiMaggio, 1982; Makarova and Birman, 2015; Warikoo and Carter, 2009). Meanwhile, there is literature that traces the structural position of eth-nic groups and proposes that class differences are manifested through varying parental practices, socioeconomic status, and schooling opportunities (Ammermueller, 2007b; Kao and Thompson, 2003; Wößmann, 2016).
Rangvid (2007) researched the underlying sources for the existence of racial/ethnic gaps in aca-demic achievement in Copenhagen, Denmark. Her results suggested that immigrant students at-tended schools with at least as favourable conditions as native students and that performance gaps might come through lower academic expectations, encouragement, and pressure combined with adverse peer effects.
Another consideration is that students typically attend schools close to their home, implying that schools located in less affluent neighbourhoods followingly are expected to have a more disadvan-taged student composition. Jargowsky (2009) explains how schools of these neighbourhoods are attended by immigrant students with limited language proficiency and by native students with a relatively poor parental background.
Brunello and Rocco (2013) found in their cross-country study evidence suggesting that a dou-bling of the share of immigrants students in a school could reduce average school performance of natives by 1 - 3,4 % (depending on the group of natives). They also found that the estimated negative effect of immigrant pupils was stronger in countries with higher school segregation, fur-thermore, that the impact of desegregation policies was small. In Israel, Gould et al. (2009) found that the negative effect of immigrants on natives was larger for native students from a more
disad-vantaged socio-economic background and that those effects were generally nonlinear. Nonlinear, meaning that the composition effects were stronger at lower levels of immigrant concentration, and, hence, proposing a plausible mitigation by increasing immigrant composition. Hanushek et al. (2009) studied ethnic composition and found that academic achievement of Texas students, in par-ticular, black students, were adversely affected by a higher percentage of black schoolmates. In comparison, the enrolment of Hispanic students had a lower impact on achievement. On the other hand, Ohinata and van Ours (2013) did not find strong evidence for negative effects caused by the presence of immigrant students in the Netherlands, while Schnepf (2007) found mixed evidence on effects of immigrant concentration in her cross-country analysis.
With this, student achievement gaps seem to be created through differences in socio-economic status, peer effects and school/class ethnic composition. The effects also seem to imply different effects with respect to the distribution of the students’ level of socio-economic status and how this is composed through schools and classes.
Research methodology
This subsection discusses different methodologies that have been applied in similar empirical work that have used data from PISA or similar studies.
Student achievement can be interpreted as a function of educational factors, ideally with all current and prior inputs. These educational production functions (EPFs) have often been used to see how various inputs affect student achievement. Furthermore, some important aspects have been highlighted through Todd and Wolpin (2003) findings and many authors have incorporated these considerations into their methodology. Many researchers have used the PISA data to estimate ordinary least square (OLS) regression models as educational production functions7:
Student achievement = f (student background, school f actors, other variables) (1) The authors took advantage of the information available in the PISA data. Student background
7For examples, see: Ammermueller, 2007a; Ammermueller, 2007b; Baker et al., 2002; Caldas and
Bankston, 1997, Dar and Resh, 1986; Egalite et al., 2015; Fuchs and Wößmann, 2007; Gould et al., 2009; Hanushek and Luque, 2003; Hanushek et al., 2009; Hanushek et al., 2013; Hanushek and Wößmann, 2017; Jensen and Rasmussen, 2011; Rangvid, 2007; Wößmann, 2003.
has often been transformed into socio-economic status which followingly was decomposed into parental education and occupation, and home possessions. School variables were usually trans-lated into inputs such as teacher quality, student-teacher ratio, availability of information and com-munication technology (ICT) resources, and others. Some authors also included variables for institutional setting (e.g. Wößmann, 2003) such as school autonomy, examination methods and decision-making processes to explain the variation in student achievement. However, evidence of institutional effects on educational performance is scarce and is more relevant when comparing institutional differences between countries (Fuchs and Wößmann, 2007; Hanushek et al., 2013; Wößmann, 2016).
Others have investigated student performance gaps, like Rangvid (2007), who used a data-set from a replicate PISA study for Copenhagen schools and analysed the test score gaps between native and immigrant students in Denmark by entering immigrant status as a dummy variable. Jensen and Rasmussen (2011) combined the PISA 2000 data for Denmark with another special Danish PISA study from 2005, and used an instrumental variable for immigrant concentration in school to identify causal effects on student outcomes, while Ohinata and van Ours (2013) used data from previous PIRLS and TIMMS studies for the Netherlands to identify spill-over effects by using the percentage of first-generation immigrants students in each class. Schnepf (2007) used data from TIMMS (1995 and 1999), PIRLS (2001) and PISA (2003) and researched immigrants’ educational disadvantage through several models, conditional on 1) language at home, 2) socio-economic background, and 3) school segregation.
Decomposition methods, such as the Blinder-Oaxaca (Blinder, 1973; Oaxaca, 1973) or the John-Murphy-Pierce method (Juhn et al., 1993), has allowed researchers to analyse how much differ-ent educational factors explain test score gaps. Several researchers have employed decomposition methods to the PISA data to explain test score gaps between ethnic groups (Ammermueller, 2007a; Ammermueller, 2007b). Martins and Veiga (2010) used the PISA 2003 data and exercised three different decompositions to assess how socio-economic factors related inequality in mathematics achievement among 15 EU countries. Finally, Lounkaew (2013) used the Oaxaca-Blinder method on the PISA 2009 data to analyse educational achievement between urban and rural groups in Thailand.
2.3 Efficiency and costs
Costs related to various educational inputs and their efficiency are not researched in this thesis. However, these are important considerations for policy-makers and should be addressed together with the topics covered above. In general, Nordic countries are characterised by relatively high levels of expenditure on education and Bogetoft et al. (2015) calculated input efficiency scores for these countries. They found Finland to be the most efficient country, while Norway was found quite insufficient. Verhoeven et al. (2007) researched efficiency of education in the G7 countries and found that inefficiency was caused by lower student-teacher ratios, higher wage spending, and resource procurement, while greater autonomy seemed to raise efficiency. Afonso and St. Aubyn (2006) researched the education expenditure efficiency by comparing the PISA 2003 results with resources employed. Norway was originally ranked as the 16th most efficient country of the total 25 OECD countries included in the analysis, but as the most inefficient country when adjusting for GDP and educational attainment. Note that efficiency scores were only based on actual resources employed and should be considered with their respective impact on student achievement.
3 Hypothesis
I want with this dissertation address important aspects of education dynamics for Norwegian stu-dents, in particular, native and immigrant stustu-dents, using the data for PISA 2015. The assessment tests 15-year-old students in their ability to solve complex problems and concepts and covers three major domains: science, math, and reading. In addition to student performance and test scores, the rich PISA data has information about student background and school characteristics.
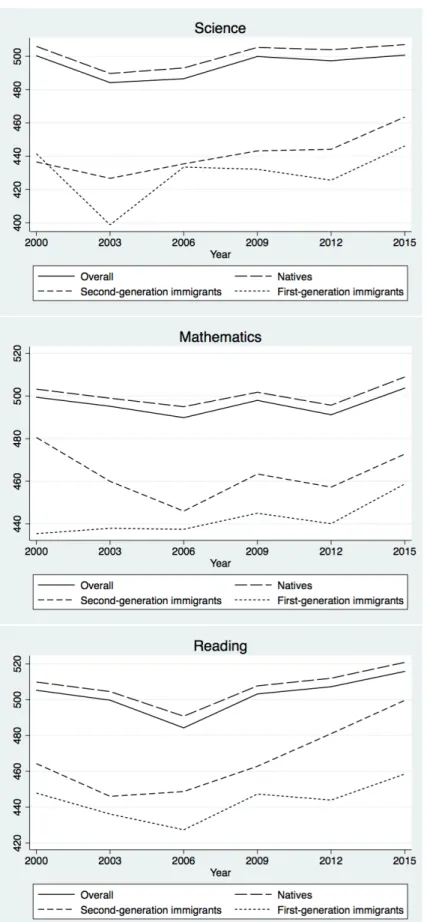
The following figure (figure 3.1) shows how native and immigrant students have performed on PISA from 2000 to 2015 in Norway8. The graphs show that student achievement have steadily in-creased during the last assessments. However, despite having an overall increase in student achieve-ment across all groups, differences between native students and both immigrant categories persist and remain significantly big. This is an important consideration for Norwegian student achievement and I will in this dissertation try to answer the following questions:
Q1: Which factors are important for student achievement in Norway?
Q2: Which factors are important for explaining differences in achievement between native and immigrant students?
The first question was naturally chosen to provide insights about the different factors and edu-cational inputs that were important for Norwegian students. Not only is this important for the Norwegian education system, but it may also serve as indicators on which inputs other countries should emphasise in their respective education systems. This information is also important for the second question which was motivated by the three graphs, in figure 3.1, that shows a gap between native and immigrant students from 2000-2015, and thus, intends to find explanations for the test score gap between native and immigrant students. This may be due to different endowments or returns to the educational inputs found in the first question.
Thus, the final aim of this dissertation is to explain student achievement in Norway, and then use these findings to find policies that both can increase student achievement while reducing the achievement gap between native and immigrant students.
8The data was obtained from OECD, available athttp://www.oecd.org/pisa/data/. Mean test scores were
These questions will be elaborated through the available information from the student and school questionnaire. Variables were grouped into four categories: 1) descriptive variables, 2) student variables, 3) parent variables, and 4) school variables. The two research questions above will be answered as best can by employing the following methods:
• Descriptive statistics: Investigating how the students among the different ethnic groups are endowed within the four variable groups, and use these variables to find explanatory relations. • T-tests: Mean score differences across, and between, ethnic groups are researched by sepa-rating each subgroup by a characteristic. A t-test, with null-hypothesis, that the difference is equal to zero, was employed. This allowed me to see the unconditional effects of particular characteristics.
• Educational production functions: Using the explanatory variables to estimate multivariate regression models that include native, first- and second-generation immigrant students to analyse the effects of various educational inputs variables on student achievement.
• Blinder-Oaxaca decomposition method: Analyse the test score gap between native and im-migrant students by group means to see how differences in characteristics and returns to the educational inputs affected student achievement, and followingly, the total test score gap. These methods intend to find the determinants of student achievement and gaps between natives and immigrants. Descriptive statistics allowed me to see how the Norwegian sample, and its sub-groups, were endowed with a wide set of variables. The t-tests provided unconditioned indications on how various variables affected student achievement, both across and between the ethnic groups. Moreover, given the endowments found, the educational production functions allowed me to see how the various educational inputs affected student achievement. This, together with plausible differences in endowments, permitted me to do a rigorous comparison between the natives and immigrants. Lastly, the decomposition method was employed to consolidate the results obtained in the two previous methods, as it allowed me to see how the test score gap between natives and immigrants was decomposed into three effects: 1) characteristics effect, 2) return effect and 3) in-teraction effect. The first effect allowed me to see how immigrants, given their estimated returns, would perform if they had the same endowments as natives, while the return effect allowed me to see how immigrants, given their endowments, would perform if they experienced the same returns as natives. The latter effect accounted for differences that existed simultaneously in both
endow-ments and returns. A two-fold decomposition also allowed to me to see how the different predictors helped explaining the differences between the ethnic groups.
Several hypotheses were developed for both research questions. The four following main hy-potheses, one for each of the variable groups, was developed for the first research question:
1a. Descriptive variables:
H1a: "Demographic differences, i.e. descriptive variables such as gender, community size, and school size, are expected to only have a small impact on student achievement, while language spoken at home, and specifically speaking Norwegian at home, is expected to be conducive for student achievement."
Norway is recognised for its egalitarian principles as well as being a socially developed country. Demographic differences, such as gender, community size, and school size are therefore expected to be rather insignificant for educational quality. Meanwhile, speaking the local language of a country can generally be assumed conducive for achievement purposes in the respective country.
1b. Student variables:
H1b: "Student-related variables are expected to have a significant impact on student achieve-ment. Socio-economic status, study time outside of class and student motivation are expected to be particularly positive on the students’ test scores."
Socio-economic status is frequently confirmed as an important determinant for student achieve-ment (OECD, 2018; Perry and McConney, 2010; Schnepf, 2007). Study time should also be positively associated with the students’ performance on PISA as it should increase the knowl-edge of the students. Student motivation, which in this dissertation is measured through educational expectation, occupational expectation, ambition/competitiveness and no absen-teeism are expected to be conducive factors that enhances the students’ performance.
1c. Parent variables:
H1c: "Parental education and occupation are expected to have a significant positive impact on student achievement."
Parental status, in terms of education and occupation, is normally integrated into socio-economic status, and thus, is expected to be positive for student achievement. Furthermore, Jargowsky (2009) argued that parental status was an important determinant on where
fami-lies settled, and as students often are enrolled in schools close to their neighbourhoods, it can also be expected to affect the peer composition of their children(s) school and class. Another positive impact can be that parents with higher education and/or occupation emphasise their children’s education and achievement more than parents with lower levels.
1d. School variables:
H1d: "The school variables are expected to have marginal effects on student achievement." The PISA 2015 study only included variables related to its sample. However, student achieve-ment should ideally be considered as a result of both previous and current inputs, but due to lack of historical data, a contemporaneous approach was implemented. The included school variables (e.g. staff capacity and learning environment) should be considered time-invariant as changes in these type of variables often occur gradually, rather than radically. Additionally, Norwegian schools were predominantly public and had little autonomy, which consolidates this dynamic. This implies that the current school variables should only have a marginal effect on student achievement. Jerrim et al. (2017) and Todd and Wolpin (2003) also high-lighted this particular limitation on the PISA data in their research.
Not only student achievement is studied in this dissertation, but also the achievement gap between native and immigrant students. The characteristic effect and return effect was used to explain the differences in achievement and the following main hypotheses were considered for the second research question:
2a. Characteristic effect:
H2a1: "The endowments of language at home, and student and parent variables are expected to explain differences between native and immigrant students, particularly socio-economic status."
Empirical work suggests that language barriers and socio-economic differences are important factors to explain immigrants students’ underachievement (Ammermueller, 2007b; OECD, 2018; Schnepf, 2007). Thus, it can be expected that in Norway, as in other countries, that immigrants face language barriers and socio-economic disadvantage.
H2a2: "The endowments of descriptive and school variables, except language at home, are not expected to explain differences between native and immigrant students."
World’s Happiest Country". Meanwhile, it is experiencing positive rankings on various in-equality measures, like the Gini-coefficient (FRED, OECD, and World Bank) and Migrant Integration Policy Index (MIPEX)9. Additionally, schools are primarily public, and thus, significant differences in endowments, and particularly adverse characteristics through de-scriptive and/or school variables, are not expected to explain differences between native and immigrant students.
2b. Return effect:
H2b1: "Native students are expected to have better returns than immigrant students."
Education can be interpreted as part of an integration process, and thus, given that native students are expected to be more familiar with the cultural and social processes in Norway, it can be expected that native students take better advantage of their resources than what immigrant students do.
The results obtained in this dissertation are compared towards these hypotheses in section 6.4.
9See (https://fred.stlouisfed.org/series/SIPOVGININOR), (
http://www.oecd.org/social/income-distribution-database.htm) and (https://data.worldbank.org/indicator/SI.POV.GINI?locations=NO) and
4 Data
The OECD Programme for International Student Assessment (PISA) 2015 aims to measure how 15-year-old students are prepared to meet the challenges of today’s society10. PISA assesses not
only whether students can reproduce knowledge, but also their ability to apply knowledge in new situations, as it emphasises problem-solving skills, concept understanding, and autonomy. It is a triennial survey, with its first assessment completed in 2000, where each study have focused on one of the major domains: science, reading or mathematics11. In 2015 (and 2006) the main focus
was science. PISA data ranging back to 2000 is publicly available at OECD’s website, where also technical reports, data manuals, and other official documentation can be downloaded12.
PISA 2015 was conducted in 35 OECD countries plus 37 partner countries and economies with approximately a total of 540 000 completed assessments. The 2015 assessment was the first time computer-based tests were implemented as the main mode and paper-based alternatives were only used in cases of inadequate ICT resources13. All assessments in Norway were done by computer.
Test items were a mixture of multiple-choice items and questions requiring students to construct their own responses. Test scores were standardized with an international mean of 500 and standard deviation of 100. Additional information was obtained through 1) a student questionnaire with various background information about each student (e.g. family, home and school), and 2) a school questionnaire, responded by the school principals, collecting information about organisational and educational characteristics of each school.
4.1 PISA design
Test items were thoroughly developed before being included in the final PISA assessment. The PISA 2015 tests were based on a variant of matrix sampling which implied the use of different item
10Further information about PISA 2015, such as achievement goals, development methods, and
un-derlying theory, is available at
http://www.oecd.org/edu/pisa-2015-assessment-and-analytical-framework-9789264281820-en.htm.
11A detailed and complete description of the implementation of the PISA surveys can be found in the
technical reports. For PISA 2015, it is available athttp://www.oecd.org/pisa/data/2015-technical-report/.
12Available athttp://www.oecd.org/pisa/data/.
13A mode effect study was conducted to evaluate the reliability between computer- and paper-based
as-sessments. Item parameters were found consistent across countries and time. Moreover, a high correlation (0,94) was found between the item parameters from the two different modes (OECD, 2017).
sets and assessment modes as each student were given a subset of items from the total item pool. The complete set of items were organised into different, linked test forms where each student was assigned one booklet. A student was only considered a respondent when answering at least half of the test items given. The test forms were therefore kept relatively short to minimise the students’ response burden and thus to prevent fatigue. Furtherly, OECD (2017) argue that the implementation of this particular test form construct also was important since PISA neither provided feedback nor consequences for the test takers. Lastly, decreasing the necessity of school resources by limiting the test forms could eventually also lead to a higher acceptance rate at the school level.
Sampling design
A two-stage stratified sampling technique was employed for drawing the student sample14. The target population consisted of 15-year-old students attending educational institutions in seventh grade or higher. This definition was slightly adapted to fit the age structure better and implied that the international target population was defined as all students between 15 years and 3 completed months to 16 years and 2 completed months at the assessment’s beginning. A variation of up to one month was permitted.
The first-stage sampling unit, schools, were sampled systematically from a national list of all the PISA-eligible schools with probabilities proportional to their respective size. This sampling methodology is referred to as probability proportional to size (PPS) sampling and a school’s student enrolment was used as size. PPS was employed since schools were expected to differ in size as urban areas could be expected to have higher enrolment numbers than rural areas. The second-stage sampling unit were students within the sampled schools. A target cluster size was employed and implied that a set number of PISA-eligible students, 42 for computer-based assessments and 35 for paper-based, were randomly selected. Additionally, each student was assigned a weight that was defined by the reciprocal of the student’s sample selection probability.
Some quality standards were employed to ensure an accurate and convenient coverage of the target population. Eligibility standards and principles of exclusion were consistently applied to both schools and students. Exclusions could either take place at school level or within-school level (individual students), and the overall exclusion rate for a country was required to be kept below 5%
of the target population. The specific restrictions that were employed can be found in OECD (2017), p. 67-70. Furthermore, to ensure accurate coverage of the target population, a minimum of 150 schools were selected from each country and a predetermined number of students, the target cluster size, was randomly selected within each school. If the number of students or schools available were smaller than the minimum requirement, all schools and/or students were selected. This implied a minimum sample size of 5 250 in computer-based countries (e.g. Norway) and 4 500 in paper-based countries. The whole population was sampled if the available sample was less than this size. Assessment structure
PISA 2015 employed a variant of matrix sampling which implied that students were assigned differ-ent subsets of items where only a few items overlapped. A studdiffer-ent’s number of correct responses was therefore inappropriate to represent its abilities. This was overcome by the implementation of item response theory (IRT) scaling which modelled regularities in the response patterns of the students to describe and estimate their performance and proficiency.
All the prior PISA cycles (2000-2012) used the Rasch model and the partial credit model (Mas-ters, 1982) to estimate item parameters. The Rasch model is a psychometric model that provides the probability that an individual responds correctly to a particular item, given its location on a reference dimension. A respondent’s answers depend on its ability,θ, and item difficulty,βi, and
the probability that an individual responds correctly to a particular item, xi=1, is defined as:
P(xi=1 |θ,βi) = exp(θ−βi)
1 + exp(θ−βi) (2)
The probability of a correct response is strictly decreasing inβ and increasing inθ. A special case, if θ =β, induces that the expected probability of a correct response is equal to 0,50. This implies that item difficulty can be interpreted as the ability level where the probability of a correct or incorrect response is equal. The partial credit model is an extension of the Rasch model and was used on polytomous items with more than two response categories. However, these models were criticised for their applicability in the PISA context (Goldstein, 2004; Kreiner and Christensen, 2014; Oliveri and von Davier, 2011).
Glas and Jehangir, 2014; Mislevy and Verhelst, 1990; von Davier and Carstensen, 2007) with the two previously used models. Two additional models were implemented: 1) the two-parameter logistic model (2PLM) (Birnbaum, 1968) for dichotomous scored responses (correct or incor-rect), and 2) the generalised partial credit model (Muraki, 1992) for items with more than two response categories. A combined Rasch model/partial credit model and two-parameter logistic model/generalised partial credit model was applied, and this new model was used for items that showed poor fit to the older model (OECD, 2017)15.
The 2PLM also assumes that the probability of a correct response depends on the difference between a respondent’s ability θ and item difficulty βi, but 2PML also allows for an additional
item discrimination parameter, αi, that characterises its sensitivity to proficiency (OECD, 2017).
As a function of these parameters, the probability of answering correct is defined as: P!xi=1 |θ,βi,αi"= exp
!
Dαi(θ−βi)"
1 + exp!Dαi(θ−βi" (3)
where D is a constant which often is presumed either 1,0 or 1,7 (OECD, 2017, p. 142). The same function applies forθ andβ as in the Rasch model, so a student with a higher ability is more likely to answer correctly, while more difficult items reduce the probability of a correct reponse16.
An important assumption that applies to these models is conditional independence which im-ply that the item response probabilities only depended on an individual’s ability, θ, and the item parameters, α andβ. Followingly, the 2PLM implicitly assumes unidimensionality, which means that it is only a student’s ability,θ, that accounts for performance across all items. Factors such as the survey conditions and dependence between item responses were therefore not considered. The
15Several model checks were applied to the new hybrid IRT model to ensure that it fitted the observed
data. The overall item fit was found satisfying for each domain with small numbers of items misfitting for science (3,9%), mathematics (1,8%) and reading (2,5%). These checks are furtherly elaborated in OECD (2017), chapter 9.
16The generalised partial credit model was used for items with more than two response categories. The
benefit of using that model was that it is applicable for items i with mi+1 ordered categories while it
appropriately reduced to the two-parameter-logistic model when applied to dichotomous responses. It is formulated as follows: P!xi=k | θ,βi,αi,di"= exp # ∑k r=0Dαi(θ −βi+dir)$ ∑mi u=0exp # ∑u r=0Dαi(θ −βi+dir)$ (4)
joint probability of a particular reponse pattern is in 2PLM, for n items (x = xi, ...,xn), defined as: P!x |θ,β,α"= n
∏
i=1 Pi(θ)xi(1 − Pi(θ))1−xi (5)where Pi(θ) is a function of a student’s ability, θ, that determines the probability of answering
correct (or incorrect) on any given item i. The response pattern can be replaced by the actual scored data which followingly transforms equation 5 into a likelihood function that is maximised with respect to the item parameters. This transformation implied that students were assumed to provide their answers independently and that the students’ abilities could be sampled from a distribution
f (θ)(OECD, 2017). For a total of J students, the likelihood function was characterised as: P!x |β,α"= J
∏
j=1 % & n∏
i=1 Pi(θ)xi j(1 − Pi(θ))1−xi j ' f (θ)d(θ) (6)The purpose of using this IRT scaling was to obtain the item parameter estimates forα andβ to facilitate the estimation of the students’ abilities,θ (OECD, 2017).
Plausible values
The PISA 2015 design did not directly provide comparable student scores because of the matrix sampling methodology, and thus, the students’ proficiency levels in the tested domains were un-observed. OECD employed a plausible value methodology to measure student achievement. A commonly used definition is:
"The simplest way to describe plausible values is to say that plausible values are a rep-resentation of the range of abilities that a student might reasonably have. [...] Instead of directly estimating a student’s ability,θ, a probability distribution for a student’sθ
is estimated. [...] Plausible values are random draws from this (estimated) distribution for a student’sθ." (Adams and Wu, 2002)17.
17Plausible values can be considered as the better alternative in resolving the uncertainty of the students’
unobserved proficiency values, θ. The variability among the plausible values is arguably a way to reflect the uncertainty of not observing a student’s ability. Furthermore, it is important to emphasise that plausi-ble values are not substitutes for the test scores of the students, but rather intermediary computations that incorporate their responses to the test items and background information (OECD, 2017).
OECD implemented a population model that first used the IRT model (derived in the previ-ous subsection) to estimate the item parameters that were followingly used in a latent regression model that incorporated the effects of the students’ backgrounds to obtain the students’ proficiency distributions18. Followingly, the population model incorporated both test responses and variables
answered through the student questionnaire. The estimation procedure was carried out as follows: 1. Item calibration: The students’ responses and scored values were used in the IRT model
de-rived in the previous section ("Assessment structure") to obtain the item parameter estimates (α andβ) for the test items.
2. Population modelling: The population model assumed that the item parameters obtained in step 1 were fixed. These estimates were employed in a latent regression model that fitted the data to obtain regression weights (Γ) and a residual variance-covariance matrix (Σ). An expectation-maximization algorithm (Mislevy, 1985) was employed to estimateΓ and Σ19.
3. Plausible value computation: 10 plausible values were drawn for all students using the esti-mated item parameters, Γ, and Σ (Little and Rubin, 2002; Schafer, 1997; von Davier et al., 2009).
The usage of all 10 plausible values is also communicated as the best estimate for a student’s ability because a more accurate and proper variability for the students’ performance is obtained when applying and repeating analyses on each of the 10 plausible values (OECD, 2017).
4.2 Data description
The 2015 PISA dataset for Norway originally contained 5456 observations/students spread over 239 schools. One school and 195 observations were dropped due to missing values for ethnic group status. The final data sample contained 5261 students. This was split between 2631 female and 2630 male students, and 4609 native students, 332 second-generation immigrant students, and 320 first-generation immigrant students. There was missing information about school type for 872 of the sampled students, but by the available data, 98,15% were enrolled in public schools, while
18The covariances between the skill domains (science, mathematics, and reading) were also used to
im-prove the accuracy of the estimated proficiency distributions.
1,85% were enrolled in a private school, which is close to the 2017 ratios presented in the litera-ture review. Each observation was assigned unique identifiers, student-id (cntstuid) and school-id (cntschid), and these were used to combine the datasets for the student and school questionnaire.
Educational levels are in this dissertation referred to by the International Standard Classification of Education (ISCED) 199720. The ISCED levels were classified through the following enumera-tion:
0) ISCED 0: None / Pre-primary education 1) ISCED 1: Primary education
2) ISCED 2: Lower secondary education
3) ISCED 3B or 3C: Vocational or pre-vocational upper secondary schooling
4) ISCED 3A and/or 4: General upper secondary and/or non-tertiary post-secondary schooling 5) ISCED 5B: Vocational tertiary education
6) ISCED 5A and/or 6: Theoretically oriented tertiary and/or post-graduate education
Occupational status in the PISA data was coded to four-digit ISCO codes and then mapped to the International Socio-Economic Index of occupational status (ISEI) (Ganzeboom et al., 1992). ISEI values were also used throughout this dissertation.
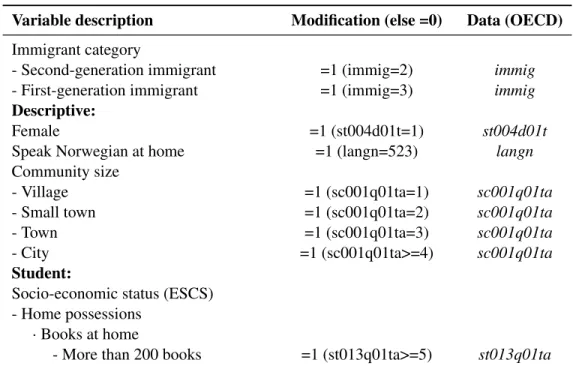
Table 4.1 summarizes all the original OECD variables that were used in this dissertation and includes variable descriptions, original variable name and description, descriptive statistics (min-imum and max(min-imum value, and the number of observations (N)), and belonging questionnaire (QST). All the variables that are starting with either stxxx (student questionnaire) or scxxx (school questionnaire) assume values that correspond directly with the alternatives in the respective ques-tionnaires.21 The other variables (e.g. immig, langn, and schsize) are specific OECD derived
variables22.
20The complete documentation and explanation of ISCED 1997 is available at
UN-ESCO, http://www.unesco.org/education/information/nfsunesco/doc/isced_1997.htm, and its sug-gested translation and equivalence to the Norwegian education system can be found at
http://gpseducation.oecd.org/Content/MapOfEducationSystem/NOR/NOR_1997_EN.pdf.
21The questionnaires can be downloaded athttp://www.oecd.org/pisa/data/2015database/.
22A complete description of the scaling procedures and construct validation of context questionnaire data
Table 4.1: V ariable description for all used variables, PISA 2015 Variable Data (OECD) Min Max Description N QST Test scor es: Science pv1scie-pv10scie 175 810 Quantitati ve 5261 STU Mathematics pv1math-pv10math 182 793 Quantitati ve 5261 STU Reading pv1r ead-pv10r ead 54 827 Quantitati ve 5261 STU Descripti ve: Ethnic group cate gory immig 13 Nati ve (1), 2nd-generation immigrant (2), 5261 STU and 1st-generation immigrant (3) Gender st004d01t 12 Female (1) and male (2) 5261 STU Language at home a langn 264 840 264 = Danish, 494 = Swedish, 523 = Norwe gian, 5259 STU 540 = Sami, and 840 = Other language Community size sc001q01ta 1 4 V illage: < 3 000 (1), small to wn: < 15 000 (2), 4659 SCH to wn: < 100 000 (3), and city: < 1 000 000 (4) School size sc hsize 28 925 Quantitati ve 4446 SCH Student: Socio-economic status (ESCS) b escs -6,60 3,57 Inde x 5231 STU -Home possessions homepos -8,75 5,14 Inde x 5260 STU · Cultural items cultposs -1,71 2,62 Inde x 5180 STU · Educational resources hedr es -4,37 1,18 Inde x 5250 STU · ICT resources ictr es -3,27 3,50 Inde x 5253 STU · W ealth items wealth -6,97 4,09 Inde x 5258 STU · Books at home st013q01ta 1 6 0-10 (1), 11-25 (2), 26-100 (3), 101-200 (4), 5226 STU 201-500 (5) and 500+ books (6) Study hours outside of class -Science st071q01na 0 30 Quantitati ve 4590 STU -Mathematics st071q02na 0 30 Quantitati ve 4611 STU Subjecti ve perceptions -Emotional support from parent(s) emosups -3,08 1,10 Inde x 5240 STU -Educational expectation st111q01ta 1 6 ISCED 2 (1), ISCED 3B/C (2), ISCED 3A (3), 5231 STU ISCED 4 (4), ISCED 5A (5), and ISCED 5A/6 (6)
Table 4.1 (continued ) Variable Data (OECD) Min Max Description N QST -Educational anxiety anxtest -2,51 2,55 Inde x 5234 STU -Ambition/competiti veness motivat -3,09 1,85 Inde x 5224 STU -Occupational expectation bsmj 16 89 Quantitati ve, ISEI scores 4260 STU -Student preference/characteristic · Prefer w orking as part of a team st082q01na 14 Strongly disagree (1), ..., strongly agree (4) 5205 STU · A good listener st082q02na 14 Strongly disagree (1), ..., strongly agree (4) 5195 STU · Enjo y seeing success of others st082q03na 14 Strongly disagree (1), ..., strongly agree (4) 5189 STU · Feel lik e an outsider st034q01ta 14 Strongly agree (1), ..., strongly disagree (4) 5210 STU · Feel lik e Ibelong at school st034q03ta 14 Strongly agree (1), ..., strongly disagree (4) 5176 STU Class skipped st062q02ta 14 Ne ver (1), 1-2 times (2), 3-4 times (3), and 5170 STU 5+ times (4) last tw o weeks Ate breakf ast before school st076q01na 1 2 Y es (1), no (2), on the most recent school day 5031 STU Par ent: Parents’ highest education hisced 06 ISCED 0 (0) -... -ISCED 6 (6) 5162 STU Mother’ s highest education misced 06 ISCED 0 (0) -... -ISCED 6 (6) 5136 STU Father’ s highest education fisced 06 ISCED 0 (0) -... -ISCED 6 (6) 5034 STU Parental occupational status -Mother bmmj1 12 89 Quantitati ve, ISEI scores 4736 STU -F ather bfmj2 12 89 Quantitati ve, ISEI scores 4650 STU School: Proportion certified teacher staf f pr oatce 01 Proportion 3904 SCH Class size clsize 13 33 Quantitati ve 4589 SCH Student-teacher ratio str atio 1,5 15,9 Quantitati ve 4212 SCH Class di vision by ability sc042q01ta 13 For all subjects (1), for some subjects (2), 4222 SCH and not for an y subjects (3) W ithin class-di vision by ability sc042q02ta 13 For all subjects (1), for some subjects (2), 4212 SCH and not for an y subjects (3) Report achie vement data publicly sc036q01ta 12 Y es (1), no (2) 4219 SCH School climate -Staf fcapacity hinders education staf fshort -1,68 1,51 Inde x 4418 SCH
Table 4.1 (continued ) Variable Data (OECD) Min Max Description N QST -Student beha viour hinders education stubeha -2,39 3,89 Inde x 4261 SCH -T eacher beha viour hinders education teac hbeha -2,12 2,77 Inde x 4261 SCH Inde x variables are increasing, and thus, higher values imply a better state of the respecti ve variable (e xcept for the sc hool climate variables which were opposite). a A codebook for country-specific variables is av ailable at http://www .oecd.or g/pisa/data/2015database/Codebook_CMB.xlsx . b Parental education and occupation are also variables that were inte grated into the escs construct.
The PISA dataset separates ethnic groups by the variable immig, and these groups were defined in OECD (2017) as 1) natives (students with at least one parent born in the country), 2) second-generation immigrants (those born in the country of assessment but whose parent(s) were born in another country), and 3) first-generation immigrants (both the student and parent(s) where born outside the country of assessment). These definitions were also used throughout this dissertation. Followingly, immigrant students are referred to as a joint category of these two immigrant cate-gories.
The PISA index of economic, social and cultural status (ESCS), hereinafter referred to as "socio-economic status (ESCS)", as in Table 4.1, is a composite score built up by household possessions, in addition to parental education and occupation (OECD, 2017, p. 339-342). These household possessions (homepos), which furtherly were decomposed into cultural items (cultposs), educa-tional resources (hedres), ICT resources (ictres) and wealth items (wealth), are all constructs made up by students responses on the availability of 16 different household items (ST011) and the re-ported amount of certain possessions and books at home (ST012, ST013)23. The intention of these
variables was to serve as proxies for family wealth.
The variables found under the category "Subjective perceptions" are grouped since the student responses were based on the student’s own emotions and perceptions. Care should therefore be considered when interpreting results related to the respective variables. A further elaboration of the indices for test anxiety (anxtest), student motivation (motivat), and emotional support (emosups) can be found in OECD (2017), p. 315 and 317. The answering format for the three variables, upon which the indices were constructed, was a four-point Likert scale.
The school variable, proportion certified teacher staff proatce, was obtained by dividing the number of fully certified teachers by the total number of teachers. Similarly, student-teacher ratio (stratio) was obtained by dividing enrolled students by the total number of teachers. The indices for school climate were built by several items where a principal responded his/her perception of staff quality and learning environments, and to what distinct these factors hindered educational purposes. The construction of these indices are furtherly elaborated in OECD (2017), p. 326-327. These were also reversed for analysis (see variable modifications in Table 5.1).
23See Table A.1 (in Annex A) for an overview of which specific items that OECD used to construct the
5 Methodology
This chapter elaborates the methods employed in this dissertation. The first section includes an explanation of the customised procedures used to acquire unbiased and consistent population es-timates. The last section goes into further detail on the model specifications, more specifically the assumptions and implications of using educational production functions, which (and where) variable modifications were employed, and an explanation of both the econometric model and de-composition method used in this dissertation. Simple t-tests were also used to obtain results in some sections of this dissertation.
5.1 Sampling variance
The PISA sample was acquired through a two-stage sampling method. As normal statistical pack-ages assume simple random sampling methods I needed to adjust statistical methods to account for this. Both OECD (2009) and OECD (2017) emphasise the importance of adjusting methodology due to the complexity of the sample design.
The PISA dataset clusters students by schools, and even though students were sampled randomly (with different sampling probabilities), survey weights were required to analyse the PISA data. These weights had to be incorporated to ensure that each student represented the correct number of students in the whole population. Furthermore, this corrected for the clustered data design which could have implied an interdependence between the error terms of students from the same schools. This methodology enables researchers to calculate appropriate sampling errors and to make valid population estimates and inferences (Jerrim et al., 2017; OECD, 2009; OECD, 2017). Some authors have been criticised for not properly adjusting methods to the complexity of the PISA sample and test design (Cattaneo et al., 2017; Lavy, 2015; Rivkin and Schiman, 2015). Furthermore, Jerrim et al. (2017) conducted a complete analysis of methodologies when using PISA data for empirical work and emphasised the importance of adjusting statistical methods due to the complex PISA sample. Todd and Wolpin (2003) also commented on this but discussed more technical specifications when using educational production functions.