Repositório ISCTE-IUL
Deposited in Repositório ISCTE-IUL:
2019-11-19
Deposited version:
Publisher Version
Peer-review status of attached file:
Peer-reviewed
Citation for published item:
Freitas, N. M. & Filipe, J. A. (2019). A note on the examination of Portugal’s hotels performance: a proposal for a new perspective’s approach . In Filiz Ersoz (Ed.), 1st International Data Science & Engineering Proceedings & Abstract Book (IDSES’19). (pp. 59-67). Karabuk: Karabük University Publishing.
Further information on publisher's website:
http://www.idses.org/Home/GetProceedingBook
Publisher's copyright statement:
This is the peer reviewed version of the following article: Freitas, N. M. & Filipe, J. A. (2019). A note on the examination of Portugal’s hotels performance: a proposal for a new perspective’s approach . In Filiz Ersoz (Ed.), 1st International Data Science & Engineering Proceedings & Abstract Book (IDSES’19). (pp. 59-67). Karabuk: Karabük University Publishing.. This article may be used for non-commercial purposes in accordance with the Publisher's Terms and Conditions for self-archiving.
Use policy
Creative Commons CC BY 4.0
The full-text may be used and/or reproduced, and given to third parties in any format or medium, without prior permission or charge, for personal research or study, educational, or not-for-profit purposes provided that:
• a full bibliographic reference is made to the original source • a link is made to the metadata record in the Repository • the full-text is not changed in any way
The full-text must not be sold in any format or medium without the formal permission of the copyright holders.
Serviços de Informação e Documentação, Instituto Universitário de Lisboa (ISCTE-IUL) Av. das Forças Armadas, Edifício II, 1649-026 Lisboa Portugal
Phone: +(351) 217 903 024 | e-mail: [email protected] https://repositorio.iscte-iul.pt
58
A Note on the Examination of Portugal’s Hotels Performance - a Proposal for a New Perspective’s Approach
Nuno Mendes FREITAS, José António FILIPE
Information Sciences, Technologies and Architecture Research Center Instituto Universitário de Lisboa, PORTUGAL
Abstract: The main objective of the present research paper is to give an exploratory vision on
a new form of examining hotels’ performance of the Portuguese hotels’ market. This approach is based on the experience of a consultant in this area and is made in terms of revenue and occupancy, crossing then operational data with financial results. This analysis focuses on a recent period, since 2010 to 2017, involving the years since before and until after the big boom of tourism in Portugal. This paper exposes available data about hotels operational results and compares these results with hotels financial results. In terms of the evaluation of a hotel’s performance, the revenue per available room (RevPAR) is regarded by the tourism industry and INE (the Portuguese National Statistics Institute) as the most important measure, once it compares hotels among themselves and also compares regions. An important aspect of this study is highlighting the limitations of RevPAR.
Keywords: Revpar, Financial Results, Hotels Performance
INTRODUCTION
The present study is based on the operational and financial data available for the period between 2010 and 2017 regarding to Portuguese hospitality. For several decades, the lodging industry has used RevPAR (revenue per available room) as a key indicator to evaluate a firm’s performance and to make investment decisions [1]. RevPAR is one of the most recognized and used performance measures in the hospitality industry, providing general market trends and some revenue indications. There are some pitfalls to be aware of when analyzing a hotel’s performance based solely on RevPAR [2]. RevPAR only measures revenues; it ignores expenses and does not capture or report profitability. Thus, RevPAR is a rather limited measure for measuring the hotel’s performance [3]. This indicator is calculated by dividing a hotel’s net room revenue (considered after discount and sales taxes and net of breakfast and other meals)
59
by the total number of available rooms and by multiplying a hotel’s average daily room rate (ADR) by its occupancy [2].
Hotels, with significant revenue-generating departments rather than the rooms division, by focusing only on room revenue do not provide a complete or accurate picture of the entire hotel property’s performance [3].
For the analysis of the hotel’s performance, other complementary metrics should be used to measure the financial performance, by crossing the financial result with the number of occupied rooms or available rooms. This will allow hotel decision makers to take into account the costs of the operation in the creation of the room price, and to realize how their operating decisions and cost structure reflect the net revenue. RevPAR is an important indicator when comparing the hotel performance with the one of competitors and with the market. Anyway, it is not the best indicator to analyze the operational performance of hotel units. A greater value in the RevP AR to the market or competition is not necessarily a sign that the hotel is performing better than the others, as each hotel company has different operating structures with different costs.
A. The calculation of RevPAR
Rooms’ revenue per available room (RevPAR) measures the rooms’ revenue yield that a property achieves in terms of the rooms available in the property for a given period. It includes the influence of occupancy and ADR.
RevPAR is calculated as follows:
RevPAR = Total Rooms Revenue / Number of Rooms Available
The number of rooms available or the number of the rooms’ nights available is based on the calculations of weighted average number of bedrooms in the hotel, multiplied by the total number of nights in the period under the analysis.
Total rooms revenue is the number of rooms’ nights sold in the period of analysis.
B. The Portuguese Tourism and Hotels Market
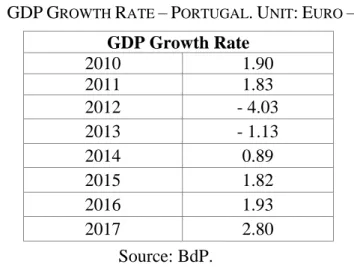
In this market, there was recently a recession in Portugal, involving the period between 2010 and 2014 most considerably, but having started with the global financial crisis in 2007-2008.
60
TABLE I. GDPGROWTH RATE –PORTUGAL.UNIT:EURO –MILLIONS GDP Growth Rate 2010 1.90 2011 1.83 2012 - 4.03 2013 - 1.13 2014 0.89 2015 1.82 2016 1.93 2017 2.80 Source: BdP.
In recent years, Portugal had a significant growth in terms of tourism. In 2017, 12.7 million tourists visited Portugal, representing 3.4 billion euros in terms of hotels’ revenues. Tourism is one Portuguese key sector, having a great importance for the Portuguese economy with a relative weight of 13.17 % in Portuguese GDP in 2017. The number of accommodations in Portugal, according to the National Statistics Institute (INE), is 5840 in 2017.
TABLE II. Travel and Tourism Account as a PERCENTAGE of GDP. Unit: Euro - Millions
Year % of GDP 2010 6.31 2011 7.16 2012 7.78 2013 8.78 2014 10.10 2015 10.75 2016 11.57 2017 13.17 Source: INE. LITERATURE REVIEW
Many observers, particularly those in the financial community, view the hospitality industry generally as being a risky business for owners and investors. This vision can be explained by considering much of the investments risk stems in the fundamentals of this business, namely, room-rate and occupancy fluctuations [4]. Several research papers in the literature show the importance of RevPAR as a financial performance indicator ([5]. Higgins interviewed industry
61
analysts and managers, regarding the importance of RevPAR [6]. These interviews indicated RevPAR as the most widely used measure, internally and externally, for hotels performance analysis and accepted by lodging firms as a benchmark. A limited amount of research discussed and investigated the relationship between the lodging firm performance and RevPAR [7]. . Brown and Dev highlighted two key limitations of RevPAR: it does not include revenue from food and beverage and other departments; and it does not take into account costs that are incurred to provide the requisite service level (e.g., special amenities such as a spa or additional guest-service employees such as a concierge) [8].
Gross Operating Profit per Available Room (GOPPAR) has become popular as an important alternative performance measure because it resolves limitations of RevPAR [9]. It provides a deep indication of a hotel’s profitability by taking into consideration management control and efficiency, and eliminating, to a certain extent, the potential advantage of a small hotel on this analysis.
In addition, GOPPAR offers an overall more robust performance measure, especially when comparing the financial performances of hotels with different sizes or in different markets [2].
One of the issues in lodging finance is the ratio of debt to equity [10]. According to [11], the hospitality industry is traditionally confronted with a high need for financial capital to invest in fixed assets such as land, building, and equipment, and since debt is relatively cheaper than equity, it has been widely used as a source of capital to fund investments.
METHODOLOGY a. The Study
The analysis of data in this study has two stages. First, the study is conducted considering the hospitality statistical data issued by the Portuguese National Statistics Institute. The number of occupied rooms and available rooms is calculated and then RevPAR and ADR from 2010 to 2017 are also calculated.
Second, financial reports of available data, assessed from the Central balance sheet database of the Portuguese Central Bank (Banco de Portugal), are used as the relevant financial information
62
for the examination of the perspective of financial performance per available room and per occupied room.
b. The Data Collection
The study collected data from two main sources.
Financial data are collected from the Portuguese CAE 551 – Hotels and similar accommodations.
The operational data from INE statistics used in this study are the tourism statistics, having been this information collected by INE, from a survey in hotels and other similar establishments.
c. Corporate performance measures
Return on assets (ROA) is the net income divided by total assets. It reflects the ability of a firms’ management to generate profits from firms’ assets. Hotel managers have to ensure great profits in order to cover the high assets costs and the related fixed costs. These profits have to be coherent with hotel investments. The ROA is retained to evaluate hotel profits enclosing all provided services and activities.
ROA = (Net Income/ Total assets) X 100
Return on equity (ROE) is used to measure profitability of companies, and is the net income divided by total equity, measuring the firm efficiency to generate profits from shareholders investment. The company’s objective is the maximization of shareholder’s value to have an optimum mix of debt and equity without compromising ROE.
ROE = (Net Income / Total equity) X 100
DATA ANALYSIS
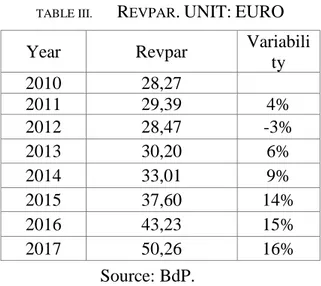
RevPAR variability is measured by the mean of the absolute values of the annual changes in RevPAR. Table III presents the mean of the annual measures during the period from 2010 to 2017. It is noted that the RevPAR variability is growing during the period between 2012 to 2017.
63
TABLE III. REVPAR.UNIT:EURO
Year Revpar Variabili ty 2010 28,27 2011 29,39 4% 2012 28,47 -3% 2013 30,20 6% 2014 33,01 9% 2015 37,60 14% 2016 43,23 15% 2017 50,26 16% Source: BdP.
When analyzing the ROA, we verify that it is inconsistent over the years under analysis, comparatively to RevPAR that had a slight decrease from 2011 to 2012 and returned to a constant growth from 2012 to 2017.
Assets grew during the years under analysis, and the negative variation was verified in net income.
TABLE IV. ROA
Year ROA Variabili
ty 2010 2.35% 2011 0,89% -62% 2012 0,50% -44% 2013 1,87% 274% 2014 3,27% 75% 2015 5,15% 57% 2016 5,38% 4% 2017 7,34% 36% Source: BdP
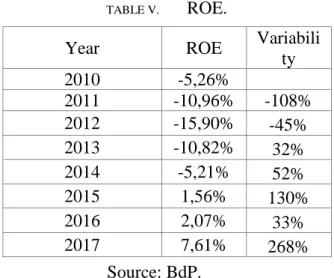
From 2010 to 2104, ROE has always had a negative value, due to the Net results of hotel companies. Comparing to RevPAR, the variability is not constant. RevPAR shows a growth between 2013 and 2017; ROE only grows in 2016 and 2017.
64
TABLE V. ROE.
Year ROE Variabili
ty 2010 -5,26% 2011 -10,96% -108% 2012 -15,90% -45% 2013 -10,82% 32% 2014 -5,21% 52% 2015 1,56% 130% 2016 2,07% 33% 2017 7,61% 268% Source: BdP.
When analyzing EBITDA or Net Income per occupied room, we observe that Revpar grew from 2012 to 2017 and had a constant positive variation. However, we do not observe the same trend when analyzing the values presented in Table VI and table VII.
TABLE VI. EBITDA PER OCCUPIED ROOM.UNIT:EURO
Year EBITD A Variabi lity 2010 12,59 2011 4,90 -61% 2012 2,84 -42% 2013 10,45 268% 2014 16,65 59% 2015 24,57 48% 2016 25,39 3% 2017 33,84 33% Sources: BdP.
TABLE VII. NET INCOME PER OCCUPIED ROOM.UNIT:EURO
Year Net Income Variabi lity 2010 -9,76 2011 -17,61 -80% 2012 -22,95 -30% 2013 -14,71 36% 2014 -6,80 54% 2015 2,11 131% 2016 3,07€ 45%
65 Year Net Income Variabi lity 2010 -9,76 2011 -17,61 -80% 2017 11,56 277% Sources: BdP.
DISCUSSION, CONCLUSION AND LIMITATIONS
We can verify that complementary ratios should be used to achieve and control financial results. The used ratios do not measure financial costs, only the operational costs of the hotel.
Another strand for the analysis is related to the capital structure used in hotels. Investments are made using financing, being the financial autonomy always below 30% and for that reason, in some years, the net income was negative. The use of the net income per available room can be a starting point to measure the financial performance.
RevPAR is the dominant, and currently, the most used and accepted measure by tourism and hotels, and, considering that, it is possible to understand how important is to search for alternative performance measures.
REFERENCES
[1] J. Chen, Y. Koh, And S. Lee, “Does The Market Care About Revpar? A Case Study Of Five Large U.S. Lodging Chains,” Journal Of Hospitality And Tourism Research, Vol. 35, No. 2, 2011.
[2] E. Younes And R. Kett, “GOPPAR, A Derivative Of Revpar,” HVS International, No. March, 2003.
[3] S. Lee, B. Pan, And S. Park, “Revpar Vs. GOPPAR: Property- And Firm-Level Analysis,” Annals Of Tourism Research, Vol. 76, No. September 2018, 2019.
[4] J. A. Ismail, M. C. Dalbor, And J. E. Mills, “Using Revpar To Analyze Variability,” Vol. 24, No. 4, 2002.
[5] M. Gallagher And A. Mansour, “Analysis of Hotel Real Estate Market Dinamics.” American Real Estate Society, 2000.
[6] S. M. Higgins, “Revpar Still King, But GOPPAR on The Rise,” Hotel & Motel Management, Vol. 221, No. 1, 2006.
66
[7] A. R. Elgonemy, “The Pricing Of Lodging Stocks: Reality Check.” Cornell Hotel And Restaurant Administration Quarterly, 2000.
[8] J. R. Brown And C. S. Dev, “Looking Beyond Revpar: Productivity Consequences of Hotel Strategies,” Cornell Hospitality Quarterly, Vol. 40, No. 2, 1999.
[9] S. Lee, B. Pan, And S. Park, “Revpar Vs. GOPPAR: Property- And Firm-Level Analysis,” Annals Of Tourism Research, Vol. 76, No. September 2018, 2019.
[10] A. R. Elgonemy, “Debt-Financing Alternatives,” No. June, 2002.
[11] Y. Li And M. Singal, “Capital Structure İn The Hospitality İndustry: The Role of The Asset-Light And Fee-Oriented Strategy,” Tourism Management, Vol. 70, No. August 2018, 2019.
[12] BP STATS – Banco De Portugal 2010 To 2017, Lisboa. [13] INE Instituto Nacional De Estatística 2010 To 2017, Lisboa.