Cecília Carlos Leite Duarte
Janeiro de 2012
Escola de Ciências
UMinho|20
12
Cecília Carlos Leit
e Duar
te
Oleanolic acid but not ursolic acid induces
cell death in HepG2 cells under
starvation-induced autophagy
Oleanolic acid but not ur
solic acid induces cell deat
h in HepG2 cells under st
ar
Cecília Carlos Leite Duarte
Janeiro de 2012
Universidade do Minho
Escola de Ciências
Trabalho efetuado sob a orientação do
Professor Doutor Cristóvão Lima
e co-orientação da
Professora Doutora Cristina Pereira-Wilson
Dissertação de Mestrado
Mestrado em Genética Molecular
Oleanolic acid but not ursolic acid induces
cell death in HepG2 cells under
Nome: Cecília Carlos Leite Duarte
Endereço electrónico: [email protected] Telefone: 964290759 Número do Cartão de Cidadão: 13244342 2ZZ6
Título da dissertação:
Oleanolic acid but not ursolic acid induces cell death in HepG2 cells under starvation-induced autophagy.
Orientadores: Doutor Cristóvão Lima
Doutora Cristina Pereira-Wilson Ano de conclusão: 2012 Designação do Mestrado: Mestrado em Genética Molecular
É AUTORIZADA A REPRODUÇÃO INTEGRAL DESTA TESE APENAS PARA EFEITOS DE INVESTIGAÇÃO, MEDIANTE DECLARAÇÃO ESCRITA DO INTERESSADO, QUE A TAL SE COMPROMETE;
Universidade do Minho, ___/___/______
iii
Acknowledgements
Acknowledgements
Acknowledgements
Acknowledgements
“…All our science, measured against reality, is primitive and childlike - and yet, it is the most
precious thing we have.”
Albert Einstein
First of all, I would like to thank Dr. Cristóvão Lima, my main supervisor, for giving me the opportunity to do my master’s with him. For his availability, dedication, interest and privilege to share of his scientific knowledge with me, I am sincerely thankful.
I would like to thanks Dr. Cristina Pereira-Wilson, my co-supervisor, for her support, and constructive suggestions for the accomplishment of the work presented in this thesis.
To Cristina Carvalho, Dalila, Cristina Xavier, Carla, Alice, Ana, Vera and Carolina, for the conversations and great working environment in lab. Thank you for accepting me so well.
To all my friends and my university colleagues. Thank you for the good moments, for your sincerity and friendship.
To my family, a very special thanks for their care and support. To my parents for giving me the chance to get where I am, and for believing in me.
iv
v
Oleanolic acid but not ursolic acid induces Oleanolic acid but not ursolic acid induces Oleanolic acid but not ursolic acid induces
Oleanolic acid but not ursolic acid induces cell death in HepG2 cells under starvationcell death in HepG2 cells under starvationcell death in HepG2 cells under starvation----induced cell death in HepG2 cells under starvationinduced induced induced autophagy autophagy autophagy autophagy Abstract Abstract Abstract Abstract
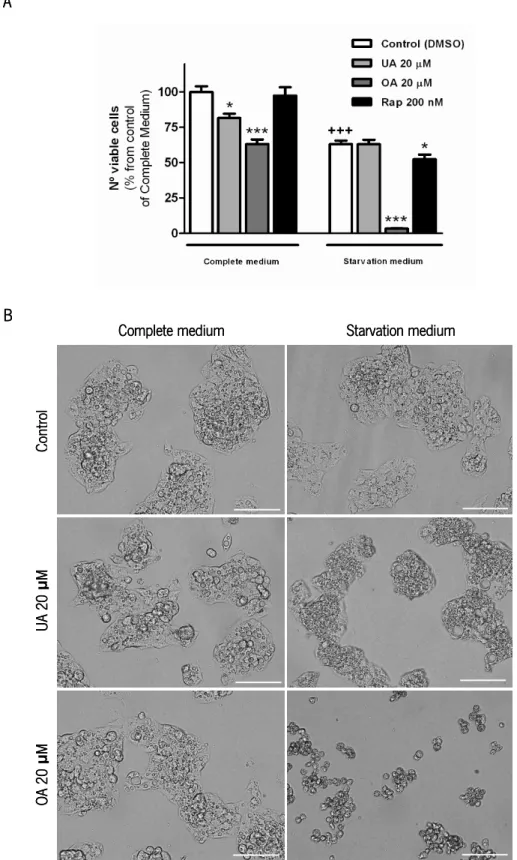
Cancer incidence is increasing worldwide mainly due to changes in diet, life style and increased lifespan. In particular, liver cancer is the fifth most common cancer in the world and the third most common cause of cancer mortality. Plant phytochemicals are a good and promising source of anticancer compounds. In a previous study, we reported the potential of ursolic acid (UA) to induce cell death and to inhibit proliferation in colorectal cancer cells. This natural triterpenoid, UA, was also shown to activate JNK and to modulate molecular markers of autophagy. In the present study, the ability of two isomer triterpenoids, UA and oleanolic acid (OA), to induce cell death and modulate autophagy in the human hepatocellular carcinoma cell line (HepG2 cells) was tested. For that, the effect of these phytochemicals on cell death was evaluated by MTT assay and propidium iodide staining, in complete and starvation medium. Autophagy markers were evaluated by western blot and fluorescence microscopy. Contrary to our previous data with other cell lines, HepG2 cells were less susceptible to UA and, unexpectedly, OA was a more potent inducer of cell death than UA. Interestingly, starvation-induced autophagy sensitized HepG2 cells to cell death caused by OA, but not by UA. The IC50 of OA decreased from about 50 µM in complete medium to 3.5 µM in starvation medium. Although UA and OA increased the levels of autophagy markers LC3 and p62, as well as the number of acidic vacuoles (as assessed by MDC staining), the cell death induced by OA was not prevented by inhibitors of autophagy and of lysosome proteases. Overall, the results seem to indicate that autophagy is not directly involved in cell death induced by OA. Interestingly, methyl-β-cyclodextrin (a polymer able to decrease membrane cholesterol content) prevented OA-induced cell death, which indicates that disruption of cholesterol homeostasis, and in particular in lipid rafts, may be involved in OA effects under starvation conditions. The present results suggest the application of OA as a specific drug for cancer treatment in particular cell physiological conditions, such as under metabolic stress.
vii
Potencial efeito anticancerígeno do ácido oleanólico e do ácido ursólico em célu Potencial efeito anticancerígeno do ácido oleanólico e do ácido ursólico em célu Potencial efeito anticancerígeno do ácido oleanólico e do ácido ursólico em célu
Potencial efeito anticancerígeno do ácido oleanólico e do ácido ursólico em células HepG2 slas HepG2 slas HepG2 slas HepG2 sob ob ob ob indução de autofagia
indução de autofagia indução de autofagia
indução de autofagia por privação de nutrientespor privação de nutrientespor privação de nutrientespor privação de nutrientes
Resumo Resumo Resumo Resumo
A incidência do cancro está a aumentar em todo o mundo principalmente devido a alterações da alimentação, do estilo de vida e do aumento da esperança média de vida. Em particular, o cancro do fígado é o quinto cancro mais comum no mundo e a terceira maior causa de morte por cancro. Os fitoquímicos são uma excelente e promissora fonte de compostos anticancerígenos. Num estudo anterior o nosso grupo descreveu o potencial do ácido ursólico (AU) na indução de morte e na inibição da proliferação de células do cancro coloretal. Este triterpenóide de origem natural foi também descrito como ativador da sinalização JNK e modulador de marcadores moleculares de autofagia. No presente trabalho foi testada a capacidade de dois isómeros triterpenóides, o AU e o ácido oleanólico (AO), em induzir morte celular e modular a autofagia numa linha celular do carcinoma hepatocelular humano (células HepG2). Para tal, o efeito destes fitoquímicos na morte celular foi avaliado pelo ensaio de MTT e pela marcação com o iodeto de propídio, tanto em meio completo como em meio com privação de nutrientes. Os marcadores de autofagia foram avaliados por western blot e também por microscopia de fluorescência. Contrariamente a resultados anteriores com outras linhas celulares, as células HepG2 foram menos suscetíveis ao AU, bem como o AO mostrou ser mais potente na indução de morte celular do que o AU. Além disso, a autofagia induzida pela privação de nutrientes suscetibilizou marcadamente as células HepG2 para a morte celular causada pelo AO, e tal já não se verificou com o AU. Nestas condições o IC50 do AO foi de 3,5 µM, enquanto em meio completo era de cerca de 50 µM. Embora, o AU e o AO aumentem os níveis dos marcadores autofágicos LC3 e p62, bem como o número de vacúolos acídicos (avaliado pela marcação com MDC), a morte celular induzida pelo AO não foi prevenida por inibidores de autofagia e nem por inibidores de proteases lisossomais. Em geral, os resultados parecerem indicar que a autofagia não está diretamente envolvida na morte celular induzida pelo AO. No entanto, um polímero capaz de diminuir o conteúdo de colesterol nas membranas celulares, a metil-β-ciclodextrina, preveniu a morte celular induzida pelo AO. Este resultado indica-nos que o AO pode induzir uma alteração na homeostasia do colesterol, em particular em domínios lipídicos ricos em colesterol, com efeitos drásticos sob a viabilidade das células quando estas estão sob privação de nutrientes. Estes resultados sugerem-nos que o AO pode ser utilizado no tratamento do cancro em condições fisiológicas específicas, tal como sob stress metabólico.
viii
ix
Index
Index
Index
Index
Acknowledgements ... iii Abstract... v Resumo... vii Abbreviations ... xi List of Figures ... xv Introduction ... 1 1. Cancer ... 3 1.1. Liver cancer ... 4 1.1.1. Hepatocellular carcinoma ... 41.1.2. Signaling pathways associated with hepatocellular carcinoma ... 5
2. The PI3K/AKT/mTOR pathway... 6
3. Autophagy... 7
3.1. The process of autophagy ... 8
3.2. Regulation of autophagy ... 10
3.2.1. Amino acid signaling ... 11
3.2.2. Insulin/Insulin-like Growth Factor signaling ... 12
3.2.2.1. PI3K ... 12
3.2.2.2. AKT ... 13
3.2.2.3. mTOR ... 13
3.2.2.4. Feedback mechanism that regulates autophagy ... 14
3.2.3. Energy-dependent AMPK signaling ... 16
4. Autophagy and lipids ... 16
5. Cancer therapy and pharmacological autophagy modulation ... 19
6. Natural compounds and cancer ... 21
6.1. Triterpenoids ... 21
6.1.1. Ursolic acid ... 22
6.1.2. Oleanolic acid ... 23
7. Triterpenoids and cholesterol ... 24
Objectives of the work ... 27
Material and Methods ... 29
1. Chemicals and antibodies ... 31
x
3. MTT reduction assay ... 32
4. Cell death analysis by PI staining... 32
5. Western blotting ... 33
6. Immunofluorescence analysis ... 33
7. Measurement of reactive oxygen species ... 34
8. Statistical analysis ... 34
Results and Discussion ... 35
1. Effects of UA and OA in molecular markers of autophagy ... 37
2. Effect of UA and OA in HepG2 cell viability ... 38
3. OA and UA induce accumulation of acidic vacuoles ... 44
4. Autophagy inhibitors do not protect cells from death induced by OA ... 47
5. Methyl-β-cyclodextrin protects against OA-induced cell death ... 50
Final Remarks and Future Perspectives ... 55
1. Final remarks and conclusions ... 57
2. Future perspectives ... 58
3. Funding and acknowledgements ... 59
References ... 61
xi
Abbreviations
Abbreviations
Abbreviations
Abbreviations
AKT AKT AKTAKT Protein kinase B (PKB)
AMP AMP AMP
AMP Adenosine monophosphate AMPK
AMPK AMPK
AMPK AMP-activated kinase ATF
ATF ATF
ATF----2 2 2 2 Activating transcription factor 2 ATP
ATP ATP
ATP Adenosine triphosphate BCL
BCL BCL
BCL----2222 B-cell lymphoma protein-2 BECLIN 1
BECLIN 1 BECLIN 1
BECLIN 1 The human ortholog of murine Atg6 Bnip3
Bnip3 Bnip3
Bnip3 BCL-2/adenovirus E1B 19 kDa protein – interacting protein 3 BRAC2
BRAC2 BRAC2
BRAC2 Breast cancer 2 CMA
CMA CMA
CMA Chaperone-mediated autophagy CREB
CREB CREB
CREB----111 1 cAMP-response element-binding DLC
DLC DLC
DLC----111 1 Deleted in liver cancer 1 DNA
DNA DNA
DNA Deoxyribonucleic acid EGFR
EGFR EGFR
EGFR Epidermal growth factor receptor eIF4E
eIF4E eIF4E
eIF4E Eukaryotic initiation factor 4E
ERK ERK ERK
ERK Extracellular regulated kinase
FIP200 FIP200 FIP200
FIP200 FAK family – interacting protein of 200 kDa FOXO3
FOXO3 FOXO3
FOXO3 Forkhead box O3 GPCRS GPCRS GPCRS GPCRS G-protein-coupled receptors GSK GSK GSK
GSK----3333 Glycogen synthase kinase 3 HBV HBV HBV HBV Hepatitis B virus HCC HCC HCC HCC Hepatocellular carcinoma HCV HCV HCV HCV Hepatitis C virus hVps34 hVps34 hVps34
hVps34 Human vacuolar protein sorting ICAM
ICAM ICAM
ICAM----1111 Intercellular adhesion molecule 1 IGF
IGF IGF
IGF Insulin – like growth factor IGF
IGF IGF
IGF----IRIRIRIR Insulin-like growth factor-1 receptor IL
IL IL
IL----1111β Interleukin-1beta
IL IL IL IL----6666 Interleukin-6 IR IR IR IR Insulin receptor IRS IRS IRS
IRS Insulin receptor substrate Jak
Jak Jak
Jak Janus kinase JNK
JNK JNK
JNK c-Jun N-terminal kinase LAMP
LAMP LAMP
LAMP----2222 Lysosomal-associated membrane proteins 2 LC3
LC3 LC3
LC3 Microtubule-associated protein light chain 3 LD LD LD LD Lipid droplets MDC MDC MDC MDC Monodansylcadaverine M M M MβCDCDCD CD Methyl-β-cyclodextrin MEK MEK MEK
xii mLST8 mLST8 mLST8 mLST8 Mammalian LST8 MMP MMP MMP MMP matrix metalloproteinase mTOR mTOR mTOR
mTOR Mammalian target of rapamycin
mTORC1 mTORC1 mTORC1
mTORC1 mTOR complex 1 mTORC2
mTORC2 mTORC2
mTORC2 mTOR complex 2 NF
NF NF
NF----KBKBKBKB Nuclear transcription factor kappa B OA OA OA OA Oleanolic acid PDK1 PDK1 PDK1 PDK1 3’ phosphoinositide-depedent kinase 1 PepA PepA PepA PepA Pepstatin A PH PH PH PH Pleckstrin homology PI PI PI PI Phosphatidylinositol PI3K PI3K PI3K
PI3K Phosphatidylinositide 3-kinase
PI3P PI3P PI3P
PI3P Phosphatidylinositol 3-phosphate PIK3CA
PIK3CA PIK3CA
PIK3CA Phosphoinositide-3-kinase catalytic alpha polypeptid PIP
PIP PIP
PIP3333 Phosphatidylinositol (3,-4,-5)-triphosphate
PKC PKC PKC PKC Protein kinase C PPAR PPAR PPAR
PPAR----α Peroxisome proliferator-activated receptor PRAS40
PRAS40 PRAS40
PRAS40 Proline-rich Akt substrate of 40 kDa PTEN
PTEN PTEN
PTEN Phosphatase and tensin homolog
RAF RAF RAF
RAF Rat sarcoma-activated factor
RAPTOR RAPTOR RAPTOR
RAPTOR Regulatory associated protein of mTOR RAS
RAS RAS
RAS Rat sarcoma
Rb Rb Rb Rb Retinoblastoma protein Rheb Rheb Rheb
Rheb Ras homolog enriched in Brain RICTOR
RICTOR RICTOR
RICTOR Rapamycin-insensitive companion of mTOR RNA
RNA RNA
RNA Ribonucleic acid ROS
ROS ROS
ROS Reactive oxygen species RTK
RTK RTK
RTK Receptor tyrosine kinases S6K1
S6K1 S6K1
S6K1 Ribosomal protein S6 kinase 1 Sin1
Sin1 Sin1
Sin1 SAPK-interacting protein 1 SLC1A5
SLC1A5 SLC1A5
SLC1A5 Solute carrier family 1 member 5 SLC7A5
SLC7A5 SLC7A5
SLC7A5 Solute carrier family 7 member 5 SMAD2
SMAD2 SMAD2
SMAD2 SMAD family member 2 SMAD4
SMAD4 SMAD4
SMAD4 SMAD family member 2 SNARE
SNARE SNARE
SNARE Soluble NSF attachment receptor
SOCS SOCS SOCS
SOCS----1111 Suppressor of cytokine signaling 1 Stat
Stat Stat
Stat Signal transducers and activators of transcription TG TG TG TG Triglycerides T TT
TMRMMRMMRM MRM Tetramethylrhodamine methyl ester TNF
TNF TNF
TNF----α Tumor necrosis factor-α TP53 TP53 TP53 TP53 Tumor protein p53 TP73 TP73 TP73 TP73 Tumor protein p73 TSC2 TSC2 TSC2
xiii UA UA UA UA Ursolic acid ULK ULK ULK
ULK UNC51-like kinase UVAR
UVAR UVAR
UVAR Ultraviolet A radiation XIAP
XIAP XIAP
XIAP X-linked inhibitor of apoptosis protein 3 3 3 3----MAMAMAMA 3-methyladenine 4E 4E 4E
4E----BP1BP1BP1 BP1 4E binding protein-1 5’ Top
5’ Top 5’ Top
5’ Top 5’ Terminal oligopyrimidine tract
xiv
xv
List of Figure
List of Figure
List of Figure
List of Figuressss
FIGURE 1. Representation of chronological sequence of cellular lesions promoted by hepatitis B virus (HBV), hepatitis C virus (HCV) and aflatoxin B1 (AFB1), culminating in the development of hepatocellular carcinoma in humans. ... 5
FIGURE 2. Schematic representation of pathways involved in development of HCC that modulate
apoptosis, cell division, cell survival, and angiogenesis. ... 6 FIGURE 3. Schematic illustration of the autophagic process. ... 10 FIGURE 4. Schematic representation of mTOR-dependent main pathways regulating autophagy. . ... 15 FIGURE 5. Macroautophagy contributes to the delivery of proteins, lipid stores, and glycogen for
breakdown into lysosomes. . ... 18 FIGURE 6. Schematic representation of PI3K/AKT/mTOR pathway with targets of the pharmacological
inhibitors with modulatory effects in autophagy. ... 20 FIGURE 7. Structure of ursolic acid, oleanolic acid and cholesterol. ... 24 FIGURE 8. Modulation of autophagic markers by triterpenoids and starvation in HepG2 cells. ... 37 FIGURE 9. Effect of ursolic acid (UA), oleanolic acid (OA) and rapamycin (Rap) in the viability of HepG2
cells. ... 39
FIGURE 10. Effect of Rap (A) and UA (B) in the viability of HepG2 cells, as assessed by MTT reduction
assay. ... 41 FIGURE 11. Effect of oleanolic acid (OA) on the viability of HepG2 cells in complete (A) and starvation (B &
C) medium, as assessed by MTT reduction assay. ... 42 FIGURE 12. Effect of oleanolic acid (OA) on cell death in HepG2 cells under starvation, as assessed by the
PI staining assay. ... 43 FIGURE 13. Effect of oleanolic acid (OA) and ursolic acid (UA) in the appearance of cellular acidic
vacuoles, as assessed by MDC-staining. ... 45 FIGURE 14. Effect of oleanolic acid (OA) in the accumulation of acidic vacuoles in HepG2 cells under
starvation medium, as assessed by MDC-staining. ... 46 FIGURE 15. Effect of autophagy inhibitors in the cell death induced by rapamycin (Rap) and oleanolic acid
(OA) in HepG2 cells, as assessed by MTT assay. ... 48 FIGURE 16. Effect of methyl-β-cyclodextrin (MβCD) on oleanolic acid (OA)-induced cell death of HepG2
Introduction
Introduction
Introduction
Introduction
3
1.
1.
1.
1.
Cancer
Cancer
Cancer
Cancer
Cancer is currently a major health issue due to its high incidence being responsible for 13% of all deaths worldwide annually. Overall, cancer is characterized by alterations in cell proliferation, differentiation and development due to accumulation of genetic mutations [Knowles and Selby, 2005]. Carcinogenesis is the process by which these changes occur and can be divided into three distinct phases: initiation, promotion and progression [Hennings
et al.
, 1993]. During the initiation phase, irreversible mutations occur in DNA that confer cells the ability to grow faster and to avoid normal cellular growth control mechanisms. During the promotion phase, there is an increase in the proliferation ability of initiated cells. This stage is associated with accumulation of further mutations and the consequent formation of a mass of abnormal cells. The capacity of cancer cells to invade surrounding tissues and to metastasize is acquired through the progression phase [Abraham, 2003; Thyparambilet al.
, 2010]. Genes that are usually expressed inappropriately or mutated, such as oncogenes and tumor suppressor genes contribute to the development of cancer. Oncogenes act in a dominant way at the cellular level to drive proliferation or to prevent normal differentiation; in fact, impaired regulation of cell cycle is a basis for tumor formation [Knowles and Selby, 2005; Kopnin, 2000]. For example, mutational activation ofRAS
oncogene can decrease functions of checkpoints at G1 and G2 leading to genetic instability and consequently tumor progression [Kopnin, 2000]. Cancer development also occur due to inactivation/dysfunction of tumor suppressors genes, such asTP53
(tumor protein
p53)
gene that is typically mutated in most human tumors, resulting in dysfunctions of the cell cycle checkpoints and simultaneously inhibition of apoptosis [Levine, 1997; Orr-Weaver and Weinberg, 1998]. In addition to inactivating mutations in genes that provide negative regulation signals, such asTP53
, mutation in genes of DNA repair systems can also lead to the development of certain tumors, since they are important to avoid mutations in other genes [Knowles and Selby, 2005].4
1.1. Liver cancer
Cancer of the liver is the sixth most common cancer in the world and can have different etiologies. Risk factors that are associated directly or indirectly with different diseases of the liver, include infection with hepatitis B and C virus (HBV and HCV, respectively), contamination of food with aflatoxins, heavy alcohol consumption, tobacco smoking, obesity, diabetes, iron overload, infestation with the liver flukes, exposure to vinyl chloride, as also children affected with Beckwith-Wiedemann syndrome [Boffetta and Hashibe, 2006; Chuang
et al.
, 2009; El-Serag and Rudolph, 2007]. Less common types of hepatic cancer include: (i) hepatoblastoma that represents 1% of malignances of children younger than 20 years old; (ii) cholangiocarcinoma that is relative to the cancer of the intrahepatic biliary ducts; and, (iii) angiosarcoma - a liver mesenchymal tumor that usually occurs in elderly men [Chuanget al.
, 2009]. The most common form of liver cancer is the hepatocellular carcinoma (HCC), which has a high incidence worldwide and cause a high number of deaths.1.1.1.
Hepatocellular carcinoma
Hepatocellular carcinoma is the most common cause of cancer mortality. The incidence of HCC varies widely, with high rates in sub-Saharan Africa, eastern and southeastern Asia, and Melanesia, and with a low incidence in Northern and Western Europe and the Americas [Parkin
et al.
, 2005]. Approximately 90-95% of HCC are caused by persistent HBV and HCV infections (chronic hepatitis) and cirrhosis, particularly with dysplastic hepatocytes [Grisham, 2001; Motola-Kubaet al.
, 2006; Sekiet al.
, 2000; Takayamaet al.
, 1990]. These tissue lesions are precancerous histological changes that normally precede HCC and allow identifying the temporal order with which genomic alterations develop during hepatocarcinogenesis (Figure 1) [Thorgeirsson and Grisham, 2002]. In western countries the HCC is caused mainly due to alcoholic cirrhosis [Chiesaet al.
, 2000].The hepatocarcinogenesis is the result of a multistep process characterized by the accumulation of genetic alterations in hepatocytes, the major cell type in the liver [Motola-Kuba
et
al.
, 2006]. When compared with other cancers, such as colon and breast cancers, HCC has notso predominant genetic mutations important role in hepatocarcinogenesis, [Ozturk, 1999]. This gene
overexpression of oncogenes and underexpression Ng, 2008]. Genetic alteration
protein from degradation and
upregulation of target genes, including the proto 1999; Thyparambil
et al.
, 2010HCC include mutations in
in liver cancer 1)
,PTEN (phosphatase and tensin homolog)
SMAD2 (SMAD family member 2)
2)
andSOCS-1
(suppressor of cytokine signaling 1)
al.
, 2006].1.1.2.
Signaling pathways associated with hepatocellular carcinoma
Many signaling pathways are process, being the most common
result in increased proliferation, invasion, metastasis
Figure 1.Representation of chronological sequence of cellular lesions promoted by hepatitis B virus (HBV), hepatitis C virus (HCV) and aflatoxin B1 (AFB1), culminating in the development of hepatocellular carcinoma in human
Grisham, 2002]).
genetic mutations [Wong and Ng, 2008]. Mutations in important role in hepatocarcinogenesis, and are associated with about
gene mutation leads to a reduction of apoptosis and overexpression of oncogenes and underexpression of other tumor suppressor genes
alterations in β
-catenin
gene, which is involved in Wnt signaling, protect protein from degradation and, therefore, increase its nuclear accumulation.upregulation of target genes, including the proto-oncogene c-
myc
andcyclin D1
, 2010]. Other genetic alterations associated with the development of in
TP73 (tumor protein p73)
,Rb
(retinoblastoma protein)
PTEN (phosphatase and tensin homolog)
,IGF-2 (insulin
SMAD2 (SMAD family member 2)
andSMAD4
(SMAD family member 4)
,BRAC2 (breast cancer
suppressor of cytokine signaling 1)
genes [Fujimoriet al.
, 1991Signaling pathways associated with hepatocellular carcinoma
pathways are deregulated in HCC and associated with being the most common activated through receptor tyrosine kinases, RTK
proliferation, invasion, metastasis and survival of tumor cells
chronological sequence of cellular lesions promoted by hepatitis B virus (HBV), hepatitis C virus (HCV) and aflatoxin B1 (AFB1), culminating in the development of hepatocellular carcinoma in human
5
Mutations in
TP53
gene, have an iated with about 30% of HCC cases a reduction of apoptosis and coincides with r suppressor genes [Wong and gene, which is involved in Wnt signaling, protects the nuclear accumulation. This leads to thecyclin D1
[Shtutmanet al.
, Other genetic alterations associated with the development of(retinoblastoma protein)
,DLC-1 (deleted
insulin-like growth factor 2)
,BRAC2 (breast cancer
, 1991; Motola-Kuba
et
Signaling pathways associated with hepatocellular carcinoma
associated with the carcinogenesis inases, RTKs, which will survival of tumor cells (Figure 2)
chronological sequence of cellular lesions promoted by hepatitis B virus (HBV), hepatitis C virus (HCV) and aflatoxin B1 (AFB1), culminating in the development of hepatocellular carcinoma in humans (from [Thorgeirsson and
6
[Huynh, 2010]. These include the rat sarcoma/rat sarcoma-activated factor/mitogen-activated protein extracellular kinase/extracellular regulated kinase (RAS/RAF/MEK/ERK) pathway, the
phosphatidylinositide 3-kinase/protein kinase B/mammalian target of rapamycin
(PI3K/AKT/mTOR) pathway, as well as the janus kinase/signal transducers and activators of
transcription (Jak/Stat) and the Wnt/β-catenin signaling pathways (Figure 2) [Avila
et al.
, 2006; Huynh, 2010]. In this thesis, only the PI3K/AKT/mTOR pathway was object of study.Figure 2. Schematic representation of pathways involved in development of HCC that modulate apoptosis, cell division, cell survival, and angiogenesis. Included are the rat sarcoma/rat sarcoma-activated factor/mitogen activated protein kinase/extracellular regulated kinase (Ras/Raf/MAP/ERK) pathway, the phosphatidylinositide 3-kinase/protein kinase B/mammalian target of rapamycin (PI3K/AKT/mTOR) pathway and Wnt/β-catenin pathway (modified from [Carr and Kralian, 2010]).
2.
2.
2.
2.
The PI3K/AKT/mTOR pathway
The PI3K/AKT/mTOR pathway
The PI3K/AKT/mTOR pathway
The PI3K/AKT/mTOR pathway
The PI3K/AKT/mTOR is one of major signaling pathways associated with and constitutively activated in many types of cancer including HCC [Llovet and Bruix, 2008]. PI3K is activated by RTKs, such as insulin-like growth factor-1 receptor (IGF-IR) and epidermal growth
7
factor receptor (EGFR), the oncogene RAS, integrins that are molecules of cell adhesion, and G-protein-coupled receptors (GPCRS); and is negatively regulated by the
PTEN
tumor suppressor gene [LoPiccoloet al.
, 2008; Wanget al.
, 2011b]. In tumor cells, the mechanisms for this pathway activation include mutations in the p110 catalytic domain of phosphoinositide-3 kinase(PIK3CA)
gene, amplification or mutation of AKT, and loss of function of PTEN byunderexpression or epigenetic silencing [Hu
et al.
, 2003; LoPiccoloet al.
, 2008; Wanget al.
, 2007; Wanget al.
, 2011b]. The serine/threonine kinase AKT occurs in three isoforms, AKT1, AKT2, AKT3, being expressed distinctively depending of the tissues, and in particular to HCC cellmass there is the expression of AKT2 but not of AKT1 [Xu
et al.
, 2004; Zindaet al.
, 2001].mTOR is a major mediator of this signaling pathway and is a downstream substrate of AKT, which can phosphorylate directly mTOR or indirectly by phosphorilation and inactivation of tuberous sclerosis complex 2 (TSC2) [LoPiccolo
et al.
, 2008; Wanget al.
, 2011b]. mTOR is presented in two forms, mTOR complex 1 (mTORC1) and mTOR complex 2 (mTORC2): the first is implicated on control protein translation and autophagy, and promotes the expression ofc-myc
,cyclin D
and other genes involved in cell proliferation, growth and angiogenesis; in turn mTORC2 is responsible for the activation of AKT by phosphorylation at serine 473, promoting cell survival (Figure 4) [Carr and Kralian, 2010; Sahinet al.
, 2004; Sarbassovet al.
, 2005b]. The involvement of PI3K/AKT/mTOR pathway in the autophagy process is of special interest in this work and, therefore, it will be detailed as follow.3.
3.
3.
3.
Autophagy
Autophagy
Autophagy
Autophagy
Autophagy is a cellular dynamic process of “self-eating” that was first described by de Duve and Wattiaux [De Duve and Wattiaux, 1966]. There are three primary forms of autophagy: macroautophagy, microautophagy and chaperone-mediated autophagy (CMA), differing from each other on their physiological functions [Rautou
et al.
, 2010]. Macroautophagy is the most prevalent and commonly referred to as autophagy (term hereafter used to refer to macroautophagy), and is characterized as a non-selective vacuolar degradative cellular process by which intracellular membrane structures sequester proteins and organelles to degrade and turn over these materials [Meijer and Codogno, 2004]. When cells are exposed to different8
situations of stress, such as nutrient starvation, oxidative stress, and hormonal signaling, autophagy takes place and can result in adaptation and survival, or cell death [Kondo
et al.
, 2005; Meijer and Codogno, 2004]. Extracellular pathogens are also eliminated in this pathway as part of a cellular defense mechanism [Eskelinen and Saftig, 2009; Toddeet al.
, 2009]. The capacity for degradation is an important autophagic function but if unregulated it can be lethal. Basal levels of autophagy are important for maintaining normal cellular homeostasis and to generate energy and building blocks for reuse in order to cells survive under nutrient starvation [Kroemeret al.
, 2010]. However, excessive autophagy may lead to autophagic cellular death, the also called type II programmed cell death [Galluzziet al.
, 2009].In cancer cells, autophagy is suppressed during the early stages of tumorigenesis, because there is a need of higher level of protein synthesis than protein degradation to promote tumor growth [Cuervo, 2004]. In addition, with inhibition of autophagy there is less removal of damaged organelles, which allows accumulation of genotoxic free radicals contributing for cancer promoting stages [Edinger and Thompson, 2003]. Although autophagy is generally decreased in cancer cells compared with normal ones, in later stages of tumorigenesis stimulation of autophagy is observed in cancer cells that are located in the central areas of the tumor, where there is poor vascularization allowing them to survive under conditions of nutrient starvation and low oxygen conditions [Cuervo, 2004]. In addition, induction of autophagy was also observed in response to anticancer drugs, and therefore, autophagy is currently viewed as a good target for cancer therapy [Bursch
et al.
, 2000; Inbalet al.
, 2002; Paglinet al.
, 2001].3.1. The process of autophagy
Autophagy is an evolutionarily conserved lysosomal degradation pathway that occurs in all eukaryotic cells, from yeast to mammals [Klionsky and Emr, 2000; Meijer and Codogno, 2004]. The autophagic process begins with the sequestration of cytoplasmatic constituents, including organelles, by a double-membrane-bound structure known as phagophore or isolation membrane [Mizushima, 2007; Stromhaug
et al.
, 1998]. The elongation and complete closure of the phagophore, results in the formation of the autophagosome, which after maturation fuse with lysosome to form the autolysosome. Then, the sequestered content together with the inner9
autophagosomal membrane are degraded by acidic lysosomal hydrolases for recycling (Figure 3) [Mizushima, 2007; Shintani and Klionsky, 2004].
Several Atg (autophagy-related) proteins are necessary to the execution of autophagy and have been first characterized in yeast, and many of these have mammalian orthologs [Yang
et
al.
, 2005]. Together with other autophagy proteins, the class III PI3K, also named human vacuolar protein sorting (hVps34) is involved in initial formation of the phagophore membrane, as well as in the sequestration of all contents that will be degraded [Lianget al.
, 1999; Petiotet al.
, 2000; Sunet al.
, 2008]. The first evidence of implication of this enzyme in the autophagic process was due to discovery of 3-methyladenine (3-MA) that is able to block the formation of autophagosomes by inhibition of class III PI3K (Figure 3) [Blommaartet al.
, 1997b; Furuyaet al.
, 2005; Petiotet al.
, 2000; Zenget al.
, 2006].BECLIN 1
was the first tumor suppressor gene related with autophagy to be reported, and its interaction with class III PI3K is necessary for autophagy. BECLIN 1, can be inhibited by the interaction with the antiapoptotic protein BCL-2 [Sinha and Levine, 2008; Yanget al.
, 2005]. In other words, dissociation of BECLIN 1 from BCL-2 is necessary to occur induction of autophagy and, consequently, there is a relationship betweenthe induction of autophagy and increased expression of BECLIN 1 [Liang
et al.
, 1999; Niceet al.
,2002]. Microtubule-associated protein light chain 3 (LC3), a mammalian homolog of yeast Atg8, is a major constituent of the autophagosomes and also important for their formation [Mizushima
et al.
, 2004]. LC3 is synthesized as a pro-protein that is cleaved at the glycine residue, forming the cytosolic LC3-I [Farkaset al.
, 2009]. The C-terminal glycine of LC3-I when coupled to phosphatidylethanolamine through an ubiquitin-like conjugation reaction result in the formation of LC3-II [Ichimuraet al.
, 2000; Kabeyaet al.
, 2004]. LC3-II is important for the elongation and closure of the phagophore and remains associated with the inner and outer membrane of the autophagosome (Figure 3) [Nakatogawaet al.
, 2007]. After fusion with the lysosome, the LC3-II content in the autolysosome decreases either by cleavage (outer) or by degradation by lysosomal enzymes (inner membrane-associated) [Kabeyaet al.
, 2000; Mizushimaet al.
, 2010]. Consequently, LC3-II is considered as a good autophagy marker [Kouriet al.
, 2002]. p62 protein/sequestome 1 (p62/SQSTM1) is a ubiquitin-binding protein that binds directly to LC3-II and is transported into the autophagosome, where it will be degraded on the final phase of the autophagic process [Ichimura and Komatsu, 2010]. p62 is also used as marker of autophagic flux, because when occurs a inhibition or induction of autophagy, there is an accumulation or decline of p62 levels, respectively [Bjorkoyet al.
, 2009].10
Figure 3.Schematic illustration of the autophagic process. Autophagy begins with the isolation of a double membrane that sequesters and engulfs cellular proteins, organelles and cytoplasm to form a double membrane vesicle named autophagosome. The isolation membranes elongate and mature, with the necessary recruitment of the microtubule-associated protein 1 light chain 3 (LC3). The formation of the pre-autophagosomal structure can be inhibited by the class III PI3K inhibitor 3-methyladenine (3-MA). Lysosomes fuse with autophagosomes and intraautophagosomal contents are lysed by lysosomal hydrolases for recycling. This process can be inhibited by lysosomotropic agents such as chloroquine [Andjelkovic et al., 1997]. Pepstatin A (PepA) and E64d, inhibitors of cathepsins, also inhibit the final step of autophagy that is the degradation of intraautophagosomal contents. Represented are also other forms of inhibition of autophagy, either pharmacologically or by molecular tools (modified from [Mehta and Siddik, 2009]).
3.2. Regulation of autophagy
Autophagy has an important role in cancer and the initial signals that induce autophagy are mainly due to stress conditions, such as anticancer treatments, and low nutrient availability [Kondo
et al.
, 2005]. There is thus a growing interest in pathways and molecules that regulate autophagy that can be used as targets in cancer treatment [Sridharanet al.
, 2011]. The autophagic process and the molecular machinery associated suggest that its regulation can be complex and may involve multiple signaling inputs [Periyasamy-Thandavanet al.
, 2009]. Kinases11
such as mTOR, PI3K and AKT play an essential role in induction or inhibition of autophagy depending on different stimuli, where mTOR occupies an important position because it is the principal regulator of autophagy [Periyasamy-Thandavan
et al.
, 2009]. Bellow will be described the most important pathways that regulate autophagy.3.2.1. Amino acid signaling
The amino acids are the major end products of protein degradation process in autophagy and promote its regulation by inhibition of this process, maintaining cellular homeostasis [Yang
et
al.
, 2005]. However, not all amino acids are involved in autophagy regulation [Mortimore and Poso, 1987; Periyasamy-Thandavanet al.
, 2009; Seglenet al.
, 1980]. In particular, alanine, leucine, glutamine and phenylalanine seem to be effective inhibiting autophagy [Bergaminiet al.
, 1995; Mortimoreet al.
, 1991; Seglenet al.
, 1980]. These amino acids have their own recognition sites at the cell surface and promote signal transduction that will act by phosphorylation of mTORC1 through the Ras-related small GTPases (Rag proteins), suppressing autophagy [Kadowakiet al.
, 2006; Kimet al.
, 2008a; Longet al.
, 2005]. The stimulation of autophagy through nutrient starvation (nitrogen starvation) was first demonstrated by Schworer and Mortimore in 1977 [Chanet al.
, 2006a]. Recently, it was demonstrated that it is L-glutamine that is the rate-limiting factor that enables amino acids shortage to inhibit mTORC1 signaling [Mortimore and Schworer, 1977; Nicklinet al.
, 2009]. Under conditions of availability of extracellular amino acids the influx of L-glutamine by its high-affinity transporter SLC1A5 (solute carrier family 1 member 5) occurs increasing its intracellular concentration (Figure 4) [Ravikumaret al.
, 2010]. The heterodimeric SLC7A5 (solute carrier family 7 member 5)/SLC3A2 is a bidirectional antiporter that uses L-glutamine as an efflux substrate in exchange for the cellular uptake of essential amino acids that consequently allows activation of mTORC1 through the Rag GTPases [Nicklinet al.
, 2009]. The stimulation of autophagy by amino acid starvation reproduces what happens in advanced stages of cancer, where autophagy may be required to provide essential nutrients to cells in the inner part of a solid tumor that do not have direct access to the blood supply [Ogier-Denis and Codogno, 2003].12
3.2.2. Insulin/Insulin-like Growth Factor signaling
The pathways through which hormones regulate autophagy are distinct from those regulated by nutrients, but both converge in the activation or inhibition of the key regulator of autophagy - mTOR. The hormone insulin that is secreted by the pancreas in response to high blood glucose, binds to its receptor (insulin receptor – IR) on the surface of cells and promotes its autophosphorylation on tyrosine residues. This induces the recruitment and phosphorylation of IRS1 and IRS2 (insulin receptor substrate 1 and 2) [He and Klionsky, 2009; Neely
et al.
, 1977; Pfeifer, 1978]. The insulin-like growth factor is mainly secreted in the liver as a result of stimulation by the growth hormone, and has the same effect on the IR as insulin. High levels of circulating insulin-like growth factor 1 (IGF1) and certain genetic polymorphisms of IGF1 are associated with increased risk of several cancers [Taoet al.
, 2007]. In association with the phosphorylation of insulin receptors, p85 (a regulatory subunit of class I PI3K) promotes activation of PI3K (Figure 4) [Yanget al.
, 2005]. Thereby, activation of PI3K generates phosphatidylinositol (3,-4,-5)-triphosphate (PIP3) that allows membrane recruitment of AKT and 3’phosphoinositide-depedent kinase 1 (PDK1) [Alessi
et al.
, 1997; Stokoeet al.
, 1997]. This last in turn phosphorylates and activates AKT, leading to activation of mTOR and thus inhibition of autophagy (Figure 4) [Blommaartet al.
, 1997a; Klionsky, 2004]. This effect can be reversed by the tumor suppressor gene PTEN, which reverse PIP3 production and decreases the downstream AKT signaling, positively regulating autophagy (Figure 4) [Aricoet al.
, 2001].3.2.2.1. PI3K
The enzymes PI3K catalyze the phosphorylation of the 3’ position hydroxyl group of the inositol ring in phosphatidylinositol, and have been classified into three classes [Cantley, 2002]. Each class has its own structure, function, substrate specificity and lipid products [Engelman
et
al.
, 2006; Katsoet al.
, 2001]. The classes I PI3K is often activated in response to growth factors and once activated, the generated PIP3 binds to the pleckstrin homology (PH) domains of PDK-1and AKT, leading to the translocation of both proteins to the cell membrane where they are consequently activated (Figure 4) [Adjei and Hidalgo, 2005; LoPiccolo
et al.
, 2008]. About the class II PI3K little is known of their function but it is thought to play a role in processes such as cell migration and vascular smooth muscle contraction [Dominet al.
, 2005; Wanget al.
, 2006].13
The class III PI3K specifically produces the lipid phosphatidylinositol 3-phosphate (PI3P) and is involved in the formation of autophagosomes and initiation of autophagy [He and Klionsky, 2009; Schu
et al.
, 1993; Voliniaet al.
, 1995; Yanget al.
, 2005]. The sole member of class III PI3K is hVps34 and was first identified as an important regulator of vesicular trafficking in the endosomal/lysosomal system [Lindmo and Stenmark, 2006; Odorizziet al.
, 2000]. It is implicated in the recruitment of proteins that have PI3P binding domains to the intracellular membranes [Backer, 2008; Lindmo and Stenmark, 2006; Odorizziet al.
, 2000]. hVps34 interacts with the autophagy-related proteins such as BECLIN 1, UVRAG (UV radiation resistance-associated gene), Bif-1 (Bax-interacting factor 1) and p150 (Vps15 in yeast), forming a complex that produces PI3P by phosphorylation of phosphatidylinositol (PI) important for the execution of autophagy [Furuyaet al.
, 2005; Kiharaet al.
, 2001; Lianget al.
, 2006; Takahashiet al.
, 2007].3.2.2.2. AKT
AKT is a serine/threonine kinase also named protein kinase B (PKB), which is activated by various signals upstream class I PI3K, resulting in the phosphorylation of multiple downstream effectors [Nogueira
et al.
, 2008; Vivanco and Sawyers, 2002]. This kinase is present in three isoforms, AKT1, AKT2 and AKT3, and their activation occur first by phosphorylation at threonine 308 in the catalytic domain by PDK-1 and then requires a subsequent phosphorylation at serine 473, which can be mediated by several kinases such as PDK-1, AKT itself or mTORC2 complex [Andjelkovicet al.
, 1997; Balendranet al.
, 1999; Santoset al.
, 2001; Toker and Newton, 2000]. Once activated, one of the downstream effectors of AKT is the tumor suppressor proteins mutated in tuberous sclerosis which form a complex named the tuberous sclerosis complex (TSC) [Ravikumaret al.
, 2010]. TSC consists of TSC1 and TSC2, where their phosphorylation is inhibitory by blocking TSC2 interaction with TSC1. This leads to activation of the GTP-binding protein Rheb (Ras homolog enriched in Brain), which directly binds and activates the mTORC1 resulting in protein synthesis, cell growth and suppression of autophagy (Figure 4) [Gaoet al.
, 2002; Mathewet al.
, 2009; Ravikumaret al.
, 2010; Teckman and Perlmutter, 2000].3.2.2.3. mTOR
The serine/threonine kinase mTOR is the master regulator that integrates upstream pathways that include the response to insulin/growth factor signaling through PI3K/AKT and to nutrient and energy conditions (see 3.2.1 and 3.2.3), leading to the regulation of autophagy and
14
other cellular functions, such as initiation of mRNA translation, cell growth and proliferation, and transcription [Sarbassov
et al.
, 2005a]. mTOR can exist in two distinct protein complexes, of which only one is involved directly with autophagy regulation.Rapamycin-sensitive mTORC1 consists of the mTOR catalytic subunit, RAPTOR (regulatory associated protein of mTOR) mLST8 (mammalian LST8) and PRAS40 (proline-rich Akt substrate of 40 kDa) [Guertin and Sabatini, 2009; Yang and Guan, 2007]. When activated, mTORC1 phosphorylates the ribosomal protein S6 kinase 1 (S6K1 also named p70S6K) to positively regulate the translation of mRNAs containing 5’ terminal oligopyrimidine tract (5’ Top). In addition, the eukaryotic initiation factor 4E binding protein-1 (4E-BP1) is also phosphorylated by mTORC1, which induces its dissociation from the eukaryotic initiation factor 4E (eIF4E), liberating this factor to bind the 5’ terminal cap structure of RNA promoting the initiation of translation [Yang
et al.
, 2005]. mTORC1 also phosphorylates and regulates proteins involved in autophagy (Figure 4). Active mTORC1 interacts with and phosphorylates the UNC51-like kinase 1/2 (ULK1/2) and Atg13, leading to their inhibition, and together with FAK family – interacting protein of 200 kDa (FIP200) form a ULK1/2-Atg13-FIP200 complex that promote inhibition of autophagy [Ravikumaret al.
, 2010]. Under starvation conditions or rapamycin treatment, mTORC1 is inhibited due to the dissociation of mTOR from the complex. Inactive mTORC1 dissociates from the ULK1/2-Atg13-FIP200 complex resulting in the dephosphorylation of ULK1/2, activating it, which promotes the ULK1-mediated phosphorylations of Atg13, FIP200, and ULK1 itself, triggering the autophagy cascade (Figure 4) [Ganleyet al.
, 2009; Hosokawaet
al.
, 2009; Junget al.
, 2009; Ravikumaret al.
, 2010]. Therefore, the ULK1/2-Atg13-FIP200 complex signals the autophagic machinery downstream of mTORC1.In contrast, rapamycin-insensitive mTORC2 is composed by mTOR, RICTOR (rapamycin-insensitive companion of mTOR), mLST8 and Sin1 (SAPK-interacting protein 1), and it is able to phosphorylate members of the AGC kinase family, such as AKT and protein kinase C (PKC), promoting cellular survival and actin cytoskeleton organization, respectively [Jacinto
et al.
, 2004; Sarbassovet al.
, 2004].3.2.2.4. Feedback mechanism that regulates autophagy
The role of mTOR in regulation of autophagy can also involve the mTORC2 complex (Figure 4). Chen
et al.
have shown that low concentrations of rapamycin induce AKT phosphorylation by inhibition of mTORC1 but higher concentrations suppress AKT15
phosphorylation through inhibition of mTORC2 [Chen
et al.
, 2010]. The mTORC2 have an important role in activation of AKT that is implicated in the phosphorylation and inactivation of the forkhead box O3 (FOXO3) transcriptional factor, which has been reported to stimulate autophagy by increasing the expression of proteins involved in autophagy, such as LC3 and BCL-2/adenovirus E1B 19 kDa protein – interacting protein 3 (Bnip3) [Brunetet al.
, 1999; Mammucariet al.
, 2007; Sarbassovet al.
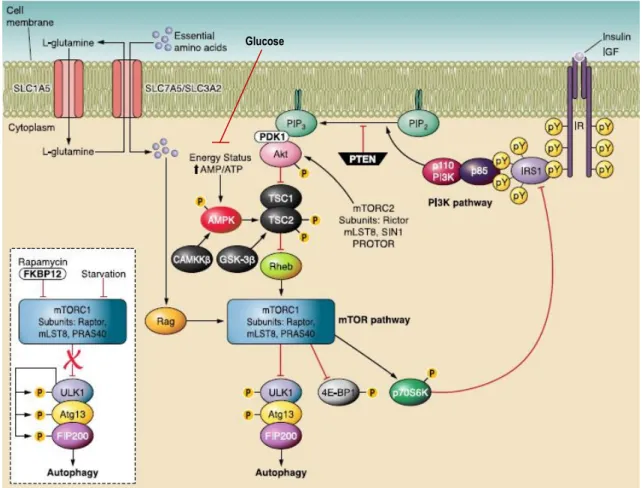
, 2005b].Figure 4.Schematic representation of mTOR-dependent main pathways regulating autophagy. The activation of PI3K pathway trough binding of insulin (or growth factors) to insulin receptor (IR) leads to activation of AKT, and in turn inhibition of TSC-1/2 complex that promotes activation of Rheb and consequently mTORC1. AKT can also be phosphorylated and activated by mTORC2. Downstream of mTORC1, the ULK1-Atg13-FIP200 complex acts as an integrator of the autophagy signals. Under nutrient-rich conditions, mTORC1 suppresses autophagy by interacting with this complex and mediating phosphorylation dependent inhibition of Atg13 and ULK1. Under starvation conditions or rapamycin treatment, mTOR dissociates from the complex, resulting in dephosphorylation-dependent activation of ULK1 and ULK1-mediated phosphorylations of Atg13, FIP200, and ULK1 itself, which triggers autophagy. Amino acids activate mTORC1 via Rag GTPases and suppress autophagy, being L-glutamine the rate limiting factor. The mTORC1 pathway regulates cell growth mainly through 4E-BP1 and p70S6K. Phosphorylation dependent activation of p70S6K can also inhibit IRS1, thereby exerting a negative feedback loop mechanism (modified from [Ravikumar et al., 2010]).
16
Therefore, mTORC2 can negatively regulate autophagy indirectly by AKT through a negative feedback loop. In addition, autophagy can be also regulated by other feedback loop through p70S6K [Scott
et al.
, 2004]. Once activated by PI3K/AKT signaling, mTOR/p70S6K phosphorylates the IRS-1 on serine residues, resulting in its inhibition by targeting it to degradation. This work as a negative feedback loop that attenuate PI3K/AKT signaling, and therefore mTOR activity (Figure 4) [Manning and Cantley, 2007; O'Reillyet al.
, 2006; Ravikumaret al.
, 2010].3.2.3.
Energy-dependent AMPK signaling
The autophagic process is ATP-dependent and lower cellular energy levels (for example, due to glucose starvation or other stress) signals mTORC1 by activating AMPK [Chan
et al.
, 2006b; Farkaset al.
, 2011]. AMPK, which senses changes in the intracellular ATP/AMP ratio, directly phosphorylates TSC2, thereby providing the priming phosphorylation for subsequent phosphoryalation of TSC2 by glycogen synthase kinase 3 (GSK-3) to inhibit mTOR signaling, thereby inducing autophagy and inhibiting protein synthesis (Figure 4) [Hoyer-Hansen and Jaattela, 2007; Inokiet al.
, 2006].4.
4.
4.
4.
Autophagy and lipid
Autophagy and lipid
Autophagy and lipidssss
Autophagy and lipid
Autophagy is an essential cellular process that mediates the degradation of intracellular components since they are dysfunctional or to meet cellular energetic demands. Therefore, during nutrient deprivation not only autophagic degradation of cytosolic proteins and organelles are in place, but also lipid and glycogen stores are mobilized for energy production (Figure 5) [Eskelinen and Saftig, 2009; Singh and Cuervo, 2011; Todde
et al.
, 2009]. Lipids are essential to all organisms as substrates for energy production, as precursors of membrane lipids and as signaling molecules of several cellular processes. The cells store the lipids as triglycerides in the form of dynamic organelles called lipid droplets (LD) that, when necessary, are breakdown into free fatty acids by the process of lipolysis [Martin and Parton, 2006]. Both autophagy and lipolysis are regulated hormonally by insulin and glucagon and are increased during starvation17
[Mizushima and Klionsky, 2007; Singh
et al.
, 2009a]. Interestingly, it has been established recently a link between these two catabolic processes, in which part of lipid droplets have been incorporated into autophagic vesicles of double membrane, that subsequently fuse with lysosomes, for degradation of their contents (Figure 5) [Singhet al.
, 2009a]. Genetic or pharmacology inhibition of autophagy in hepatocytes resulted in increased content of triglycerides (TG) and LD, supporting the idea that lysosomal degradation of intracellular LD by autophagy is a constitutive process and that can also contribute to lipid mobilizationin vivo
[Singhet al.
, 2009a]. However, other study revealed that autophagy is involved in LD formation, during starvation in hepatocytes and cardiomyocytes. The lipidated LC3 protein required for autophagosome formation was shown to be present in isolated LD. In addition, knockout of the essential autophagy gene Atg7 led to a reduced content of LD during fasting [Shibataet al.
, 2009]. These contrasting effects between both studies may be due to the model used: in the first adult mice were used whereas in the second young mice were used [Rodriguez-Navarro and Cuervo, 2010]. Interestingly, studies in pre-adipocytes in culture also showed that autophagy can regulate adipogenesis (the differentiation process of pre-adipocytes into mature adipocytes) [Singhet al.
, 2009b].Despite the importance of autophagy to regulate lipid metabolism, many evidences also support that lipids and lipid modifications modulate autophagy. For example, it has been reported that exposure of cells to a high lipid load significantly decreases the degradation of proteins mainly due to reduced autophagy [Koga
et al.
, 2010]. This high lipid load affects the cholesterol content of membranes reducing it, which can lead to defects in the membrane fusion between autophagosome and lysosomes, inhibiting therefore autophagy in later steps [Kogaet al.
, 2010]. Conversely, a previous study reports that depletion of cholesterol in fibroblasts induces autophagy [Chenget al.
, 2006]. However, these authors studied autophagy only by measuring LC3 levels by western blot and immunofluorescence. They observe a significant increase of LC3 that suggest them to be in the presence of increased of autophagic activity. However, it is known currently that this effect is most probably due to the inhibition of autophagy at later steps [Mizushimaet al.
, 2010]. Also CMA is known to be affected by cholesterol levels. The receptor of this autophagic pathway, LAMP-2A, associates in a dynamic manner with lipid microdomains (enriched in cholesterol and sphingolipids) at the lysosomal membrane. LAMP-2A undergoes regulated degradation in these regions, and therefore lower cholesterol levels will increase CMA activity [Rodriguez-Navarro and Cuervo, 2010]. The PI3P lipid molecules are also required and18
essential for autophagy execution, serving as a scaffold for the assembly of autophagosomes, their trafficking in microtubules, lysosomal fusion and possibly in cargo recognition [Singh and Cuervo, 2011]. Therefore, modulation of these lipid molecules by the coordination between kinases and phosphatases are essential for regulating autophagy.
Figure 5. Macroautophagy contributes to the delivery of proteins, lipid stores, and glycogen for breakdown into lysosomes. The constituent components of these macromolecules exit the lysosome and become available for production of energy. In the case of protein breakdown, the resulting amino acids may have less energetic value and be preferentially utilized for the synthesis of new proteins. Levels of amino acids, free fatty acids, and sugars circulating in blood or in the extracellular media have a direct impact on intracellular marcoautophagy (from [Singh and Cuervo, 2011]).
19
5.
5.
5.
5.
Cancer therapy and pharmacological autophagy modulation
Cancer therapy and pharmacological autophagy modulation
Cancer therapy and pharmacological autophagy modulation
Cancer therapy and pharmacological autophagy modulation
Autophagy is a process with an important role in cancer development and therapy. Increased levels of autophagy are commonly observed in tumor cells after cancer therapy, such as by radiotherapy, with chemotherapeutics (e.g., doxorubicin, temozolomide, camptothecin), by histone deacetylase inhibitors and with hormonal therapeutics (e.g., tamoxifen) [Roy and Debnath, 2010]. Considering that increased autophagic activity provide resistance of cancer cells to anticancer treatment, inhibitors of autophagy have been proposed as good adjuvants for cancer therapy [Roy and Debnath, 2010]. In established tumors, increased autophagy has been reported in central parts of the tumor as a strategy for survival in a very stressful and nutrient-deprived environmental. Autophagy-dependent cell death has also being explored in cancer treatment, where extensive degradation of cytoplasmic materials beyond a critical point is believed to drive cell death. Therefore, the signaling pathways that regulate autophagy and also proliferation and apoptosis, which commonly are altered in cancer, are therefore potential therapeutic targets (Figure 6) [Kondo
et al.
, 2005].A range of chemical inhibitors of autophagy, such as 3-MA, chloroquine (CQ), pepstatin A (PepA) and E64d, LY-294002 and wortmannin, can be used to study the role of autophagy in tumorigenesis and in response to therapy (Figure 6). However, due to lack of specificity, low solubility and/or high toxicity of many of these compounds, their clinical application is compromised of low value. For example, 3-MA inhibits both class I and class III PI3K; the inhibition of class I PI3K is persistent, whereas its effect on class III PI3K is transient, providing a temporal different effect and an inhibition of autophagosome formation [Bursch
et al.
, 1996; Wuet al.
, 2010]. In addition to 3-MA, other pharmacologic agents such as LY-294002 and wortmannin target the p110 catalytic subunit of class I PI3K, but also lack specificity like 3-MA, which compromise also their use in modulating autophagy [LoPiccoloet al.
, 2008]. Chloroquine, known as an anti-malarial drug, is an inhibitor of lysosomal acidification, because leads to disruption the lysosomal pH gradient. Thus, it blocks the terminal stages of autophagic proteolysis by preventing the fusion of autophagosomes with lysosomes. Currently, CQ is being tested in clinical trials for cancer treatment through autophagy inhibition [Farkaset al.
, 2011; Roy and Debnath, 2010; Yamamotoet al.
, 1998]. The inhibition of lysosomal function by inhibition of cathepsins is another form of promoting the blockage of autophagy. To do this experimentally it20
can be used a combination of PepA and E64d, two inhibitors of cathepsins, in which PepA is a membrane-permeable inhibitor of cathepsins D and E, whereas E64d is a membrane-permeable inhibitor of cathepsins B, H and L [Kirschke and Wiederanders, 1987; Tamai
et al.
, 1987; Tanida and Waguri, 2010; Umezawaet al.
, 1970]. Inhibition of these proteases will promote a blockage of the final step of autophagy, easing the evaluation of autophagic flux [Kimet al.
, 2008b].As discussed above, inhibition of mTOR (and, therefore, induction of autophagy) is also a strategy to kill cancer cells since they have a higher demand on protein synthesis [Cuervo, 2004]. Frequently, rapamycin is used to inhibit mTOR and exhibits considerable anticancer activity (Figure 6) [Faivre
et al.
, 2006]. However, therapy mediated by rapamycin shows some problems, such as the need of a wide dose range to inhibit mTOR under different conditions, as also the resistance to therapy through mechanism of negative feedback loop [Chenet al.
, 2010; Foster and Toschi, 2009].Figure 6.Schematic representation of PI3K/AKT/mTOR pathway with targets of the pharmacological inhibitors with modulatory effects in autophagy (from [LoPiccolo et al., 2008]).
21
6.
6.
6.
6.
Natural compounds and
Natural compounds and
Natural compounds and
Natural compounds and cancer
cancer
cancer
cancer
Throughout of time, natural compounds from plants, marine organisms and microorganisms have been a rich source of agents that are used in many applications and fields, including in medicine, due to their structural diversity and bioactive potential [Nobili
et al.
, 2009]. Today, the natural products play a relevant role in cancer therapy and others are in development with a significant number of compounds in different phases of clinical trial [Cragget al.
, 1997; Gordaliza, 2007]. In fact, a high percentage of pharmaceutical drugs in use are of natural origin or develop from research in natural compounds, where most of them are used in anticancer treatment [Cragget al.
, 1997; Newmanet al.
, 2000].Due to the diverse molecular alterations that occur in cancer cells that are associated with their tumorigenesis, the structural diversity of natural compounds make them good source of potential anticancer drugs with a specific target of action or multi-targets in key cancer regulators. In addition, natural compounds are a more attractive option than standard chemotherapy agents, due to their recognized low-toxicity [West
et al.
, 2002]. Therefore, these chemicals of natural origin can contribute to decrease resistance of anticancer treatments or to be used as substitutes of common agents in chemotherapy [Roy and Debnath, 2010].6.1. Triterpenoids
Plants synthesize a large number of secondary metabolites, including many phytochemicals, such as phenolic compounds, essential oils, alkaloids and terpenes. Terpenes are compounds with a cyclic structure and based on the C5isoprene units [Cowan, 1999].
Triterpenoids are composed from six isoprene units (C30H48), where additional elements,
normally oxygen, are added [Cowan, 1999; Phillips
et al.
, 2006]. Triterpenoids are aglycones, but when linked to one or more sugar chains are in turn named triterpenoid saponins [Priceet
al.
, 1987].Throughout of years, triterpenoids were considered to be biologically inactive. But their low toxicity profile led to their use for medicinal purpose in many countries, primordially in Asia, and evidences of their pharmacologic activities of triterpenoids have been emerging [Bishayee
et
22
al.
, 2011]. The anticancer efficacy of several triterpenoids has been recently reported, where these compounds exhibit cytotoxicity against a variety of cancer cells without major toxicity in normal cells [Laszczyk, 2009; Petronelliet al.
, 2009; Setzer and Setzer, 2003]. In the present work we used two pentacyclic triterpenoid isomers – ursolic acid (UA) and oleanolic acid (OA).6.1.1.
Ursolic acid
Ursolic acid (3β-hydroxy-urs-12-en-28-oic acid) is a pentacyclic triterpene compound that exists in plants, medicinal herbs and fruits (Figure 7). UA has shown interesting biological activities such as anti-inflammatory, anti-hyperlipidemic, antioxidant, anti-angiogenic and anticancer effects [Banno
et al.
, 2004; De Angelet al.
, 2010; Ramoset al.
, 2010; Sohnet al.
, 1995]. Thereby, this triterpenoid has been shown to inhibit the growth of tumor cells through cell cycle arrest and induction of apoptosis in many cancer cell types [Harmandet al.
, 2003; Tanget
al.
, 2009]. Related to apoptosis induction, it was reported recently that UA activated caspase 3, -8, and -9, as well as downregulated the expression of BCL-2 in gastric cancer cells [Wanget al.
, 2011a]. It has also been suggested that UA may be involved in modulation of autophagy through activation of JNK signaling, and in turn exerting anticancer effects in apoptosis-resistant HCT15 colorectal cancer cells [Xavieret al.
, 2012, submitted]. In HCC, it has been reported that UA induces apoptosis through activation of caspase 3 and cell cycle arrest via inhibition of DNA replication and increased p21 expression [Kimet al.
, 2000]. In other study, it was also observed that UA decreased the activation of nuclear transcription factor NF-kB and its downstream effectors BCL-2 and X-linked inhibitor of apoptosis protein (XIAP), the later with ability to inhibit caspase-3, -7, and -9 [Shyuet al.
, 2010; Stennickeet al.
, 2002]. UA was also able decrease the mitochondrial membrane potential of the HCC cells HuH7 with the consequent release of cytochrome c from the mitochondria into the cytosol and with activation of caspases [Shyuet al.
, 2010; Yanet al.
, 2010]. In breast cancer cells, UA inhibited migration and invasion of tumor cells through suppression of AKT/mTOR and NF-kB signaling, with the corresponding decrease of matrix metalloproteinase (MMP) levels [Yehet al.
, 2010]. Anti-angiogenic effects of UA by decreasing the expression of vascular endothelial growth factor (VEGF), interleukin-8, and transcription factor HIF-1α was also reported in liver cancer [Linet al.
, 2011], while in melanoma cancer cells UA suppressed VEGF, MMP-2 and MMP-9 [Kanjoormana and Kuttan, 2010].23
6.1.2.
Oleanolic acid
Oleanolic acid (3β-hydroxy-olea-12-en-28-oic acid) is a isomer of UA, differing these two compounds in the position of a methyl residue (Figure 7). In OA a methyl group is together with other in position 20, while in UA the methyl group is in position 19 of the cyclic ring system [Liu, 1995]. Like UA, it has been shown that OA possess many biological activities such as anti-inflammatory, anticancer, antiviral, hepatoprotective and anti-hyperlipidemic effects, occurring in more than 120 plants species [Chen