ISSN: 1809-4430 (on-line) www.engenhariaagricola.org.br
2 Universidade Federal Rural de Pernambuco/ Recife - PE, Brasil.
3 Colégio Agrícola Dom Agostinho Ikas, Universidade Federal Rural de Pernambuco/ Recife - PE, Brasil. 4 Universidade Federal do Ceará/ Fortaleza - CE, Brasil.
5 Instituto Federal de Educação, Ciência e Tecnologia de Pernambuco/ Recife - PE, Brasil.
Doi:http://dx.doi.org/10.1590/1809-4430-Eng.Agric.v38n1p47-54/2018
STATISTICAL PROCESS CONTROL IN THE ASSESSMENT OF DRIP IRRIGATION
USING WASTEWATER
Sisgo R. Acuña Chinchilla
1*, Ênio F. de F. e Silva
2, Ceres D. G. C. de Almeida
3,
Alexsandro O. da Silva
4, Patrício R. dos Santos
51*Corresponding author. Universidade Federal Rural de Pernambuco/ Recife - PE, Brasil. E-mail: [email protected]
KEYWORDS
domestic sewage
effluent, reuse,
emitters, localized
irrigation.
ABSTRACT
The aim of this study was to evaluate drip irrigation as a process, by monitoring the
average flow applied by the emitter using tools of statistical quality control. Four kinds of
drippers were selected, two inline labyrinth type and two online where one of the inline
emitters was not self-compensating and the other, self-compensating emitter. The system
was installed in the field and tested for 85 hours, using three kinds of treated domestic
sewage effluents and tap water. The system was under statistical control when the emitters
were new, however none of the drippers reaches the manufacturer´s specification for
average flow. The online drippers showed more dispersion for individual flow
measurements and the non-self-compensating inline dripper was more accurately for this
variable. After the end of experiment, irrigation process was not under statistical control
for any kind of emitter. When using treated wastewater effluents for irrigation we
recommend a first evaluation before 7 working hours, to implement appropriated
correcting procedures to reduce clogging and as a result, maintain the process quality.
INTRODUCTION
The increase in the demand for water resources has made necessary to increase the efficiency of its use (Brito & Andrade, 2010), with the alternative of using lower quality water in the agriculture. For this, drip irrigation is the most adequate method due to the possibility of obtaining high application efficiency (Vale et al., 2013, Rowan et al., 2013).
Water reuse has been considered to be practically a necessity in semi-arid regions, considering the scarcity of good quality water, it is important to evaluate irrigation systems that operate with treated effluents. For Silva et al. (2012) the changes that the effluents can cause in the system are little known and clogging being the main factor to be considered.
Statistical quality control is a set of tools that allows solving problems and achieving stability in the process, reducing their variability. It provides information on various parameters of the process and their stability over time, allowing monitoring and increased efficiency. A
fundamental objective of statistical quality control is to quickly detect the effect of unassigned causes or changes in the process, so that corrective actions can be taken at the appropriate time (Montgomery, 2009). Among its applications are the application of pesticides (Silva et al. 2016). However, this set of techniques has been little used in the evaluation and improvement of irrigation quality.
The objective of this study was to evaluate the average flow rate of a drip system, composed of four types of emitters, operating with treated sewage effluents under field conditions using statistical quality control tools.
MATERIAL AND METHODS
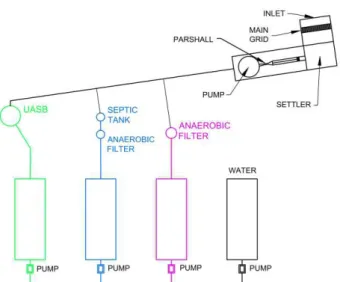
goes through preliminary, primary and secondary treatment processes (Figure 1).
FIGURE 1. Experimental wastewater treatment plant layout.
The statistical design adopted in the experiment was split-split plot, with the plots defined by the type of water and the subplots by the type of emitter. However, the analysis for the present study was focused on the statistical control of emitter quality. The drip irrigation system was installed with four types of drippers, using the three types of effluent and water in four blocks. The effluents used in this study were obtained from three independent treatment systems: 1) Upflow anaerobic sludge blanket reactor (UASB) in association with a stabilization pond; 2) anaerobic digester (septic tank) associated with an anaerobic filter and a stabilization pond; 3) anaerobic filter associated with a stabilization pond.
Each type of effluent and the supply water used in the experiment were stored in specific ponds, in the STE itself, with capacity of 9 m3 each. The emitters evaluated
were: A) self-compensating inline dripper of inner wall (0.63 mm) labyrinth type, with operating pressure range of 40-300 kPa, B) non-self-compensating inline dripper of thick-wall (0.9 mm) labyrinth type, with pressure range operation of 100-300 kPa, C) self-compensating online dripper of upper outlet, labyrinth type with operating pressure range of 50-410 kPa, and D) self-compensating online dripper of double side outlet, push-button type with operating pressure range of 80-300 kPa. The online emitters were inserted into a low density polyethylene hose of 16 mm external diameter and 15.4 mm internal diameter. The drippers had nominal flow rate of 2.0 L h-1,
with the exception of dripper D with a flow of 2.2 L h-1.
In each pond was placed a Schneider centrifugal pump of 367.7 W with suction pipe of 32 mm and foot valve strainer. At the pump outlets were installed 120 mesh (130 μm) disc filters. The fluids were driven by PVC tubing with a diameter of 32 mm until the trestles built in 25 mm PVC, where quick couplings for manometer were inserted, followed by gate valve to regulate and monitor the pressure at the inlet of the derived lines during the tests. The operating pressure was set at 100 kPa to
The dimensions of the blocks used in the experiment were 1 m wide by 18.5 m long. In each block were placed four plots, each one running with a type of wastewater. Within each plot were installed four lateral lines of 18 m, with 60 drippers each. The spacing between emitters and between lines was 0.3 m and the ground was in level in the longitudinal direction of the sides.
In order to reproduce the operation of an irrigation system of a crop under real conditions, it was used the depth corresponding to 100% of the daily evapotranspiration calculated for cotton, the Penman-Monteith methodology was used to determine the reference evapotranspiration and adopting the initial, medium and final culture coefficients (Kc) of 0.3; 1.20 and 0.6, respectively, and the location coefficient (K1) calculated on the basis of the following equation: Kl = 0.1 x S0.5 , where S is the area shaded by cultivation.
For the measurements of the flows were collected, during 15 minutes, the volumes applied by the first emitter and the emitters located in the multiple positions of four, totaling 16 drippers per side. Four water samples were collected throughout the experiment. The first reading occurred at the beginning of the experiment when the drippers had 0.5 hour of operation, the second with 7 hours of work, and the third with 55 hours and at the end of the cotton cycle, with 85 hours of operation, with a two-day irrigation interval. The irrigation time was defined as the difference between the evapotranspiration depth of the two days and the precipitation depth of the same period.
For the experiment irrigation process were considered as attributed or controllable causes x1: inlet flow, x2: pressure in the system, x3: lateral line diameter and x4: type of dripper. As non-controllable causes of the process were defined v1: characteristics and quality of water or effluent, v2: emitter clogging, v3: water temperature, v4: soil temperature, v5: air temperature, v6: emitter wear, and v7: expansion of the internal diameter of the hoses. The response variable evaluated to characterize the irrigation process was the mean flow rate of the emitters .
Due to the fact that it was a new process in terms of location, experimental and climatological conditions, the average (μ) and standard deviation (σ) parameters for mean flow were unknown. Therefore, they were estimated based on preliminary samples, collected through a test run on the 60 emitters of each of the first 4 lateral lines, which worked with tap water. This test was performed before the beginning of the experiment, when the process was under statistical control, according to the recommendation of Montgomery (2009). In order to have greater representativeness, the values obtained in the first test performed on the system with tap water (0.5 hours of operation) were also used.
(1) where,
- population mean;
- sample mean for the i-th sample, and
m - number of samples.
The value was considered as the value for the center line of the control chart. Using the relation between the r amplitude of the samples from the individual
measurements and the standard deviation of the means, the values to construct the control graph were defined by eqs (2), (3) and (4) (Montgomery, 2009):
(2)
(3)
(4) where,
UCL- upper control limit; CL- center line;
LCL - lower control limit;
A2- tabulated constant as a function of the sample
size (Table 1), and
- mean of sample amplitudes.
TABLE 1. Factors A2 and d2 as a function of the sample
size for definition of limits in the control charts, Montgomery (2009).
Sample size “n” A2 d2
2 1.88 1.128
3 1.023 1.693
4 0.729 2.059
5 0.557 2.326
6 0.483 2.534
The value of d2 corresponds to the mean of the
sample amplitude distribution divided by the standard deviation.
Once the centerline values for each type of emitter have been defined, they were compared with the average flow rate provided by the manufacturer to determine if the process is centered or not centered, this latter case when the average flow rate does not correspond to the average rated flow.
The process capability ratio of non-focused processes (PCRk) was calculated according to [eq. (5)] (Montgomery, 2009):
(5) where,
USL- upper specification limit; LSL- lower specification limit, and
- value of the sample mean amplitude divided by
the d2 (Table 1).
In the case of flow, the specification limits were defined as + 5% and -5% of the nominal value defined by the manufacturer, taking into account a maximum variation of 10% in flow within an operating unit of an irrigation system.
In order to graphically visualize the process capacity of the irrigation system, tolerance diagrams were elaborated, where the individual measurements of each sample were plotted together with the specification limits mentioned. With the values obtained in the tests, control charts were elaborated to evaluate the initial condition of the system and the quality of the process at the end of the experiment for each type of emitter using the four types of water, evaluating the average flow according to the position of the emitter in the lateral line. The best performance emitter using tap water throughout the experiment was evaluated and plotted in its performance with the three types of treated sewage effluent. The results of the analysis of effluent and water quality parameters are presented in Table 2.
TABLE 2. Average quality parameter values of water and effluents used.
Parameter UASB Anaerobic filter + Anaerobic digester Anaerobic filter Water
BOD (mg L-1) 39.0 99.0 250.0 6.5
COD (mg L-1) 154.0 436.0 712.0 34.0
pH 7.2 7.1 7.2 6.53
EC (dS m-1) 2.5 1.9 2.0 0.3
TSS (mg L-1) 61.6 44.3 114.6 22.4
Hardness (mg CaCO3 L-1) 273.4 285.2 306.7 153.3
Ca2+ (mg L-1) 74.9 86.3 89.5 54.4
Mg2+ (mg L-1) 21.0 17.0 20.2 4.3
Na+ (mg L-1) 133.1 120.9 116.9 19.0
RESULTS AND DISCUSSION
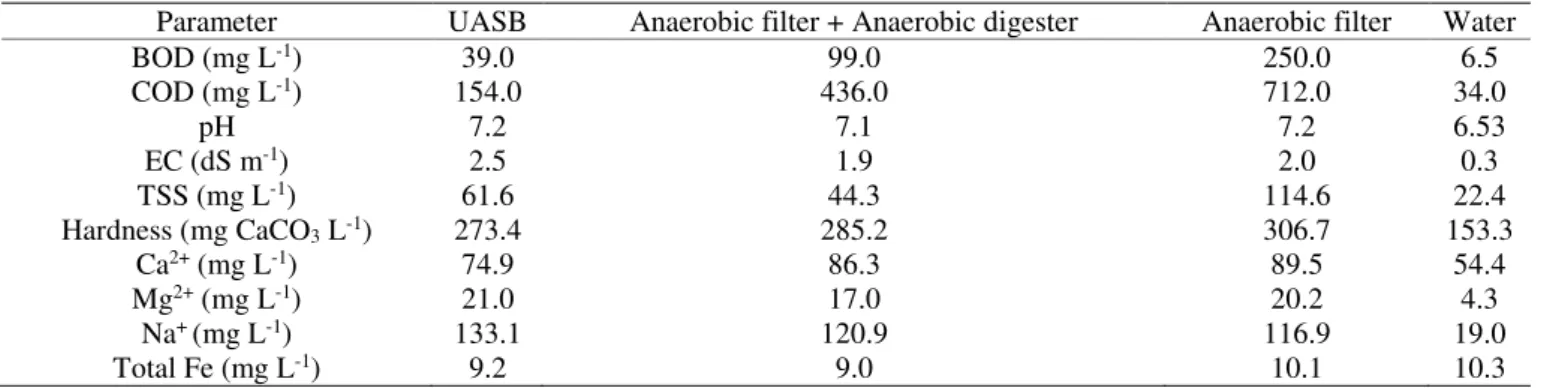
Observing the performance of the irrigation process for the four types of new emitters working with tap water (Figure 2), it was verified that in emitters A and B most of the emitters' individual flows met the specifications of ± 5% of the nominal flow determined by the manufacturer but according to Montgomery (2009) the irrigation process is occurring outside the center, because many points were between the value of the nominal flow and the lower limit of specification of 1.9 L h-1.
The irrigation process in the internal emitters (A and B) met the specifications with a low variation in the
average flow, which corresponds to small values of the manufacturing coefficient of variation (CVf). This fact
indicates that the non-self-compensating inline emitter used is as accurate as the self-compensating inline dripper, since it is working at its defined working pressure to meet its nominal flow rate. In an evaluation of a fertigation system using the self-compensating inline dripper, with nominal flow of 1.6 L h-1, Klein et al. (2015) observed low
average flow variability, corroborating the data presented in Figure 2A. The variability has decreased as the working pressure is reduced (in the range of 150-450 kPa). In the present study, there was great accuracy in the flow values because the pressure used was 100 kPa.
FIGURE 2. Tolerance diagram for individual values of drippers flow rate: A (self-compensating inline dripper), B (non-self-compensating inline dripper), C (self-(non-self-compensating online dripper with upper outlet) and D (self-(non-self-compensating online dripper with side outlet) obtained at the beginning of the experiment. USL – upper specification limit and LSL – lower specification limit.
The self-compensating upper outlet dripper (type C) showed greater dispersion of the unit values of the flow rates, however, 83% of the points were in the middle of the two specification limits (Figure 2C). As a consequence, the mean flow measured in the test was 1.99 L h-1, the closest
to the nominal value 2.0 L h-1. On the other hand, some of
the evaluated drippers applied water outside the desired maximum or minimum flow parameters to the quality standards of an irrigation system. In general, the higher output self-compensating online emitter (type C) was less accurate than the inline emitter (A and B), but is able to better approximate the average flow established by the manufacturer.
The average outflow of the lateral output self-compensating emitter (type D) was 2.19 L h-1, (Figure 2D),
close to the nominal value (2.2 L h-1). However, the depth
applied by each emitter was variable, which affected
higher CVf values, corroborating with Silva et al. (2012) that observed high values of this coefficient in new type D drippers with average flow of 3.75 L h-1 in experiment
developed under field conditions.
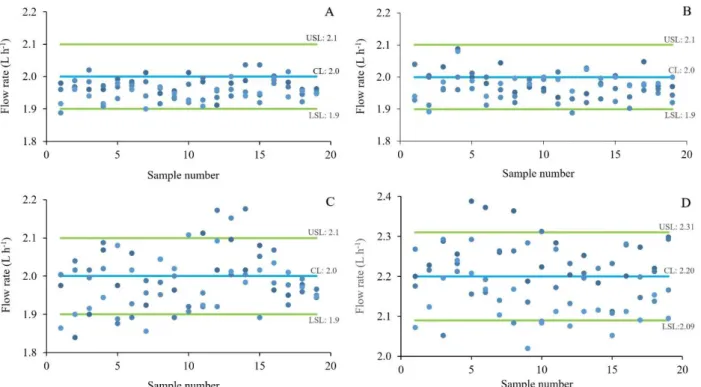
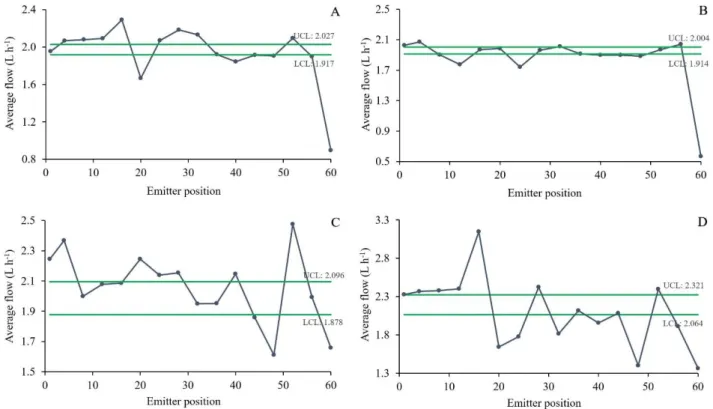
In the control charts presented in Figure 3 are represented the mean values of the flows plotted in the tolerance graphs of Figure 2 for the four emitter types used. The mean flow rates presented a random distribution pattern for all emitters, with data within the control limits and there are no eight or more continuously increasing or decreasing points. According to Montgomery (2009), this indicates that the irrigation process is under statistical control, remembering that the value of the averages is below the nominal flow rate (2.0 L h-1), with the exception
FIGURE 3. Control chart for drippers mean flow: non self-compensating inline dripper (A), self-compensating inline dripper (B), self-compensating online drippers (C and D) calculated in test executed at the beginning of the experiment. UCL – upper control limit and LCL – lower control limit.
At the beginning of the experiment, the new drippers had no attributed causes interfering in the process. The data presented corroborate the results obtained by Hermes et al. (2013) for the coefficient of variation of the flow of one irrigation system and the other of fertirrigation with new drippers mounted in the field using clean water, indicating in general terms that the new emitters do not have manufacturing defects that compromise their hydraulic performance in the field.
The calculated process capacity ratio values were less than 1.0 for all types of drippers, indicating that the process is operating at an unacceptable level (Table 3), since the average flow rate is below the expected value for the process irrigation (2.0 L h-1 for type A, B and C
emitters and 2.2 L h-1 for type D).
TABLE 3. Process-capability ratio (PCRk) calculated for
mean discharge and percentage of range of samples required to attend specifications (±5% of mean discharge).
Emitter PCRk %
A 0.66 152.13
B 0.66 151.99
C 0.40 250.32
D 0.46 218.82
A - self-compensating inline dripper; B - non-self-compensating inline dripper; C - self-compensating online dripper of upper outlet; D - self-compensating online dripper of double-side outlet.
According to Montgomery (2009), for a process with PCRk = 1, the percentage of the emitters that will not
meet the specifications will be 0.27%, according to a normal probability distribution. In the case of the irrigation system evaluated, because these are non-centered processes, there is a tendency of low PCRk values, because
these types of processes are more likely to produce nonconformities. On the other hand, Justi et al. (2010) obtained adequate values for the index, evaluating the Christiansen Uniformity Coefficient (CUC) of a sprinkler irrigation system. The results obtained in the present study differ; therefore, the limits of specification for the flow are more rigorous as to the accuracy of the value of the general average in a drip system, than the CUC for sprinkler irrigation.
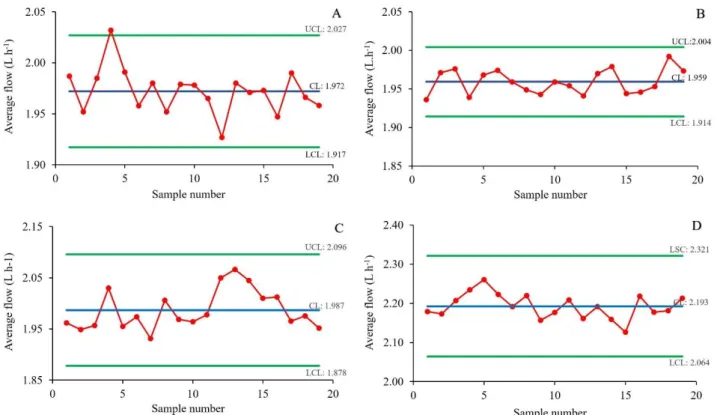
FIGURE 4. Control chart for mean flow of the drippers: inline pressure compensating (A), inline non-self-compensating (B), online self-compensating (C and D), using tap water at end of the experiment (85 running hours). UCL – upper control limit and LCL – lower control limit.
Silva et al. (2015a) obtained similar results for self-compensating drippers working with waters of different saline concentrations. In the present experiment, non-controllable causes may have affected the process, such as clogging and physical changes of the emitters and their components caused by climatic factors. This is evidenced in the control charts. In all cases, the average flow rate of the last drippers in the lateral line is much lower than the Lower Control Limit (LCL), which means that in the final section of the lateral lines the particle accumulation and the low flow velocity influence negatively the performance of the last dripper. On the other hand, it can be observed in Figure 4 that the average flow rate of the self-compensating emitters (A, C and D) for at least seven samples is above the Upper Control Limits (UCL). This is related to the decrease in the action capacity of the compensating membrane, probably affected by temperature and solar radiation. Silva et al. (2015b) evaluated the irrigation process in sugarcane and concluded that the process developed under control, reaching adequate values of process capacity, but with values above the average flow established by the manufacturer.
In the case of online drippers localized pressure loss can influence the phenomenon observed in the last sections of the lateral lines, whose drippers used tap water (Figure
4C and 4D). In a comparative study of loss of load between smooth hoses and hoses with online drippers, Cardoso & Klar (2014) observed local load losses in online drippers up to 62% due to the connections of this type of drippers. For all hose diameters tested by the authors, the type of connection that caused the greatest load loss was that of the self-compensating dripper of double side outlet (Type D).
The non-self-compensating inline dripper (Figure 4B) presented a smaller variation in relation to the average flow and a better approximation to the control limits, except for the last emitter. Omitting this value the average flow increased from 1.85 to 1.94 L h-1, which indicates that
by its characteristics this emitter was able to adapt better to the field conditions working with tap water.
FIGURE 5. Control chart for drippers flow using tap water, treated effluents with upflow anaerobic sludge blanket (UASB), Anaerobic Filter associated with Anaerobic Digester (AF+AD) and Anaerobic Filter (AF) after 85 working hours. UCL – upper control limit and LCL – lower control limit.
Other studies (Silva et al., 2015a; Zocoler et al., 2015) found that after 210 hours of work, the irrigation system continued under statistical control using saline water. Therefore, other characteristics of treated domestic sewage effluents used in this experiment as the suspended solids content, hardness and dissolved solids negatively influenced the irrigation process.
Based on the average flow, the irrigation process with tap water using the non-self-compensating dripper (type B) was better than using the other emitters, in this way; the dripper was chosen to observe its performance over time using treated effluent. Figure 6 shows the control plot for all the tests performed in the non-compensating emitter working with effluent obtained from the combination of anaerobic filter with stabilization pond.
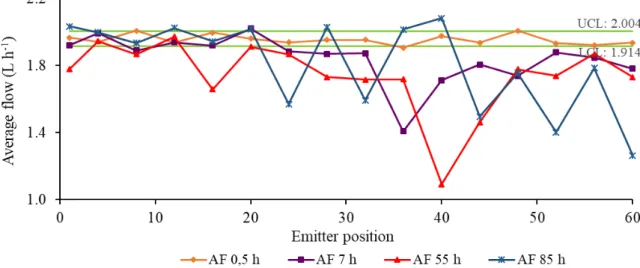
FIGURE 6. Control chart of flow for inline non-self-compensating emitter (B) using effluent obtained from anaerobic filter associated with a stabilization pond (AF) in the four performed tests.
During the first test (0.5 hour work) the process was under control using effluent. Over time, there is a decrease in the quality of the process that is attributed to the quality of the effluent and other non-controllable factors such as the clogging of the emitters. Using the graph of Figure 6 as a tool for monitoring the quality of the irrigation process, it may be recommended to clean and overhaul the system before completing 7 hours of operation, especially in the second half of the lateral lines. Operations such as washing the hoses, applying solutions with sodium hypochlorite or
exchanging defective drippers can be carried out during this period. A periodic and more frequent sampling evaluating other variables such as the Uniformity Coefficient (UC) can be used in irrigation systems in operation to keep the process under control.
CONCLUSIONS
The non-self-compensating inline dripper showed less dispersion of the individual flow values compared to the average.
None of the drippers reached, under field conditions, the average nominal flow rate established by the manufacturer.
The quality of the effluents and their influence on the clogging was identified as the main cause of the reduction in the quality of the irrigation process over time.
Statistical quality control can be a very useful tool for the monitoring of irrigation systems in order to establish corrective measures in a timely manner.
ACKNOWLEDGEMENTS
The authors would like to express gratitude to the Coordination for Improvement of Higher Education Personnel (CAPES), the National Council for Scientific and Technological Development (CNPq), process 308764 / 2003-7 and 403519 / 2013-6 and the National Institute of Science and Technology in Salinity (INCTSal) for the grants and funding of this research.
REFERENCES
Brito RAL, Andrade CLT (2010) Qualidade da água na agricultura e no ambiente. Informe agropecuário 31(259):50-57.
Cardoso GGG, Klar AE (2014) Índice geométrico e perda de carga localizada em conexões de emissores “online”. Engenharia Agrícola 34(6):1114-1127.
Hermes E, Vilas Boas MA, Gomes SD, Gomes BM, Reis CF (2013) Quality control in irrigation and fertigation with cassava processing wastewater into drip system. Journal of Food, Agriculture and Environment 11(2):841-845. Justi AL, Vilas Boas MA, Sampaio SC (2010) Índice de capacidade do processo na avaliação da irrigação por aspersão. Engenharia Agrícola 30(2):264-270.
Klein MR, Vilas Boas MA, Suszek FL, Szekut FD, Melo EL, Gomes BM, Silva BB, Zuculotto T (2015) Fertigation quality with drip irrigation system in grape orchard by using the process capability index. Journal of Food, Agriculture and Environment 13(2):179-183.
Montgomery DC (2009) Introduction to statistical quality control. New Jersey, John Wiley & Sons, 6ed. p179-366. Rowan M, Mancl KM, Tuovinen OH (2013) Evaluation of drip irrigation emitters distributing primary and secondary wastewater effluents. Irrigation & Drainage Systems Engineering 2(3):2-7.
Silva LP, Silva MM, Correa MM, Souza FCD, Silva EFF (2012) Desemprenho de gotejadores autocompensantes com diferentes efluentes de esgoto doméstico. Revista Brasileira de Engenharia Agrícola e Ambiental 16(5):480-486.
Silva JER, Cunha JPAR, Nomelini QSS (2016) Controle estatístico de processo em pulverização hidropneumática na cultura do café. Coffee Science 11(1):11-21.
Silva PF, Matos RM, Lima SC, Neto JD, Lima VLA (2015a) Controle estatístico e índice de capacidade de processo em emissores autocompensantes utilizando água salina. Journal of Agronomic Sciences 4(1):139-150. Silva S, Dantas Neto J, Teodoro I, Santos MAL, Andrade ABA, Cordão MA (2015b) Qualidade da irrigação por gotejamento em cultivos consecutivos de cana de açúcar. Agropecuária Científica no Semiárido 11(2):1-8.
Vale HSM, Arruda LEV, Costa DO, Costa FGB, Batista RO (2013) Potencial de entupimento de um sistema de irrigação por gotejamento operando com esgoto doméstico tratado. Water Resources and Irrigation Management 2(1):63-70.
Zocoler JL, Ribeiro PHP, Silva NF da, Cunha FN, Texeira MB, Soares FAL (2015) Desempenho de um sistema de irrigação por gotejamento com aplicação de água salina. Irriga[Online] 1(1). Available: