http://www.uem.br/acta ISSN printed: 1679-9275 ISSN on-line: 1807-8621
Doi: 10.4025/actasciagron.v38i1.25976
Growth, development and content of flavonoids in calendula
(
Calendula officinalis
L.)
Isabela Cristina Gomes Honório1*, Filipe Pereira Giardini Bonfim1, Sebastián Giraldo Montoya2, Vicente Wagner Dias Casali2, João Paulo Viana Leite3 and Paulo Roberto Cecon4
1
Faculdade de Ciências Agronômicas, Universidade Estadual Paulista “Júlio de Mesquita Filho”, Rua José Barbosa de Barros, 1780, 18610-307, Botucatu, São Paulo, Brazil. 2
Departamento de Fitotecnia, Universidade Federal de Viçosa, Viçosa, Minas Gerais, Brazil. 3
Departamento de Biologia Vegetal, Universidade Federal de Viçosa, Viçosa, Minas Gerais, Brazil. 4
Departamento de Estatística, Universidade Federal de Viçosa, Viçosa, Minas Gerais, Brazil. *Author for correspondence. E-mail: [email protected]
ABSTRACT. Flavonoids, the pharmaco-active compounds studied in this work, in general, are located in the shoots as natural pigments that protect the plants from damage by oxidizing agents. The experiment was conducted in the greenhouse of the Fitotecnia Department, Federal University of Viçosa, Minas Gerais Staty. The experimental design was completely randomized with five treatments and five replications. The treatments were the time of harvest: zero, three, six, nine, and twelve days after anthesis (DAA). The height of the plant (mm), stem diameter (mm), number of leaves and total flavonoid content (%, w w-1) were
determined. We developed growth curves for calendula with growth behavior assessed through time for height, stem diameter and number of leaves. The time of the harvest season positively influenced the total flavonoid contents and the average productivity of flowers, and the highest content of flavonoids was found three DAA. The average productivity of the flowers and the accumulation of flavonoids were heterogeneous among harvest times (0, 3, 6, 9 and 12 days after anthesis). The highest yield of flavonoids was obtained three days after anthesis; therefore, a harvest of the inflorescences is recommended every three days.
Keywords: secondary metabolism, phenolic compounds, harvest season, plant performance.
Crescimento, desenvolvimento e teor de flavonoides em calêndula (Calendula officinalis L.)
RESUMO. Os compostos fármaco-ativos estudado no trabalho, os flavonoides, de maneira geral, estão localizados na parte aérea das plantas. São pigmentos naturais presentes nos vegetais e protegem o organismo do dano por agentes oxidantes. O experimento foi conduzido na casa de vegetação do Departamento de Fitotecnia da Universidade Federal de Viçosa, MG. O delineamento utilizado foi o inteiramente casualizado, com cinco tratamentos e cinco repetições. Os tratamentos foram as épocas de colheita: zero, três, seis, nove e doze dias após a antese (DAA). Foram avaliadas a altura da planta (mm), o diâmetro do caule (mm), o número de folhas e o teor total de flavonoides (%, p p-1). Foi realizada a curva
de crescimento da calêndula e seu desempenho quanto à altura, diâmetro e número de folhas ao longo do tempo de avaliação. A época de colheita influenciou positivamente no teor total de flavonoides e na produtividade média dos capítulos florais, sendo que aos três DAA foi encontrado maior teor de flavonoides. A resposta foi heterogênea entre as épocas de colheita (0, 3, 6, 9 e 12 dias após a antese) quanto à produtividade média das flores e o acúmulo de flavonoides. Aos três dias após a antese obteve-se a maior produtividade de flavonoides, portanto aconselha-se que a colheita das inflorescências seja feita a cada três dias.
Palavras-chave: metabolismo secundário, compostos fenólicos, época de colheita, desempenho vegetal.
Introduction
Calendula (Calendula officinalis L.) is in the order Asterales and is a member of the family Asteraceae; the genus name Calendula is derived from the Latin word Calendae, which means ‘first day of each month’. The genus has 29 species (Missouri Botanical Garden [Mobot], 2013), including
Calendula officinalis L., which is herbaceous and widely cultivated in several countries for ornamental,
medicinal and cosmetic purposes (Ramos et al., 1998). In Brazil, the plant is popular and is known as marigold and wonder-of-gardens. The origin of calendula is in the region of the Mediterranean Sea (Lorenzi & Matos, 2008; Silva Junior, 2006), and the plant is currently cosmopolitan and cultivated in many parts of the world, including Brazil (Bertoni et al., 2006).
exposure, because of the amount of saponins contained in the plant and because the gums and mucilages have large wetting abilities (Nardi et al., 1991). Moreover, calendula has healing and antiseptic properties with actions that are sudorific and analgesic, affect the bile duct, are anti-inflammatory, antiviral and anti-emetic, and tone the skin with vasodilation (Martins, Castro, Castellani, & Dias, 2004). According Pagnano et al. (2008), a tincture of 5% calendula positively influences the generation of new cells involved in wound healing, the fibroblasts, and provides more satisfactory healing than other treatments applied to experimental wounds in rabbits.
The classic knowledge of social groups and communities on the use of plants is essential to discover active compounds and molecules that have some healing action. Data from the World Health Organization (WHO, 2003) show that approximately 80% of the world population uses some type of herb in search of relief from some type of unpleasant symptom. Of this total, at least 30% was of medical value (Martins et al., 2004). According to the WHO report released in the early 1990’s, 65–80% of the population in developing countries depended on medicinal plants as the only form of access to basic health care (Martins et al., 2004). To target new pharmaceutical products against diseases that plague the population of the world, traditional knowledge about biodiversity is an important resource (World Health Organization [WHO], 2003).
In the production of quality medicinal plants, in addition to growing naturally without pesticides, the first aspect for consideration is undoubtedly planting and harvesting at the correct times.
In medicinal species, the variability is high in the production of substances with therapeutic activity. The ideal time to harvest varies according to the plant organ, the stage of development, the time of year and the time of day (Martins et al., 2004) and should be performed when the quality of plants is the highest. The ideal moment to harvest depends on three interrelated elements: the stage of development with the highest biomass, the stage of development with the highest biosynthesis of bioactive compounds, and finally, the seasonal variation in the content of active ingredients through the developmental stages of the plant (Corrêa Júnior & Scheffer, 2009).
Growth analysis describes the physical and physiological condition of the plant in a time interval, and therefore, follows the dynamics of productivity with the measurement of biochemical and physiological indices.
In this context, this study determined the optimum time to harvest the flower heads of marigold as determined by quality and total content of flavonoids. Additionally, the time of greatest production of flower heads of the species was determined.
Material and methods
Commercial marigold seeds, the Isla brand, cultivar ‘Bonina Sortida’, were acquired as defensive-free (naked seeds).
The treatment times were chosen based on the opening of the flower buds of calendula and the longevity of the inflorescences. As the inflorescences began to open, each chapter was labeled with a different colored ribbon for identification at harvest. The first day of the harvest of each inflorescence was documented.
The seeds were sown in July 2011 in a polystyrene tray with 128 cells (40 cm3 per cell)
filled with commercial substrate Tropstrato HA Vegetables®. Two marigold seeds per cell were
planted at a depth of 1.0 cm. After ten days, 'the plants were thinned to one plant per cell.
One month after sowing, two seedlings were transplanted to pots with nine liters of a planting mixture. The potting mixture was composed of the soil mixture (Pure Land), cattle manure and sand.
The experiment was conducted from July to December 2011 in the greenhouse of the Plant Science Department, Federal University of Viçosa, Minas Gerais State, Brazil. The climate classification, according to Koeppen (1948), was type ‘Cwa’, and the geographic coordinates ranged from 42° 52' W to 42° 50' W longitude and from 20° 44' S to 20° 47' S latitude. The design was completely randomized with five treatments and five replications. Each experimental unit consisted of a pot, for a total of 25 experimental units. The treatments were as follows:
0–1 day after anthesis (DAA); 2–3 days after anthesis; 3–6 days after anthesis; 4–9 days after anthesis; and 5–12 days after anthesis.
A week after transplantation, the plants were examined weekly. One month after transplanting, the plants began to flower and were marked. The chapters were collected daily in the dry weather of morning from the beginning of flowering soon after the opening of the inflorescence for three months, as recommended by Pinto and Bertolucci (2002).
and to provide better sanitary quality of the harvested chapters, as lower soil contact with shoots minimizes microbiological contamination (Martins et al., 2004). The objective of the weekly and the final evaluation was to monitor the growth of plants according to the phase of development.
The variables that were evaluated are as follows: number of leaves, stem diameter (mm) and plant height (mm) measured with a digital caliper (Starrett brand 727), leaf area (cm2, AF), weight of fresh
inflorescences (g, PFFL), weight of dried inflorescences (g, PSFL), stem fresh weight (g, PFC), stem dry weight (g, PSC), fresh weight of leaves (g, PFF), weight of dried leaves (g, PSF), and total flavonoid content (%, TTF). The dry mass of stems and of leaves was obtained by drying in a forced-air oven at 75°C to constant weight. The dry mass of inflorescences was evaluated after drying in a forced-air oven at 40°C. The leaf area was estimated with a LI-Cor meter (model LI-3000). The data were subjected to regression analysis using the statistical program Sigma Plot.
The extraction of flavonoids was performed at the Laboratory of Biodiversity, Department of Biochemistry, Federal University of Viçosa (Minas Gerais State) in January 2012.
After drying and weighing, the inflorescences were manipulated and were separated according to the Farmacopéia Brasileira 4th Ed. (Farmacopéia
Brasileira, 2002), which recommends for the drug of
Calendula officinalis: ‘The plant drug consists of whole or ground ligulate flowers, accompanied scarce flowers tubular, separated from the receptacle and involucral, dried bracts’. After separation, the plant material was ground in a Wiley mill; to obtain the plant drug, the material for extraction must have a particle size less than or equal to 0.8 mm.
The content of flavonoids was determined as described in the monograph of calendula in the Farmacopéia Brasileira (Farmacopéia Brasileira, 2002), with some modifications. The entire procedure was performed in triplicate, for a total of 75 samples.
Samples, 0.4 g of the powdered drug (crushed marigold flowers), were weighed and placed in 500 mL flat-bottomed flasks. One milliliter of aqueous 0.5% (w v-1) hexamethylenetetramine was
added to the flasks, with 20 ml of acetone and 2 mL of hydrochloric acid. The mixture was heated under reflux for 30 min. The sample was filtered through cotton into a 100 mL volumetric flask, and the residue of the drug with the cotton was returned to the same flat-bottomed flask. Another 20 mL of acetone was added, and the solution was brought to reflux for 10 min. This procedure was repeated
twice. After cooling, the solution was filtered in the same 100 mL volumetric flask. After this first extraction, the volume of the flask was filled with acetone. Thus, we obtained the acetone extract of calendula.
The second step in the extraction of flavonoids used a separatory funnel with 20 ml of acetone extract and 20 mL of water and then 15 mL of ethyl acetate (per partition). This procedure was repeated three times, with 10 mL portions of ethyl acetate. Subsequently, the fraction in ethyl acetate was washed with two portions of distilled water, and this new solution of acetate was transferred to 50 mL volumetric flask with a volume of ethyl acetate (mother solution, SM). The marigold flavonoid extract was obtained from this new phase.
In the last stage of the extraction, 10 ml of the marigold flavonic solution was pipetted into 1.0 mL of an aluminum chloride reagent (1.0 g of aluminum chloride dissolved in a methanol solution of 5% acetic acid in a volumetric flask, v v-1, 50 mL,
and the volume was completed).
To read the spectrophotometer, the control was prepared by diluting 10 mL of the flavonoid extract in 25 mL in a volumetric flask with a methanol solution of 5% acetic acid (v v-1). After 30 minutes,
the absorbance of the solution was measured at 425 nm in a 1.0 cm cuvette using the zero adjustment control.
The percentage of flavonoids was calculated according to the following Equation 1:
where:
TTF = Total flavonoids; A = Absorbance;
m = Mass of the drug (g); and PD = Loss on drying (%, w w-1).
The loss on drying was determined with drying at 105°C. A 2.0 g sample of ground marigold in a petri dish, previously weighed and tared, was weighed and dried in a forced circulation oven at 105°C for four hours; in the greenhouse, the sample was weighed again when a constant weight was achieved.
The loss on drying was calculated with the following Equation 2:
PD = Loss on drying;
N = Moisture (mass loss in g); P = Sample (g).
The result is expressed in percentage (w w-1) of
flavonoids calculated as hyperosides (C21H20O12).
Results and discussion
Some variables were assessed only at the end of the experiment because they required destructive evaluations of plants. The descriptive statistics of the data are presented (Table 1).
Table 1. Descriptive Statistics of the Observed Data.
Average Deviation CV (%) Minimum value Maximum value
AF (cm2) 4466,7 1322,9 29,6 2059,5 7201,2
PFF (g) 184,7 74,1 40,1 52,3 378,7
PSF (g) 28,2 5,2 18,5 16,6 42,0
PFC (g) 187,0 38,1 20,4 110,4 258,1
PSC (g) 35,8 9,5 26,5 12,4 53,9
PFFL (g) 127,1 54,5 42,8 35,7 233,3
PSFL (g) 19,8 4,7 23,7 10,8 30,3
AF = Leaf Area; PFF = Weight of Fresh Leaf; PSF = Weight of Dry Leaf; PFC = Weight of Fresh Stem; PSC = Weight of Dry Stem; PFFL = Weight of Fresh Inflorescence; PSFL = Weight of Dry Inflorescence.
The overall performance of plants can be evaluated with these variables. Regarding the weights of dried leaves and stems, there was an accumulation of biomass during the study period, but the plant weights were largely composed of water. The leaf area values demonstrated the large photosynthetically active area of the plants. In addition to the availability of water, the soil might have positively influenced leaves, resulting in an increase in the number of leaves and leaf area.
The marigold plants grew exponentially with time (Figure 1), and the maximum height was reached (approximately 37 cm) 53 days after transplantation, stable growth then followed. According to Gomes, Vieira and Heredia (2007), the heights of marigold plants increased linearly during their study, with the average maximum height of 34.02 cm at 120 days after transplanting. The results were consistent with Vieira, Heredia and Ramos. (1999), who found average heights from 29.9 to 39.9 cm in marigold plants fertilized with phosphorus and bed-of-avian; however, linear growth was observed during the study period 90 day cycle. Furthermore, Moreira et al. (2005) found variable plant heights from 28.82 to 39.24 cm in plants treated with five levels of nitrogen and phosphorus.
The early flowering coincided with a period of growth (approximately 15 days after transplantation), and the growth in plant height was promoted because of the expression of a large
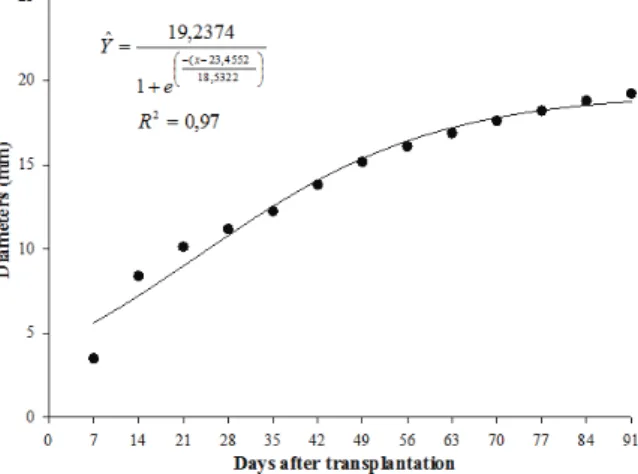
number of inflorescences, which is characteristic of the species (Ferri, 1986). Because marigold plants continue to grow even after the onset of flowering, in this species, vegetative and reproductive phases occurred simultaneously. For the stem diameters, the largest diameter of 20.0 mm was observed 60 days after transplantation. According to Figure 2, the diameter of the stem continued to increase through time, and 60 days after transplantation, the diameter had not reached a maximum; more time would be required to detect the largest diameter. The diameter of the stem is an important indicator of plant growth because it should continue to increase throughout development of the plant. The radial growth of the stem is necessary to provide strong support for the shoot. In some cases, an accumulation of reserves develops in the stems, and the translocation of assimilates would occur steadily to maintain the vital activities of the plant. Additionally, via the stem, plants absorb water and nutrients from the soil for continued growth.
Figure 1. Plant height (mm) of marigolds (Calendula officinalis L.) during the growth period.
Figure 2. Stem diameter (mm) of marigolds (Calendula officinalis
The number of marigold leaves increased exponentially (Figure 3) and had a similar growth curve to that of stem diameter, and after approximately 44 days, the increase in number of leaves stabilized. Leaves are an important indicator of production and determine the use of water by plants. Of major importance, the number of leaves is closely correlated with photosynthetic activity. During plant growth, the photosynthetic activity per leaf area increases with leaf age, until maximum expansion of the leaf, and then decreases thereafter until senescence (Taiz & Zeiger, 2006). If the plant is not in senescence and the soil is at field capacity, the normal supply of nitrogen to the leaves should occur, which increases the rate of photosynthesis and consequently the growth of the plant. Barman and Pal (1994) observed that the highest number of leaves per marigold plant was 146,10, which required 40 g m-2 mineral nitrogen; however, this
relationship was not observed in this study because nitrogen was not applied to the soil and only organic fertilizer was used.
Figure 3. The number of leaves of marigold (Calendula officinalis
L.) during the growth period.
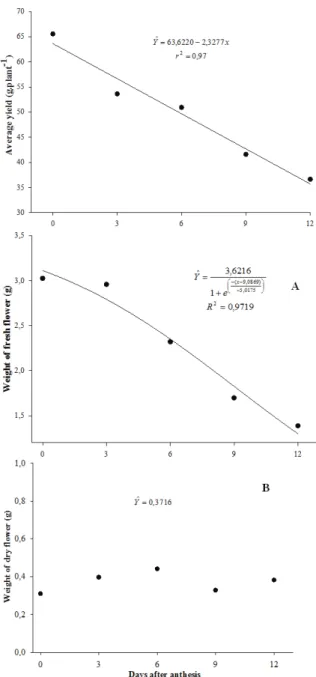
The productivity of marigold chapters in grams per plant is shown in Figure 4. The highest productivity of inflorescences occurred zero days after anthesis (DAA), shortly after anthesis, resulting in a considerable reduction of the loss of important features of these flowers. Additionally, with time, productivity decreased because there was a great loss of parts or all of the flowers as a consequence of the initiation of flower senescence, which caused the gradual loss in characteristics of quality, such as color, appearance and integrity (Figure 4A). At the last harvest of the season (12 DAA), the drop of ligulate flowers and the general aging of the flower were evident, thus beginning the process of seed formation.
Figure 4. Average productivity of flowers, weights (g) of fresh (A) and dry (B) flowers of marigold (Calendula officinalis L.) in five harvest seasons for capitula.
Moreira et al. (2005) found that the mass of dried flower heads of calendula varied according to the dose of P, and the maximum (4.70 g pot-1) was
obtained using 271.7 mg of P pot-1. Because the
mass of the dried flower heads also varied as a function of N application rates, the maximum (0.52 g pot-1) was obtained with a dose of
199.2 mg N pot-1.
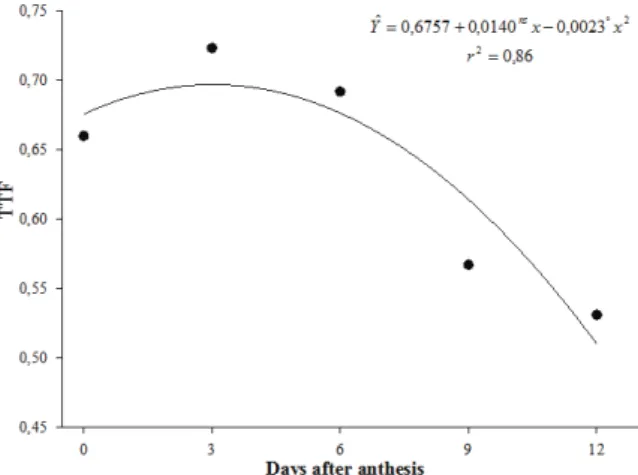
The total flavonoid content was highest in marigolds 3.04 days after anthesis, accounting for approximately 0.70% of total flavonoids (Figure 5), calculated as hyperosides (C21H20O12). According to
the monograph of calendula described in the Farmacopéia Brasileira (Farmacopéia Brasileira, 2002), the drug in marigold plants is found in whole or ground ligulate flowers along with a few tubular flowers, separated from the receptacle and involucral dried bracts. The desiccated sample must contain no less than 0.4% of total flavonoids, calculated as hyperosides (C21H20O12). Therefore, in this study,
all marigold samples met the limit suggested by the pharmacopoeia.
Figure 5. Content of total flavonoids (%) in flower heads of calendula (Calendula officinalis L.) at five harvest seasons. °Significant at 10% by t-test.
The quadratic curve for flavonoids indicated that soon after the flowers opened flavonoid content was not at a maximum. The following day we observed increased production of flavonoids by the plant, which could be explained by the high biosynthetic activity of younger tissues increasing the production of various compounds, including flavonoids. However, with the onset of flower senescence, the accumulation of flavonoids gradually diminished. Nevertheless, on the last date of assessment (12 DAA), sufficient amounts of flavonoids were found (approximately 0.53%) as hyperosides to classify the marigold plant as a drug.
Regarding marigold flavonoids, total flavonoids in ligulate flowers and receptacles are approximately
0.88 and 0.33%, respectively (Hadson, 1985). According Masterová, Grancaiová, Uhrinová, Ubik and Nagy (1991), the glycosidic flavonoids are major constituents of the anti-inflammatory effects of calendula.
Leite et al. (2005), in cultures with various doses of organic fertilizer, found that flavonoid production ranged from 0.52 to 0.60% flavonoids per t ha-1;
however, the authors emphasized that this ratio could increase with attack by aphids and other arthropods. This result, when compared with the present work, showed that with a large amount of organic fertilizer the content of flavonoids was close to the lowest level found in this study. Araújo et al. (2009) used mulch associated with increasing levels of organic fertilizer and obtained a value of 0.70% flavonoids with 59 t ha- 1 of organic compost.
Using chemical fertilization associated with mulch, Borella, Ribeiro, Freato, Mazzo and Barbosa (2011) observed a maximum yield of 0.79% of the total flavonoid content, and using organic fertilization associated with mulch, observed a yield of d 0.70%. The total flavonoid contents, after evaluation of their treatments, were within the range of those found in the present work.
In most studies that examined the content of flavonoids, some treatment was applied to increase the production of this metabolite. However, in this study, a treatment was not applied; for marigolds, the treatments were the time of harvest of the capitula. Nevertheless, high levels of total flavonoids were found, which demonstrated that it is not always necessary to apply large amounts of organic fertilizer for the production of flavonoids. To be classified as herbal drugs, good conduct and proper handling are required to produce large amounts of secondary metabolites in medicinal plants.
Andrade and Casali (1999) provided some recommendations to determine the ideal harvest times, which may vary because of the particular characteristics of each species. Thus, if the flowers are harvested in part, the ideal harvest time is at the beginning of flowering.
Because marigold inflorescences are widely required by the pharmaceutical industry, the optimum time to harvest the inflorescences is when the content of flavonoids is the highest. When the cultivated area is extensive, daily sampling of marigold inflorescences is impractical.
Conclusion
In the cultivation of plants to meet the requirements of producers, it is extremely important that the growth characteristics and the development of the species are understood to properly manage the species to maximize the intended purpose.
For marigolds, management is conducted with regular irrigation and monitoring of leaf development and stem thickening. Additionally, the correct timing of the harvest of capitula is essential because collection of flavonoids is the economic benefit of the plant.
Thus, the optimum time of harvest is every three days, which guarantees to the producer that flowers with maximum productivity, quality and total flavonoid contents will be collected in this period.
References
Andrade, F. M. C., & Casali, V. W. D. (1999). Plantas medicinais e aromáticas: relação com o ambiente, colheita e
metabolismo secundário. Viçosa, MG: UFV.
Araújo, C. B. O., Santos, A. M., Fernandes, L. A., Martins, E. R., Sampaio, R. A., Costa, C. A., & Leite, G. L. D. (2009). Uso da adubação orgânica e cobertura morta na cultura da calêndula (Calendulaofficinalis L.). Revista
Brasileira de Plantas Medicinais, 11(2), 117-123.
Barman, D., & Pal, P. (1994). Effect of nitrogen and phosphorus on seed yield in calendula (Calendula
officinalis L.). Orissa Journal of Agricultural Research, 7(1),
17-21.
Bertoni, B. W., Damião Filho, C. F., Moro, J. R., França, S. C., & Pereira, A. M. S. (2006). Micropropagação de
Calendula officinalis L. Revista Brasileira de Plantas
Medicinais, 8(2), 48-54.
Borella, J. C., Ribeiro, N. S., Freato, A. M. R., Mazzo, K. F., & Barbosa, D. M. (2011). Influência da adubação e da cobertura morta na produtividade e no teor de flavonoides de Calendula officinalis L. (Asteraceae).
Revista Brasileira de Plantas Medicinais, 13(2), 235-239.
Corrêa Júnior, C., & Scheffer, M. C. (2009). Boas práticas agrícolas (BPA) de plantas medicinais, aromáticas e
condimentares (2a ed.). Curitiba, PR: Emater.
Farmacopéia Brasileira. (2002). Comissão permanente de
revisão da farmacopéia brasileira (4a ed.). São Paulo, SP:
Atheneu.
Ferri, M. G. (1986). Fisiologia Vegetal. São Paulo, SP: Pedagógica e Universitária Ltda.
Gomes, H. E., Vieira, M. C., Heredia, Z. N. A. (2007). Density and plant arrangement on Calendula officinalis
L. yield. Revista Brasileira de Plantas Medicinais, 9(3), 117-123.
Hadson, V. (1985). Qualitative and quantitative analysis of flavonoids in plant products of cosmetic interest.
Clujul Medical, 58(4), 378-381.
Koeppen, W. (1948). Climatologia. Buenos Aires, ARG: Gráfica Panamericana.
Leite, G. L. D., Araújo, C. B. O., Amorim, C. A. D., Pêgo, K. P., Martins, E. R., & Santos, E. A. M. (2005). Níveis de adubação orgânica na produção de calêndula e artrópodes associados. Arquivos do Instituto Biológico, 72(2), 227-233.
Lorenzi, H., & Matos, F. J. A. (2008). Plantas medicinais no
brasil: nativas e exóticas cultivadas (2a ed.). São Paulo, SP:
Instituto Plantarum.
Martins, E. R., Castro, D. M., Castellani, D. C., & Dias, J. E. (2004). Plantas medicinais. Viçosa, MG: UFV. Masterová, L., Grancaiová, S., Uhrinová, V., Ubik, K., &
Nagy, M. (1991). Flavonoids in flowers of Calendula
officinalis L. Chemical Papers, 45(1), 105-108.
Missouri Botanical Garden. (2013). W3 tropics. Retrevide from http://www.tropicos.org/Name/2709695.
Moreira, P. A., Marchetti, M. E., Vieira, M. C., Novelino, J. O., Gonçalves, M. C., & Robaina, A. D. (2005). Desenvolvimento vegetativo e teor foliar de macronutrientes da calêndula (Calendula officinalis L.) adubada com nitrogênio e fósforo. Revista Brasileira de
Plantas Medicinais,8(1), 18-23.
Nardi, U.; Cagliardi, L.; Prampolini, F. (1991). La Calendula. Erboristeria Domani, (3), 62-67.
Pagnano, L. O., Baraldi-Artoni, S. M., Pacheco, M. R., Santos, E., Oliveira, D., & Lui, J. F. (2008). Morfometria de fibroblastos e fibrócitos durante o processo cicatricial na pele de coelhos da raça Nova Zelândia Branco tratados com calêndula. Ciência Rural, 38(6), 1662-1666.
Pinto, J. E. B. P., & Bertolucci, S. K. V. (2002). Cultivo e
processamento de plantas medicinais. Lavras, MG: UFLA.
Ramos, A., Edreira, A., Vizoso, A., Betancourt, J., López, M., & Décalo, M. (1998). Genotoxicityof na extract of
Calendula officinalis L. Journal of Ethnopharmacology, 61(1),
49-55.
Silva Junior, A. A. (2006). Essentiaherba. Florianópolis, SC: Epagri.
Taiz, L., & Zeiger, E. (2006). Fisiologia Vegetal (3a. ed.). Porto Alegre, RS: Artmed.
Vieira, M. C., Heredia, N. A., & Ramos, M. B. M. (1999). Crescimento e produção de capítulos de (Calendula
officinalis L.), em função de cama-de-aviário
semi-decomposta e de fósforo. Revista Brasileira de Plantas
Medicinais, 1(2), 45-52.
World Health Organization (WHO). (2003). Draft WHO guidelines on safety monitoring and pharmaco vigilance of
herbal medicines. Amsterdan, NLD: WHO.
Received on December 8, 2014. Accepted on February 24, 2015.