A calorimetry system for metabolism trials
[Sistema de calorimetria para estudos de metabolismo]
N.M. Rodríguez1, W.E. Campos1, M.L. Lachica2, I. Borges1, L.C. Gonçalves1, A.L.C.C. Borges1, E.O.S. Saliba1
1
Escola de Veterinária - UFMG Caixa Postal 567 30123-970 – Belo Horizonte, MG
2
Dep. Nutrición Animal - Estacion Experimental del Zaina – Granada, Espanha
ABSTRACT
An indirect calorimetry system for rapid determination of CO2 and CH4 production and O2 consumption
to estimate heat production of animals was built at Escola de Veterinária da Universidade Federal de Minas Gerais, Brazil. Procedures for determination of correction and calibration factors for gas analyzers and the whole system, using standard test gases were described. In addition, a metabolic trial was performed to evaluate heat production of lambs fed ad libitum. It is concluded that the system is suitable for heat production determinations in small and medium size animals.
Keywords: calibration, open circuit, respirometry
RESUMO
Um sistema de calorimetria para a determinação rápida da produção de CO2 e CH4 e do consumo de O2 de animais para o cálculo da produção de calor foi construído na Escola de Veterinária da Universidade Federal de Minas Gerais. Foram descritos os procedimentos para a determinação dos fatores de correção dos analisadores e calibração do sistema utilizando-se gases padrão. Adicionalmente, um ensaio de metabolismo foi realizado para se avaliar a produção de calor de ovinos alimentados ad libitum. Conclui-se que o sistema está apto para determinações de produção de calor em animais de pequeno e médio porte
Palavras-chave: calibração, circuito aberto, respirometria
INTRODUCTION
Calorimetry is the measurement of heat production. By means of calorimetry the energy cost of leaving can be estimated. In energy metabolism studies, heat produced by animals is measured as total heat production, which includes the heat used for maintenance and wasted as heat increment. The energy retained in body tissue (and milk in lactating animals or fetal growth in pregnant animals) is calculated as the difference between total gross energy intake and
Recebido em 30 de novembro de 2006 Aceito em 28 de fevereiro de 2007 E-mail: [email protected] Apoio: CAPES/CNPq/FAPEMIG
energy outputs from feces, urine, methane, and heat production.
exchange associated with the oxidation of energy substrates is measured and heat production (HP) is calculated from the stoichiometry of substrates oxidation. Most of them operate following the open-circuit principle, with the animal confined in a respirometric chamber (Agnew and Yan, 2005)
McLean and Tobin (1987) gave a comprehensive account of different systems of calorimetry. Blaxter (1967) indicated that earlier workers (Armsby, 1913) had reported that there was little difference in accuracy between the two techniques.
Kleiber (1975) cited different systems of calorimeters for use with mammalians and fowls, and considers the open and closed circuit respiration chambers to be practical and suitable systems in evaluating energy metabolism. This article discusses the construction and function of a medium size chamber appropriate to operate as an indirect calorimeter with small ruminants,
swine, dogs, and fowls, built at the Escola de Veterinária da Universidade Federal de Minas Gerais, Belo Horizonte, Brazil.
MATERIAL AND METHODS
The chamber was built with 6mm transparent acrylic resin plates with external dimensions of 1.2m (wide) x 2.0m (height) x 2.1m (length) fixed by an external aluminum frame (Fig.1). On the top, there is a steel bar holding the whole chamber which can be elevated and lowered up and down with an electric device. This bar also holds a condensing system that removes water vapor and returns the air to the chamber. There is a false ceiling situated 5cm below the roof and 10cm form the side, in order to avoid draughts. This condensing system is connected to a fan that also revolves the air inside de chamber allowing a proper mix of the gases and reliable samples of air.
Figure 1. Scheme of a respiratory system built at a Universidade Federal de Minas Gerais, (1: air entry, 2: base of the chamber with a canal fill up of water, 3: condensing system, 4: fan, 5: false ceiling, 6: flowmeter, 7: oxygen analyzer, 8: carbon dioxide analyzer, 9: methane analyzer, 10: computer system).
Since the chamber has no floor, it is placed on a steel base which has a channel (5cm wide x 5cm depth) filled of water that surrounds the lower edges when the chamber is placed on the
continuously in an aliquot of air sucked from the chamber.
Chamber air is suctioned continuously through a 3.6cm (internal diameter) PVC tubing at a controlled flow rate that can vary from 10 to 100 lmin-1. The suction is controlled by a mass-flow meter that automatically corrects the air volume (flow) for temperature, pressure and humidity. At the exit of the chamber there is a filter to keep debris away from the analytical system. At the opposite side of that tubing there is an entry for atmospheric air derived from the outside of the building ensuring a constant composition of the entering air into the chamber.
When the chamber is operating as an open circuit, an aliquot sample air is continuously sent to the analysis equipment by a pump at a determined flow (150 to 200ml/min) and the excess is thrown away.
Another pump directs the gases into the analyzers at a constant rate, after the samples are filtered and passed through a 1litter flask containing 100% (W/V) calcium sulfate to absorb moisture. The analyzers are mounted in serial connection and the results are automatically recorded by a specific software every tree to six minutes.
The analyzers were adjusted with gases of known concentrations (100%N2, 21%O2:79%N2,
5%CO2:95%N2 and 1%CH4:99%N2).
Standardized O2:CO2:N2 mixtures were also used
at the following concentrations: 21:0:79; 21:0.5:78.5; 21:1:78 and 20.5:1:78.5. These gases were alternatively injected in the analyzers and the results automatically recorded by a computer system. This procedure was performed five times for each mixture and the average of these replicates used to calculate the correction factor for O2 analyzer.
Besides adjusting and calibrating the analyzers, it is also necessary to check the whole system efficiency for gases detection by simulating the gas exchange produced by an animal inside the chamber. This evaluation was made injecting pure gases CO2 (99.99%), CH4 (99.99%) and N2
(99.99%) for five hours and the volume of injected gases were obtained gravimetrically considering the density of CO2 (1.9648g/l), CH4
(0.7162g/l) and N2 (1.2509g/l). Gases were
injected for 6h and the total measurement period was 21h long which was sufficient to reproduce
an experimental run, once sufficient gas was released for an acceptable accuracy.
The calibration was performed with a flow rate of 70l/min which is adequate for experiments using adult sheep. Calibration factors were established comparing the volume of gases injected and detected by the system.
To validate the system, experimental data was obtained with 14 wethers housed in metabolic cages and fed ad libitum. Eight were fed 25% of Tifton hay (Cynodon spp.) and 75% concentrate and six were fed Tanzania grass silage (Panicum maximin – Tanzânia). The intake was evaluated for at least 15d on both groups and animals were adapted to stay in the chamber for, at least, 24h prior the respirometry trial. Animals were considered adapted when the dry mater intake inside of the chamber was similar to those values observed during 15 preceding days. For wethers fed Tifton hay and concentrate, the same animals where evaluated four times in four different periods with eight days interval. For those fed Tanzania grass silage one measurement was made for each animal resulting in a total of 38 observations of 20 hours each.
To prevent the excess of ammonia inside the chamber, sulfuric acid was added to the box where urine was collected at the bottom of the metabolic cage.
The calculations used can be summarized as follows:
All the volume of gases were reduced to standard temperature and pressure, dry (STPD) by using the equation:
2
H O STPD
P P 273
V V '
273 T 760 −
= × ×
+ , where
V’= measured volume (at ambient conditions); T= temperature in oC;
P=ambient barometric pressure in mmHg (corrected to the static pressure);
O H
P
2 = partial pressure of water vapor and the
numbers are constants.
VN2 in = VN2 out
Vair in × [N2] in = Vair out × [N2] out
[ ]
[ ]
2 2 V air out N out V air in=N in ×
CH4 (l):
VCH4 produced = VCH4 out – VCH4 in
VCH4 produced = Vair out × [CH4] out
CO2 (l):
VCO2 produced = VCO2 out – VCO2 in
CO2 produced = (V air out × [CO2] out) - (V air in × [CO2] air)
CO2 produced = (V air out × [CO2] out) - [ 2]
CO air
100 × V air in O2 (l):
VO2 consumed = VO2 in – VO2 out
VO2 consumed = (V air in × [O2] air) - (V air out × [O2] out)
VO2 consumed = V air out × ([N2] out × [ ] [ ] 2
2
O air 100 N air
100
- [O2] out)
Respiratory quotient (RQ) was calculated as CO2
produced/O2 consumed.
Heat production (HP, kJ) were calculated according to the Brower’s equation (Brower, 1965) for O2 consumption (l), CO2 (l), CH4 (l)
and urine-N (Nur, g) production:
HP (kJ)= 16.18O2 + 5.02CO2 – 2.17CH4 – 5.99Nur
RESULTS AND DISCUSSION
The respiration chamber built at the EV-UFMG is a modern system that can be used as an indirect open or, as confinement system (Laulainé, 1894; Lachica et al., 1995). The volume of 5,237 liters allows its use as confinement system for small animals, as fowls, for up to 24h, or larger animals like swine or lambs for shorter lasting measurements. This time is defined by a CO2 concentration that can
not exceed 1%, since higher concentrations cause increased respiration rates, and therefore higher energy expenditure (Weissman et al., 1984; McLean and Tobin, 1987). At this level, measurements have to be interrupted and the chamber opened for air renovation.
The respiration chamber can also be used as an open system, since it is equipped with an air entry and a flowmeter that enables long trials with small ruminants and adult swine, keeping CO2 concentration at the desired levels. The
system described by this paper makes reference only to the indirect open system.
The chamber was frequently tested for leaks by altering the atmospheric pressure inside and then observing changes in water level in a glass manometer. The chamber was found to be air tight. Furthermore, chamber and atmospheric air samples are pushed into an electronic device equipped with electro-valves that in an alternate way send sub-samples to the gas analyzers. That device guarantees that for every sample analyzed from the chamber there is a simultaneous analysis of the air composition, assuring a reliable base line which is more secure than working with a constant base line assuming atmospheric values of 20.95% of O2, 0.034 of
CO2 and 0% of CH4.
Another issue that is a guarantee of reliable results is the precision of the equipments. The CO2 and CH4 analyzers have a range of 0.0001 to
on a paramagnetic principle with a range of 0 .0001 to 100%.
As O2 paramagnetic analyzers are influenced by
the CO2 concentration, a correction factor was
established. For such purpose a variant of the system followed by Aguilera and Prieto (1985) was used. The use of standardized O2:CO2:N2
mixtures to calculate the correction factor for O2
analyzer resulted to the following equation:
(
2)
C
[O2] =[O2]− 0, 0053X +0, 0117X where
C
[O2] is the corrected value, [O2] is the recorded
value and X is the percentage of CO2 related to
O2 (r2=0.999). This shows the need of working
with correction factors due to the influence of CO2 on O2 determination by analyzers that use
paramagnetic principle, otherwise, the values obtained could be overestimated.
Calibration factors (Table 1) were established comparing the volume of gases injected (I) and detected (D) by the system.
Table 1. Results of calibration of the respirometry equipment (gas analyzers plus chamber) by gas dilution
Gas
O2 CO2 CH4
0 .9985 1.0529 1.1920
0.9985 1.0494 1.1979
1.0006 1.0572 1.2082
1.0007 1.0536 1.2038
1.0025 1.0727 1.1520
1.0026 1.0693 1.1399
1.0027 1.0742 1.2257 1.0035 1.0633 1.1060
Calib
ratio
n facto
rs
1.0012 1.0616 1.1782 Average
±SE
1.0012
±0.0018
1.0616
±0.0090
1.1782
±0.0383
As plotted in Table 1, calibration factors were very close to one showing the adequacy of the whole system, which confirms the absence of leaks and good performance of the analyzers.
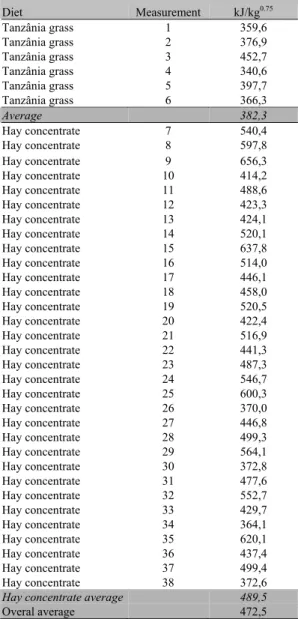
The average daily heat production of the wethers fed with Tifton hay and concentrate was 489,5kJ/kg0.75 (Table 2). For animals fed
Tanzania silage heat production was lower, 382,3kJ/kg0.75. This difference was probably due to the lower DM intake of the animals fed Tanzania silage comparing to those fed Tifton hay and concentrate (612 vs 1200gDM/animal/day). In addition, the higher digestibility of the concentrate in comparison to forages may have contributed for a higher heat production.
Table 2. Heat production of wethers consuming Tanzania grass silage or Tifton hay- concentrate (25:45) diets
Diet Measurement kJ/kg0.75
Tanzânia grass 1 359,6
Tanzânia grass 2 376,9
Tanzânia grass 3 452,7
Tanzânia grass 4 340,6
Tanzânia grass 5 397,7
Tanzânia grass 6 366,3
Average 382,3
Hay concentrate 7 540,4
Hay concentrate 8 597,8
Hay concentrate 9 656,3
Hay concentrate 10 414,2
Hay concentrate 11 488,6
Hay concentrate 12 423,3
Hay concentrate 13 424,1
Hay concentrate 14 520,1
Hay concentrate 15 637,8
Hay concentrate 16 514,0
Hay concentrate 17 446,1
Hay concentrate 18 458,0
Hay concentrate 19 520,5
Hay concentrate 20 422,4
Hay concentrate 21 516,9
Hay concentrate 22 441,3
Hay concentrate 23 487,3
Hay concentrate 24 546,7
Hay concentrate 25 600,3
Hay concentrate 26 370,0
Hay concentrate 27 446,8
Hay concentrate 28 499,3
Hay concentrate 29 564,1
Hay concentrate 30 372,8
Hay concentrate 31 477,6
Hay concentrate 32 552,7
Hay concentrate 33 429,7
Hay concentrate 34 364,1
Hay concentrate 35 620,1
Hay concentrate 36 437,4
Hay concentrate 37 499,4
Hay concentrate 38 372,6
Hay concentrate average 489,5
Overal average 472,5
above maintenance (Blaxter, 1964) which suggests a good performance of the respirometric system evaluated here. Furthermore, the respiratory quotient (RQ) was equal to 1.0 which is an expected value for animals fed ad libitum (Kleiber, 1975).
CONCLUSIONS
The respirometric chamber built and evaluated is suitable for methane and heat production determinations in small and medium size animals.
REFERENCES
AGNEW, R.E.; YAN, T. Calorimetry. In: DIJKSTRA, J.; FORBES, J.M.; FRANCE, J. (Eds). Quantitative aspects of ruminant digestion and metabolism. 2.ed., 2005. 736p.
AGUILERA, J.F.; PRIETO, C. An open respiration unit for calorimetric studies with small animals. Arch. Tierernähr., v.35, p.825-883, 1985.
AGUILERA, J.F.; MOLINA, E.; PRIETO, C. et al. Estimación de las necesidades energéticas de mantenimiento en ganado ovino de raza segureña. Arch. Zootec., v.53, p.89-97, 1986.
ARMSBY, H.P. The Nutrition of farm animals. New York: Macmillan, 1913. 346p.
BLAXTER, K.L. Metabolismo energético de los ruminates. Zaragoza: Acribia, 1964. 314p.
BLAXTER, K. L. Techniques in energy metabolism studies and their limitations. Proc. Nutr. Soc., v.26, p.86-96, 1967
BROWER, E. Report of sub-committee on constants and factors. Symposium of Energy Metabolism held at European Association for Animal Production, 1965. London: EAAP Academic, 1965. p.441-443.
KLEIBER, M. The fire of live, an introduction to animal energetics. New York: Nobel Offset Printers, 1975. 453p.
LACHICA, M.; AGUILERA, J.F.; PRIETO, C. A confinement respiration chamber for short gaseous exchange measurements. Arch. Anim. Nutr., v.48, p.329-336, 1995.
LAULANIÉ, F. De la marche des alterations de l'air dans l'asphixie en vase clos. Arch. Physiol. Norm. Pathol., v.26, p.845-859, 1894.
MCLEAN, J.A.; TOBIN, G. Animal and human calorimetry. Cambridge: Cambridge University, 1987.
WEISSMAN, C.; ASKANAZI, J., MILIC-EMILI, J.J.M. Effect of respiratory apparatus on respiration. J. Appl. Physiol., v.57, p.475-480, 1984.
WILMORE, J.H.; COSTILL, D.L. Adequacy of the Haldane transformation in the computation of exercise V O2 in man. J. Appl. Physiol., v.35,