of Chemical
Engineering
www.abeq.org.br/bjchePrinted in BrazilVol. 34, No. 02, pp. 481 - 491, April - June, 2017 dx.doi.org/10.1590/0104-6632.20170342s20150331
ANAEROBIC DIGESTION OF MUNICIPAL
BIOWASTE FOR THE PRODUCTION OF
RENEWABLE ENERGY: EFFECT OF PARTICLE SIZE
B. A. Parra-Orobio
*, P. Torres-Lozada and L. F. Marmolejo-Rebellón
Universidad del Valle, EIDENAR School, Calle 13 # 100-00, 3212100, Cali, Colombia. E-mail: [email protected]
(Submitted: May 25, 2015; Revised: October 21, 2015; Accepted: February 12, 2016)
Abstract – In recent years, Anaerobic Digestion (AD) has become an important technological alternative for the management of municipal biowaste (MBW) for both pollution control and obtaining renewable energy such as methane. One of the factors that most afects the AD of MBW is the particle size, particularly in the hydrolysis and lag phases, this last being in general the limiting stage of solid waste AD. This research evaluated on a laboratory scale the AD of MBW by evaluating Biochemical Methane Potential (BMP) at a temperature of 30 °C during 30 days and the inluence of particle size. The particle sizes ranged between < 2 mm to 12.5 mm. Along the study, better results were observed for particle sizes < 2 mm, obtaining productions of methane and electrical energy of 128 mL gVS-1 and 2960.4 kWh week-1 respectively (19% higher than in reactors with larger particles), thus indicating lower costs for design and maintenance.
Keywords: Anaerobic digestion; Biowaste; Methane; Municipal solid wastes; Renewable energy.
INTRODUCTION
The increasing generation of municipal solid waste (MSW) represents a global problem that has worsened in recent years due to population growth, changes in consumption habits, concentration in urban cores, and the lack of planning. According to a report by the World Bank, in 2012, the generation of MSW reached 1.3 billion tons and it is expected to increase to 2.2 billion tons by 2025 (TWB, 2012).
Municipal biowaste (MBW) comprises the predominant fraction of MSW. These are composed of horticultural waste, pre- and post-consumption food waste from dwellings and commercial establishments, such as restaurants and small
grocery stores (Oviedo et al., 2012). In Colombia, MBW
constitutes approximately 65% of MSW, and its reuse and exploitation has increased in recent years primarily
by activities like composting and recycling (Oviedo et
al., 2014). Nevertheless, anaerobic digestion (AD) is an
emerging technology that is also promising because the main product generated is biogas, which is an energy-rich product and constitutes an alternative renewable energy source to fossil sources (Hartmann and Ahring, 2005).
Particle size is a factor that can afect the process
performance during anaerobic digestion of MBW
(AD-MBW). By reducing the particle size the available speciic surface area increases and inluences the hydrolysis rate in
AD and the lag phase, which is the stage of adaptation of microorganisms to the substrate. Moreover, the sizes of the smallest particles can lead to shorter retention times, which entails lower operational costs. Although In the literature
there are diferent recommended particle size ranges
(0.1-30 mm), it is recommendable to evaluate this aspect for each particular case (Zhang and Banks, 2013).
Banks et al. (2010), in a large scale study, found that
methane production was achieved without reaching the point at which particle sizes can cause excessive production
of volatile fatty acids (VFAs). In addition, Izumi et al.
(2010) observed that an excessive reduction in particle size could cause VFAs accumulation, which would decrease the gas production rate and the solubility of the materials
subjected to digestion. Lindner et al. (2015), evaluated
diferent milling times (0 to 10 min). It was noticed that
the pre-treatment process is required in order to achieve an increase in methane production. According to these
indings, an optimal range for the particle size still has not been deined nor the variability in sizes obtained during the
crushing process of waste, which are parameters that can
inluence the overall kinetics of the process.
In this study, the efect of particle size on AD-MBW
from a municipality that performs separation at the source and selective collection through biochemical methane potential (BMP) tests was evaluated on a bench scale.
MATERIALS AND METHODS
Experimental Location
The tests were performed at an altitude of 970 m above sea level with an average ambient temperature of 23.6°C and a controlled experimental temperature of 35 ± 0.5°C.
Experimental phase
The MBW were provided by a solid waste management plant (SWMP) of a Colombian municipality in which integrated solid waste management is performed, including separation at the source and selective collection. On
average, 10.2 t week-1 of MBW are generated, of which,
66% has the potential to be digested (Oviedo et al., 2014). The program of MSW sampling and characterization used
ive samples; these samples were collected following the
recommendations of Sakurai (2000).
Prior to physicochemical characterization and BMP testing, all inert material (stones, metal, charcoal, bones) and slowly degrading material (plastic, rubber, and leather)
were removed from the MBW samples (Mukherjee et al.,
2008). Afterwards, the materials were subjected to grinding
as recommended by Sharma et al. (1988) using a Waring
Commercial CB15 blender at a speed of 15800 rpm for 1 minute (standard equipment speed).
Physicochemical characterization of the MBW was performed according to the ICONTEC (2004) and APHA (2005) guidelines in terms of the following variables: pH (units), moisture (%), total alkalinity (TA) and bicarbonate
alkalinity (BA) (mg CaCO3 L-1), volatile fatty acids (mg
L-1), acetic acid (%), propionic acid, butyric acid (%), total
carbon (%), total and iltered chemical oxygen demand
(COD) (mg L-1), biochemical oxygen demand after 5
days (BOD5) (mg L-1), total nitrogen (%), total ammonia
nitrogen (mg L-1), total solids (TS) and volatile solids (VS)
(mg L-1). The free ammonia nitrogen was determined in
accordance with Sterling et al. (2011).
In order to keep the most favorable conditions for anaerobic digestion, an inoculum was used for the
BMP tests at a concentration of 1.5 gVS L-1. This came
from an anaerobic digester of a municipal wastewater treatment plant (MWWTP) which uses chemically assisted primary treatment and was characterized in terms of the physicochemical variable determined for the substrate. The MBW samples and inoculum were maintained at a temperature not exceeding 4°C for periods of less than seven days prior to setting up the tests.
The analysis of the results of the physicochemical characterization of the MBW and the inoculum were performed through descriptive statistical methods.
Inluence of Particle Size on the AD of MSW MBW
The quantiication of biogas was performed via the
manometric method using an Oxitop® system, which is a pressure-monitoring instrument that consists of a 250 mL reactor with a measurement head that is inserted in the mouth of the reactors and a control that uses an infrared interface for data transfer. The tests were performed in a WTW TS 606-G/2-I incubator with intermittent manual
agitation for 720 hours (Aquino et al., 2007). The working
volume was 200 mL, which left a free space of 50 mL to store the biogas produced based on the recommendations of Aquino et al. (2007).
Considering that the techniques used to determine methane production are standardized methods aimed at guaranteeing the most favorable conditions to bolster the AD of the substrate, a solution of macro- and micronutrients
was used (Owen et al., 1987), and the pH was adjusted
to 7.0 with a 4% NaHCO3 solution to maintain stable
conditions in the BMP tests. Each experimental unit had its respective duplicate (n=2) and a control (inoculum with distilled water) for the determination of endogenous methane production. To ensure that the manometric biogas measurement corresponded predominantly to methane, carbon dioxide was captured by means of NaOH pellets
(Pabon et al., 2012), and the residual gas composition was
veriied via gas chromatography (GC2014 chromatograph).
The volume of methane at standard conditions (SC)
was determined in accordance with Giménez et al.
(2012) in which the proportion of dissolved methane was considered. The experiments were conducted at an S/I ratio of 0.25 gVSsubstrate gVSinoculum-1 (Raposo et al., 2006).
The steps were performed during the pretreatment
stage, where 1 kg of an MBW sample was taken at diferent
grinding times (60s-T1, 120s-T2, and 180s-T3) at a speed of 15,800 rpm (standard speed of the instrument) to obtain
diferent particle sizes as suggested by the literature (<30
Approximately 500 g were extracted from the sample to determine the particle size. This portion of sample was dehydrated in an oven at a temperature between 55-60°C for 48 h or until a constant humidity was reached. The particle size of the dehydrated samples was determined
using the sieve analysis technique for ine and coarse
aggregates (ASTM C136-01) (Bojórquez et al., 2011).
Sieves of sizes of ½, No. 4, No. 8, No. 10, No. 16, and No. 60 were used. The predominant particle size was determined in each reactor via granulometry curves, and the D60 and D10 values were likewise considered; with these
the uniformity coeicient was found (Cu) by applying Eq. 1. A value of Cu < 3 indicates that the particle size
distribution is uniform, whereas values of Cu > 3 indicate that the particle size in the sample is heterogeneous.
In Eq. 1, Cu is the uniformity coeicient, D60 is the
particle size that is less than or equal to 60% of the MBW weight, and D10 is the particle size that is greater than or equal to 10% of the MBW weight.
Each of the crushed samples was subjected to AD, maintaining the aforementioned conditions of the substrate/ inoculum (S/I) ratio and pH. Figure 1 shows the scheme for this phase of AD of MBW.
Cu =D60 D10
Figure 1. Schematic of the setup.
To determine the efect of the evaluated factor, a
randomized, non-parametric permutation test with p<0.1
was conducted, in which the response variable was the BMP. The statistical analysis was performed by employing the R i386 3.0.2 statistics package.
To analyze hydrolysis as a limiting stage, a irst-order
kinetics model (Liew et al., 2012) and the well-known
Gompertz model were applied. In the irst-order kinetics
model, Eqs. 2 and 3 were applied to obtain the concentration
(mol L-1) from the pressure and the hydrolysis constant,
respectively.
where M(t) is the methane concentration at time t (mol L-1),
P(t) is the pressure registered by the OxiTop® instrument (atm) at time t, R is the ideal gas constant (atm L mol-1 K-1),
and T is the experiment temperature (K).
where ln is the natural logarithm; t is the time (d), Mu is the
methane production at the end of the experiment (mol L-1),
M is the remaining gas production over time (M=Mu-M(t)) and Kh is the hydrolysis constant (d-1).
The modiied Gompertz model can identify signiicant
parameters related to the hydrolysis stage of anaerobic digestion, such as the maximum production rate, maximum production and lag phase, which emphasize the time when the substrate transforms and its relation to the stage of methane production. The model corresponds to a sigmoidal function expressing methane production in the reactor as a function of time (Eq. 4) (Lay et al., 1997):
� � = �(�)
� ∗ �
�� ��� =�ℎ�
���4 � =����exp −��� ����
exp( 1)
���� � − � + 1 (1)
(2)
(3)
��= BMP x 8.7917x 0.39 x GMSW x FMB
Table 1. Equations for determining GHG
Scenario Equation Parameter
Landill
BMP: Biochemical Methane Potential (m3 t-1)
BMPd: Biochemical Methane Potential dissolved
(m3 t-1)
DCOf: Fraction of the degradable organic carbon (0.5)
MWCH4: Molecular weight methane (16 g mol
-1)
F: Value of global warming potential of methane (21)
VSC: Volumen standard conditions (22.4 L)
MWCO2: Molecular weight carbon dioxide (44 g
mol-1)
0.39: Is the factor of electrical energy production based on internal combustion
C: Heat value of methane (35.9 MJ m-3)
FE: GHG emission factor of power generation with capacity more than 1000 MW (0.8578 kg-CO2kWh
-1)
Anaerobic Digestion
G1 and G4: Quantify direct emissions to the atmosphere; G2: emission from power generation; G3: GHG ofsetting by power generation; GTlandill:
Carbon footprint for landill and GTAD: Carbon footprint for anaerobic digestion
where VCH4(t) is the cumulative methane production (mL
h-1), P
max is the maximum cumulative production at the
end of the experiment (mL), Rmax is the maximum rate of
methane production (mL h-1), is the lag phase (d); and t is
the methane generation time (h).The correlation coeicient
(R2) was used as criterion to assess the itted models
through the software Polymath 5.0 and Microsoft Excel 2007.
Furthermore, to theoretically understand the potential for electrical energy generation via methane produced during AD of MBW, Eq. 5 was used by considering the
fraction of MBW at the locality (Schievano et al., 2014).
where EE is the electrical energy generated (kWh week
-1), BMP is the biochemical methane potential of the MBW
(m3 kg-1), 8.7917 is the conversion factor of methane to
kWh (kWh m-3CH
4
-1), 0.39 is the factor of electrical energy
production based on internal combustion, GMSW is the
generation of MSW in the locality (t week-1), and FMB is
the fraction of MBW present in MSW (66%).
Finally, the reduction of greenhouse gas (GHG) was
quantiied and a net energy balance was carried out for
each of the ranges of particles obtained. To determine GHG
reduction equations suggested by IPCC (2006) and Liu et
al. (2012) were used (See Table 1) and two scenarios were
considered. In the irst, the disposal of MBW in landills
is emphasized, taking into account that the theoretical
methane production was 240m3 t-1, in agreement with
previous studies in the MBW of the town (Parra et al.,
2014). On the other hand, the second scenario relates to the use of MBW by DA, considering direct methane emissions into the atmosphere equivalent to 10% of total production in the form of dissolved methane.
For net energy balance (Enet) in each of the treatments
Serrano et al. (2015) recommended the use of equations
12 to 14.
where Ein is the energy entering the process (J gVS-1), P d
is the power consumption of the grinding machine (1800 J s-1), t is the time of grinding (s), C
s is the concentration of
substrate in each experimental unit (gVS L-1) and V
u is the
efective volume of the reactor (L).
where Eout is the energy that is generated during the process
(J gVS-1); C heat value of methane and F
r is the percentage
recovery of methane (90%).
RESULTS AND DISCUSSION
Characterization
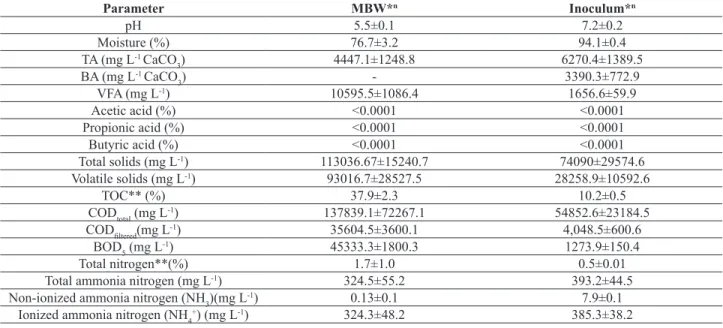
The results of physicochemical characterization of MBW and inoculum are presented in Table 2.
�
��=
�
�∗ � �
⁄
�∗ �
��
���=
��� ∗ � ∗ �
��
���=
�
��− �
����
1=
��� ∗ ���
�⁄
��
��4∗ � ∗ �
���
2=
��� ∗ ���
�⁄
�
��∗ ��
��2�
3=
��� ∗ ���
�∗
0.39
∗ �
3600
1000
∗ �
��
�
4=
���
�∗ ���
�⁄
��
��4∗ � ∗ �
���
���������=
�
1+
�
2− �
3�
���=
�
4+
�
2− �
3(5)
(12)
(13)
(14) (6)
(7)
(8)
(9)
(10)
Table 2. Physicochemical characterization of MBW and inoculum
Parameter MBW*n Inoculum*n
pH 5.5±0.1 7.2±0.2
Moisture (%) 76.7±3.2 94.1±0.4
TA (mg L-1 CaCO
3) 4447.1±1248.8 6270.4±1389.5
BA (mg L-1 CaCO
3) - 3390.3±772.9
VFA (mg L-1) 10595.5±1086.4 1656.6±59.9
Acetic acid (%) <0.0001 <0.0001 Propionic acid (%) <0.0001 <0.0001 Butyric acid (%) <0.0001 <0.0001 Total solids (mg L-1) 113036.67±15240.7 74090±29574.6
Volatile solids (mg L-1) 93016.7±28527.5 28258.9±10592.6
TOC** (%) 37.9±2.3 10.2±0.5
CODtotal (mg L-1) 137839.1±72267.1 54852.6±23184.5
CODiltered(mg L-1) 35604.5±3600.1 4,048.5±600.6
BOD5 (mg L-1) 45333.3±1800.3 1273.9±150.4
Total nitrogen**(%) 1.7±1.0 0.5±0.01 Total ammonia nitrogen (mg L-1) 324.5±55.2 393.2±44.5
Non-ionized ammonia nitrogen (NH3)(mg L-1) 0.13±0.1 7.9±0.1
Ionized ammonia nitrogen (NH4+) (mg L-1) 324.3±48.2 385.3±38.2
*Average values ** Dry basis; n: number of samples (5)
In general, the values of pH, moisture, TA, BA, and VFAs
are typical of quickly acidiicable wastes, as evidenced by other authors such as Pesta (2007) and Zupančič and Roš
(2012), who studied AD of MBW. The low pH values are linked to the MBW decomposition associated with high moisture; this causes an increase in VFA production and the absence of BA. Therefore, it is evident that MBW must be conditioned with an alkalizer that can provide the
necessary bufer capacity to neutralize the acidity and not afect the AD of the MBW (Abdulkarim and Abdullahi,
2010). The results of chromatography of the VFAs show that the high levels of VFAs are not linked to short-chain acids (acetic, propionic, and butyric acids) that are the precursors of the phases linked to methane production. As a result, the absence of these can prolong hydrolysis times and microbial adaptation due to the possible presence of long-chain or branched fatty acids (Sundberg et al., 2011). The high content of humidity in the MBW favors the hydrolysis stage, which is the initial stage of the AD process. The organic matter content in the MBW is high, as
evidenced by the values of TOC, COD, BOD5, and VS (see
Table 2). In addition, the CODiltered/CODtotal ratio (0.26) indicates that the predominance of particulate material
can also inluence the hydrolysis of organic matter, which
increases the solid retention time (SRT) (Mata et al., 2000).
The pH inluences the predominant form of nitrogen,
which is an important factor in biological processes due to the likely occurrence of phenomena inhibitory to microbial
activity (Dinamarca et al., 2003). Ammonia nitrogen in
the form of ammonium ions predominated in the MBW
at a concentration of 324.3 mg L-1, and the content of
non-ionized ammonia nitrogen, which is the more toxic form, was 0.13 mg L-1. From the point of view of the contribution
to the bufer capacity, authors such as Parawira et al.
(2004), recommend a concentration on the order of 1100
mg L-1 for adequate AD of this type of waste; these data
conirm the necessity of using an alkalizer in the process.
The MBW had a C/N ratio between 20 and 30, which
has positive efects on AD (Raposo et al., 2006). This value can be related to the high content of total nitrogen, which is associated with the presence of proteins in MBW.
The inoculum had values typical of anaerobic sludge from municipal wastewater treatment plants (MWWTP)
which uses chemically assisted primary treatment with
values of pH, TA, and BA that are indicative of a good
bufer capacity that favors AD (see Table 2) . Despite the
fact that the value of the VS/TS ratio is low from the point of view of the degree of activity of the biomass present in the sludge, it is typical of anaerobic reactors at MWWTP which uses chemically assisted primary treatment. Nevertheless, it is important to understand that the VS/TS ratio alone is not a good indicator of the inoculum quality, owing to the microbial diversity present in the sludge.
Inluence of Particle Size on AD of MBW
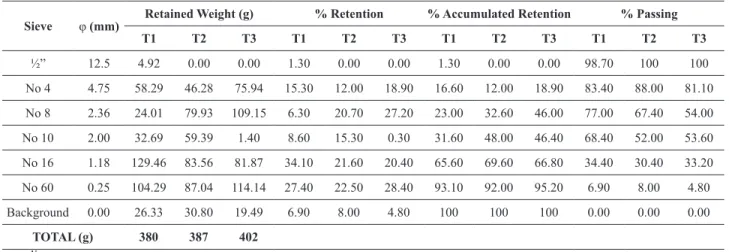
The results of the granulometry tests on MBW according to grinding time are shown in Table 3.
According to Table 3, for all of the grinding times, a particle size suitable for AD of MBW was obtained (0.1-30
mm) (Aldin et al., 2011). Cho et al. (2013) remarked that
the predominance of particles of less than 2 mm facilitates metabolic processes in AD, and when the proportion of
these particles decreases, methane generation is afected.
Therefore, for a grinding time of 60 s (T1), 68.4% of the particles had diameters of less than 2.0 mm, whereas for T2 (120 s) and for T3 (180 s), the values were 52 and 53.6%, respectively. Consequently, the predominance of this type of particle in T1 facilitates such important
Table 3. Granulometry of MBW
Sieve φ (mm) Retained Weight (g)
% Retention % Accumulated Retention % Passing
T1 T2 T3 T1 T2 T3 T1 T2 T3 T1 T2 T3
½” 12.5 4.92 0.00 0.00 1.30 0.00 0.00 1.30 0.00 0.00 98.70 100 100
No 4 4.75 58.29 46.28 75.94 15.30 12.00 18.90 16.60 12.00 18.90 83.40 88.00 81.10 No 8 2.36 24.01 79.93 109.15 6.30 20.70 27.20 23.00 32.60 46.00 77.00 67.40 54.00
No 10 2.00 32.69 59.39 1.40 8.60 15.30 0.30 31.60 48.00 46.40 68.40 52.00 53.60
No 16 1.18 129.46 83.56 81.87 34.10 21.60 20.40 65.60 69.60 66.80 34.40 30.40 33.20 No 60 0.25 104.29 87.04 114.14 27.40 22.50 28.40 93.10 92.00 95.20 6.90 8.00 4.80
Background 0.00 26.33 30.80 19.49 6.90 8.00 4.80 100 100 100 0.00 0.00 0.00
TOTAL (g) 380 387 402
φ :diameter.
of methane (Hajji and Rhachi, 2013). In spite of using the same grinding time, only 6.9% of the particles obtained a
diameter of less than 0.25 mm, which indicates a lack of ine
particles. Although accelerating the MBW transformation process can also increase the VFA concentration during the hydrolytic stage of AD; this can lead to inhibition of the
microorganisms (Izumi et al, 2010).
Although it is expected that, with a longer grinding time, the particle size should decrease, it was found that for times T2 and T3, particles larger than 2.0 mm predominated (48 and 46.4%, respectively) compared to that obtained with T1 (31.6%).
This result can be associated with the agglomeration
process of smaller particles due to the efect of van der
Waals forces, which is attributed to nonpolar substances, such as VFAs, in particular those with long-chains; it can be deduced that there were large concentrations in the
substrate utilized in this process (Pasquali et al., 2006).
Therefore, with greater exposure times of these particles to
the centrifugal efect of the grinding process, the grouping
of smaller particles is perhaps favored.
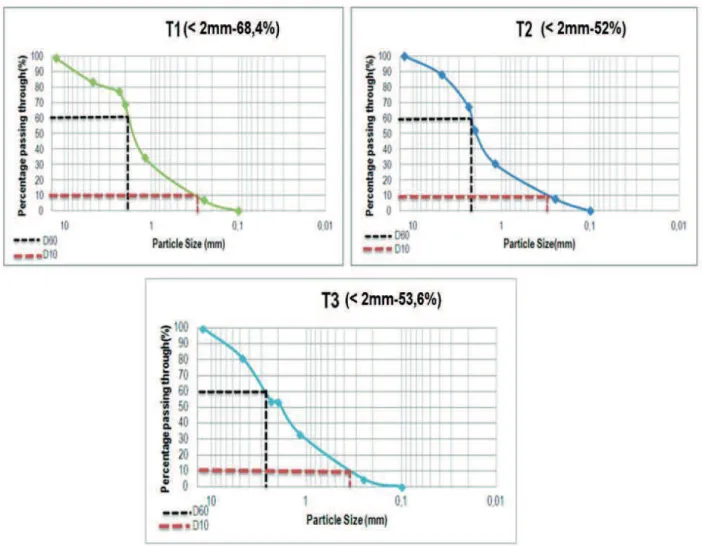
Figure 2 shows the granulometry distribution curves for
each MBW sample. This igure indicates that 60% of the
particles (D60) for T1, T2, and T3 are smaller than 2.0, 2.2
and 2.8 mm, respectively, whereas the efective diameter
(D10) consists of particles with sizes less than 0.25, 0.33
and 0.388 mm, respectively. Upon inding 10% of the
particles with this diameter, it was observed that there was no prevalence of these particles, which thereby avoids rapid
acidiication and possible inhibition; according to Izumi et
al. (2010), an excessive reduction in size can increase the
VFA concentration in the reactor.
Acording to Diaz and Giraldo (1997), the smaller particle size means a greater amount of inoculum required in the reactor and, consequently, the amount of substrate to be treated decreases. Nevertheless, for all of the samples,
the uniformity coeicient, Cu, was greater than 3 (Table
4), which indicates the variability of particle sizes. This
result agrees with the investigations performed by Zhang and Banks (2013), who assert that during the grinding
processes, diferent particle sizes are achieved; these can inluence certain phases of the AD process, particularly
hydrolysis, when the greatest enzymatic activity during the anaerobic process occurs.
Figure 3 shows that the lag phase for the latter was approximately 2.5 d (60 hours), which indicates that although the substrate predominantly contains particulate organic material, its size not only allowed adaptability of the biomass but also the microbial communities rapidly
transformed the MBW (Mata et al., 2000). This result is
relected on day 19 (456 hours) of the digestion process
when the reactor had already reached approximately 80% of the methane production, thereby demonstrating the importance of particle size in AD of MBW. Likewise, during the entire process, it can be observed that reactor T1 achieved the greatest methane production, which is attributed to the high content of particles smaller than 2.0 mm.
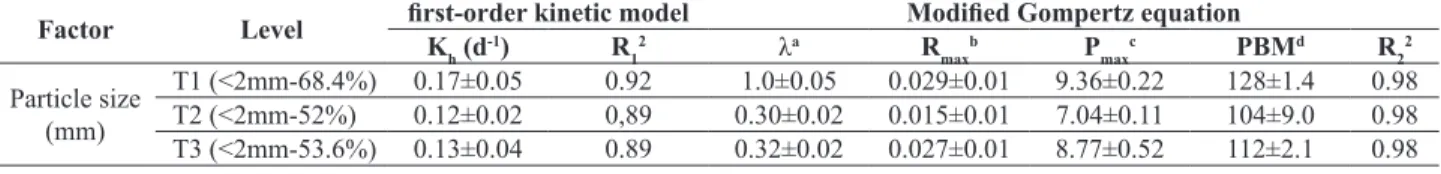
Table 5 shows the results of the kinetic model and Gompertz adjusting for each particle size.
The Kh results show the predominance of particles that
facilitate the transformation process and the generation of
methane (Aldin et al., 2011). Also, it was found that the
greater correlation was achieved for particles with sizes
smaller than 2 mm (T1) (0.17 d-1 and 0.92, respectively),
which is linked to the results of particle size where such particles predominated.
In addition the lag phase was less than 1 day, which coincides with the size of particles that facilitate the hydrolysis stage, since the overall speed of the process is primarily associated with high solids substrates. Even where acidogenic and methanogenic stages are considered
limiting, the hydrolysis may afect the overall process.
Figure 2. Granulometry for each of the samples.
Table 4. Uniformity coeicients for each of the samples
Parameter T1 T2 T3
Cu 6.0 7.3 8.0
Table 5. Results of irst-order kinetic model and modiied Gompertz for each particle size
Factor Level irst-order kinetic model Modiied Gompertz equation
Kh (d-1) R12 λa R
max
b P
max
c PBMd R
2 2
Particle size (mm)
T1 (<2mm-68.4%) 0.17±0.05 0.92 1.0±0.05 0.029±0.01 9.36±0.22 128±1.4 0.98
T2 (<2mm-52%) 0.12±0.02 0,89 0.30±0.02 0.015±0.01 7.04±0.11 104±9.0 0.98
T3 (<2mm-53.6%) 0.13±0.04 0.89 0.32±0.02 0.027±0.01 8.77±0.52 112±2.1 0.98 a (days); b (mL h-1); c (mL); d (mL gSV-1)
Although variability among the values in the lag phase for each time was observed, this may be related to the results of Cu, since heterogeneity was found in particle
size; hence the diversity of sizes may have inluenced
these results.This is consistent with studies by Aldin et al. (2011), who observed that by increasing the hydrolysis rate there is a decrease in the particle size.
The results of BMP and EE production are presented in Table 6 for each of the evaluated particle sizes.
The non-parametric randomization test evaluates the
signiicance of particle size in AD and showed there are no diferences in BMP at a 10% signiicance level. However,
upon observing the values of BMP and EE, the best results were observed in reactor T1, given that a production exceeding 19% was achieved compared to other times.
This inding is similar to that reported by Cho et al. (2013), who found an increase in the production of methane of 20% in reactors with particles with diameters of less than 2.0 mm, which is the predominant size in T1. Agyeman and Tao (2014) obtained the best results with regard to
methane production in reactors in which particles of < 2.5
mm predominated. Therefore, the importance of particle
size on processes in AD of MBW relected in the methane production is conirmed.
According to the Uniied Information System (SUI, for
it is initials in Spanish) (SUI, 2013), the municipality under study had an energy demand of 1206839 and 653097 kWh for the residential and non-residential (commercial, industrial, and public) sectors, respectively. If the electrical energy production obtained from T1 is considered, approximately 12% of the residential demand and 22% of the non-residential demand could be supplied. By considering that the average annual kWh cost for the residential sector in the Valle del Cauca province is COP$381.3 (USD $0.16), a savings of COP$54076271(USD $22688.98) could be achieved, which indicates that AD not only has positive environmental impacts but also economic impacts.
An energy rationing scheme similar to that implemented in the 1990s in Colombia can be applied again considering that 70% of electricity consumed originated from
hydroelectric sources, and the Mining Energy Planning Unit (MEPU, Unidad de Planeación Minero Energética-UPME) (UPME, 2013) has expressed that prolonged dry periods (caused by the El Niño phenomenon) have directly impacted the water reservoir contribution to hydroelectric generation. Due to the aforementioned factors, the use of MBW as a potential energy alternative for the country
could permit fulilling current legal regulations related to
renewable energy (Law 1715 of 2014) and promote the energy independence of the country.
Figure 4 shows that actually the AD of MBW is an alternative that reduces greenhouse gas emissions, since a
reduction of over 90% was obtained. Landills in Colombia
represent 5% of the country´s emissions compared to developed countries such as Macedonia and South Africa where the percentages are 4.3 and 7%, respectively.
(Friedrich and Trois, 2013; Dedinec et al., 2015). The GHG
generated by the disposal of solid waste in these structures are not considered as a serious problem when viewed from the local point of view, but high concentrations may be generated by a lot of these structures, both controlled and uncontrolled and spread throughout a region, a country or continent. The continuity in time of their emissions into the atmosphere and the persistence of these gases can generate an endless string of changes in the composition of natural systems, which transform the weather conditions as evidenced by the prolongation of the El Niño phenomenon in recent years.
Figure 5 shows the results of the energy balance for each particle size range evaluated.
From the perspective of energy balance it shows that, for all treatments, this is negative (see Figure 5); however,
T1 is the closest to an energy balance (-985408 J gVS-1)
than the Enet for T2 and T3 of -2510644 and -3964850 J
gVS-1, relecting that the grinding time in the pretreatment
of the MBW associated with the particle size is a factor
that should not only inluence the biological process of
the AD of the MBW, but also the energy demand for this technology. Therefore, when extrapolating the results at pilot or full-scale one must consider the grinding time obtained in the trials of BMP. A grinding time that ensures optimum particle size that maximizes methane production
and minimize Ein is not yet established, that is to say,
environmentally sustainable. This is similar to Ariunbaatar
et al. (2014), who state that mechanical pretreatment, although enhancing methane production from the energy and environmental balance, is the least favorable compared to other pretreatments such as thermal and biological. Table 6. BMP and EE for each reactor evaluated
R BMP (mLCH4 gVS-1) EE (kWh week-1)
T1 (<2 mm-68.4%) 128±1.4 2960.38±73.44
T2 (< 2mm-52%) 104±9.0 2405.24±532.10
T3 (<2mm-53.6%) 112±2.1 2595.68.±47.33
Figure 5. Energy balance for each particle size range evaluated
Figure 4. Carbon footprint for each of the proposed scenarios
CONCLUSIONS
The MBW studied had a composition of primarily particulate organic material. In addition, the biodegradable
fraction is signiicant; this conirms its potential as an
alternative source of renewable energy based on anaerobic digestion.
The present study highlights the importance of the separation process at the source and the selective collection of solid waste in communities because to the success of this type of alternative technology depends on these factors.
The particle size is an important factor in the AD of MBW, presenting better results for the hydrolysis rate, the lag phase, methane production and electricity generation in the size range of particle below 2 mm. Likewise, it
evidences that AD is a technological alternative that reduces the emissions of greenhouse gases in developing countries, which are more susceptible to climate change. AD considers the combination of mechanical pretreatments to ensure a positive energy balance and in turn maximize the production of methane and thus power generation.
ACKNOWLEDGEMENTS
The authors are grateful to the Universidad del Valle
for providing inancial support to the research project
REFERENCES
Abdulkarim, B.I. and Abdullahi, M. E.. Efect of bufer
(NaHCO3) and waste type in high solid thermophilic
anaerobic digestion. Inter.J. of ChemTech Resear., 2(2), p 980-984 (2010).
Agyeman, F. O.and Tao, W. Anaerobic Co-Digestion of
food waste and dairy manure: efects of food waste
particle size and organic loading rate. J.of Envir. Manag., 133, p 268-27 (2014).
Aldin, S.,Nakhla, G. and Ray, M. B. Modeling the
inluence of particulate protein size on hydrolysis in
anaerobic digestion. I. and E. Chem.Resear., 50(18), p 10843-10849 (2011).
APHA. Standard methods for examination of water and wastewater. American Water Works Association and Water Environment Federation. Washington D.C (2005).
Aquino, S. F., Chernicharo, L. C. A., Foresti, E. and Florencio D. S. M. d. L. Metodologias para
determinação daa atividade metanogênica especíica
(AME) em lodos anaeróbios. Eng. Sanit. Ambient., 12, p 192-201 (2007).
Ariunbaatar, J., Panico, A., Esposito, G., Pirozzi, F.and Lens, P. N. L.. Pretreatment methods to enhance anaerobic digestion of organic solid waste. A. Energy, 123, p 143-156 (2014).
Banks, C. J., Zhang, Y., Heaven, S., Watson, G., Powrie, W., Stentiford, E., Hobbis, P., Bulson, H., Muller, W., Niesar, M., Bockreis, A. and Chesshire, M..
Particle size requirements for efective bioprocessing
of biodegradable municipal waste. University of Southampton,University of Leeds, Organic Resource
Agency Ltd and Greeninch Ltd (2010)
Bojórquez, I., Pérez, M. M., Flores, F. and Bojórquez, G. Resistencia a la compresión de compuestos a base de desperdicios de origen orgánico. Rev. Ing. de Const., 18(2), p 87-92 (2011).
Cho, S. K., Kim, D.H., Yun, Y. M., Jung, K.W., Shin, H.S. and Oh, S.E.Statistical optimization of mixture ratio and particle size for dry co-digestion of food waste and manure by response surface methodology. Ko. J.of Chem. Eng, 8, p 1-4 (2013).
Dedinec, A.,Markovska, N., Ristovski, I., Velevski, G.,Gjorgjievska, V. T., Grncarovska, T. O., and Zdraveva, P. Economic and environmental evaluation of climate change mitigation measures in the waste sector of developing countries. J. Clean. Prod., 88(0), p 234-241 (2015).
Díaz, A. J. E. and Giraldo, G. E. Digestión anaerobia seca de la fracción orgánica de los residuos sólidos municipales de sante fé de bogotá en reactor completamente mezclado (C.M). Memos de Investigación, 360:, p 1-18 (1997).
Dinamarca, S., Aroca, G., Chamy, R. and Guerrero, L. The
Inluence of pH in the hydrolytic stage of anaerobic
digestion of the organic fraction of urban solid waste. Wat. Sci.Tech., 48(6), p 249-254 (2003).
Friedrich, E. and Trois, C.. GHG emission factors
developed for the collection, transport and landilling
of municipal waste in South African municipalities. Waste Manag. ,33, p 1013-1026 (2013).
Giménez, J. B., Martí, N., Ferrer, J. and Seco, A.
Methane recovery eiciency in a submerged anaerobic
membrane bioreactor (SANMBR) treating sulphate-rich urban wastewater: evaluation of methane losses
with the eluent. Biores. Techno., 118, p 67-72 (2012). Hajji, A. and Rhachi, M.. The inluence of particle size on
the performance of anerobic digestion of municipal solid waste. Ener. Proc., 36, p 515-520 (2013).
Hartmann, H., Ahring, B. K.. Anaerobic digestion of the
organic fraction of municipal solid waste: Inluence of
co-digestion with manure. Water Res., 39, p 1543-1552 (2005).
ICONTEC. Norma Técnica Colombiana 5167. Productos para la Industria Agrícola, Productos Orgánicos Usados como Abonos o Fertilizantes y Enmiendas de Suelo, p 32 (2004).
IPCC. PCC guidelines for national greenhouse gas inventories. Prepared by the national greenhouse gas inventories programme. Japan: IGES (2006).
Izumi, K., Okishio, Y. K., Nagao, N., Niwa, C., Yamamoto,
S. and Toda, T. Efects of particle size on anaerobic
digestion of food waste. Inter. Biodete. Biodegra., 64, p 601-608 (2010).
Lay, J. J., Li, Y. Y., Noike, T., Endo, J. and Ishimoto, S.
Analysis of enviomental factors afecting methane
production from high-solids organic waste. Wat. Sci. Tech., 36(6-7), p 493-500 (1997).
Liew, L. N., Shi, J. and Li, Y. Methane production from solid-state anaerobic digestion of lignocellulosic biomass. Biom Bioen., 46, p 125-132, (2012).
Lindner, J., Zielonka, S., Oechsner, H., Lemmer, A. Efects
of mechanical treatment of digestate after anaerobic digestion on the degree of degradation. Biores. Techno, 178, 194-200 (2015)
Liu, X., Gao, X., Wang, W., Zheng, L., Zhou, Y. and Sun, Y. Pilot-scale anaerobic co-digestion of municipal biomass waste: Focusing on biogas production and GHG reduction. Renew. Energy, 44, p 463-468 (2012). Mata, A. J., Macé, S. and Llabares, P. Anaerobic digestion
of organic solid wastes. an overview of research achievements and perspectives. Biores. Techno., 74: 3-16 (2000).
Mukherjee, S., Kumar, S. and Devotta, S. Inluence of
Oviedo, O. E. R., Marmolejo, R. L. F. and Torres, L. P. Evaluation of the adittion of wood ashes to control the pH of substrates in municipal biowaste composting. Ing. Inve. Tecno., 15: 469-478 (2014).
Oviedo, O. R., Marmolejo, L. F., Torres, L. P. Perspectivas de aplicación del compostaje de biorresiduos provenientes de residuos sólidos municipales.un enfoque desde lo global a lo local. Rev. Ing. Universidad de Medellin, 11(20), p 67-76 (2012).
Owen, W. F., Stuckey, D. C., Healy, J. B., Young, L. Y. and McCarty L. M. Bioassay for monitoring biochemical methane potential and anaerobic toxicity. Water Res., 13, p 485-492 (1987).
Pabón, P. C. P., Castañares, G. and Van Lier, J. B.. An Oxitop® protocol for screening plant material for its biochemical methane potential (BMP). Wat. Sci.Tech, 66 (7), p1416-1423 (2012).
Parawira, W., Murto, M., Zvauya, R. and Mattiasson, B. Anaerobic batch digestion of solid potato waste alone and in combination with sugar beet leaves. Renew. Energy, 29(11), p 1811-1823 (2004).
Parra, O. B. A., Torres, L. P., Marmolejo, L. F., Cardenas, C. L. M., Vasquez, F. C. H., Torres, L. W. A y Ordoñez
A. J. A. Inluencia del pH sobre la digestión anaerobia
de biorresiduos de origen municipal. Revista U.D.C.A Act. & Div. Cient., 17(2), p 553-562 (2014).
Pasquali, R. C.,Bregni, C. and Serrao, R. Características e
identiicación de los cristales líquidos liotrópicos. Rev.
Mex. Ciencias Farma., 37(2), p 38-53 (2006).
Pesta, G. Anaerobic digestion of organic residues and waste. New York, United States, Springer, p 53-71 (2007)
Raposo, F., Banks, C. J., Siegert, I., Heaven, S. and Borja,
R. Inluence of inoculum to substrate ratio on the
biochemical methane potential of maize in batch tests. Process Biochem., 41, p1444-1450 (2006).
Sakurai, K. Método sencillo del análisis de residuos sólidos. CEPIS. CEPIS/OPS. Lima-Peru (2000). Schievano, A., D’Imporzano, G., Orzi, V., Colombo, G.,
Maggiore, T. and Adani, F.. Biogas from dedicated energy crops in Northern Italy: electric energy generation costs. GCB Bioenergy, Article in press (2014).
Serrano, A., Siles, J. A., Gutiérrez, M. C. and Martín, M. Á., 2015. Improvement of the biomethanization of sewage sludge by thermal pre-treatment and co-digestion with strawberry extrudate. J. Clean. Prod., 90(0), p 25-33 (2014).
Sharma, K. S., Mishra, I. M.,. Sharma, M. P.,Saini, J.
S. Efect of particle size on biogas generation from
biomass residues. Biom Bioen.,p 251-263 (1988).
Sterling, J. M., Lacey, R., Engler, C. and Ricke, S. Efects
of ammonia nitrogen on H2 and CH4 production during
anaerobic digestion of dairy cattle manure. Biores. Techn., 77(1), p 9-18 (2011).
SUI. Sistema Unico de Información de Serivicios Públicos Bogotá D.C. Superintendencia de Serivicos Públicos Domiciliarios Consulta: May, 2014. Página web: http:// www.sui.gov.co/SUIAuth/logon.jsp (2013)
Sundberg, C., Franke-Whittle, I. H., Kauppi, S., Yu, D., Romantschuk, M., Insam, H. and Jönsson, H. Characterisation of source-separated household waste intended for composting. Biores.Techn., 102(3), p 2859-2867 (2011).
TWB. World production of Municipal Solid Waste (MSW), 2012*–2025. The Wordl Bank (2012).
UPME. Estudio para Determinar la Vulnerabilidad y las Opciones de Adaptación del Sector Energético Colombiano Frente Al Cambio Climático. Unidad de Planeación Minero Energética. Bogotá,D.C. (2013)
Zhang, Y. and Banks, C. J. Impact of diferent particle
size distributions on anaerobic digestion of the organic fraction of municipal solid waste. Waste Manage., 33(2), p 297-307 (2013).
Zupančič, G. D. and Roš, M.Determination of chemical