Spatial distribution of organic matter in the surface sediments of
Ubatuba Bay (Southeastern – Brazil)
LETICIA BURONE1, PABLO MUNIZ1,2, ANA MARIA S. PIRES-VANIN1 and MARCELO RODRIGUES1
1Instituto Oceanográfico da Universidade de São Paulo (IOUSP) Cidade Universitária, 05508-900 São Paulo, Brasil
2Oceanología, Departamento de Ecología, Facultad de Ciencias, Montevideo 11400, Uruguay Manuscript received on September 28, 2001; accepted for publication on October 25, 2002;
presented bySetembrino Petri
ABSTRACT
Analyses of organic matter content, organic carbon, nitrogen, sulfur and granulometric variables were per-formed on 101 surface sediment samples from Ubatuba Bay in order to investigate the spatial distribution of organic matter, its origin and the relationships among its components. The samples were obtained with a manual corer, from water depths between 1 and 15m during 5 cruises of the R/V ‘‘Veliger II’’, two months apart. Pearson correlation, regression and Principal Component Analysis (PCA) statistical methods were used to analyze the data. Strong correlations between organic matter and fine sediment fractions were ob-tained. The PCA revealed at least two main sample groups that reflect the different environmental conditions prevalent in the bay. There is a simple linear relationship between organic carbon content and the organic matter content determined by the calcination technique. Taking into account that the analysis of organic matter content is less expensive and less time consuming than the analysis of organic carbon, the present method of estimation can be useful when fast evaluation of the organic carbon content is needed for samples from similar environments.
Key words:organic matter, sediment, C/N ratio, Ubatuba, Brazil.
INTRODUCTION
Within aquatic ecosystems, bottom sediments have an important function as an efficient natural trap for diverse substances (including contaminants) and also as a natural regulator of the processes that occur inside the sea floor. They can store large amounts of organic matter and affect the oxygen content of bottom water. Bottom sediments also constitute a source of nutrients for the water column above them leading to benthic-pelagic coupling and influencing primary productivity (Jørgensen 1996).
Correspondence to: Pablo Muniz E-mail: [email protected]
Almost all marine coastal ecosystems have complex structural and dynamic characteristics that can be easily modified by anthropogenic influences. Any change in chemical properties of the sediments can affect benthic communities, including their sur-vival. The north coast of the São Paulo State has sev-eral enclosed bays strongly affected by the increas-ing tourism and urbanization (Furtado et al. 1987). Due to their physiography, the water circulation and dispersion of exotic elements are restricted when compared with open sea areas. For these reasons, the study of organic matter content in marine sedi-ments, and its origin, are important tools for under-standing the environmental conditions of the coastal ecosystem, and also for its monitoring, conservation and restoration.
The aim of this work is to study the distribution and inter relationships of the organic matter, carbon, nitrogen and sulfur content in surface sediments of the Ubatuba Bay, northern littoral of São Paulo State, Brazil. It is part of a larger research project to study the ecological aspects of benthic communities and the effects of some anthropogenic activities on this coastal ecosystem.
Study Area
The Ubatuba Bay is located on the northern coast of São Paulo State (23o25’S-23o27’S and 45o
01’W-45o03’W), and protected from south and southwest
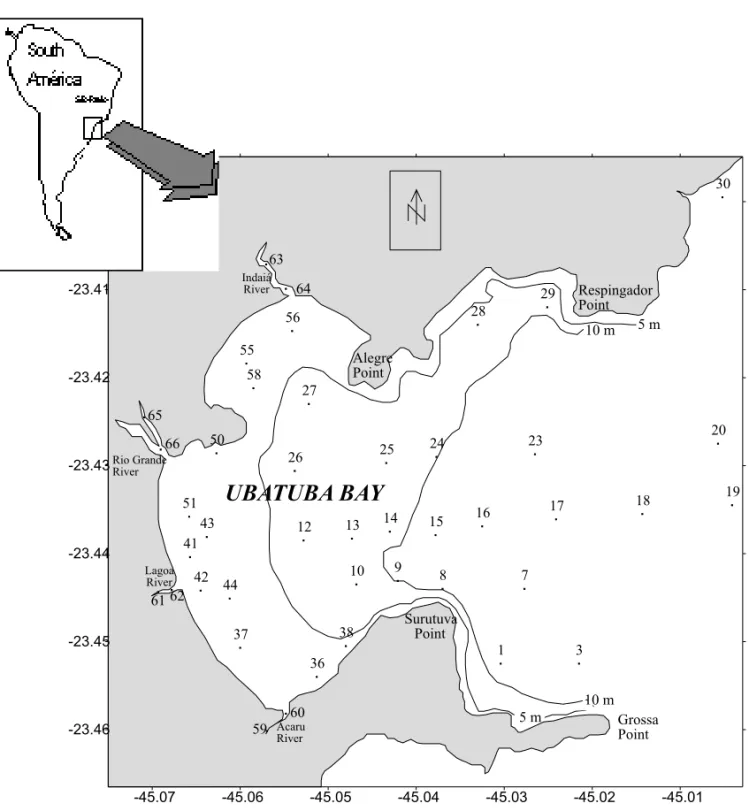
waves from the open sea (Mahiques 1992). The mouth of the bay is 4.4km across from Ponta do Respingador to Ponta Grossa (Fig. 1). Geologically, it is characterized by the presence of granites and migmatites, part of the Serra do Mar mountain chain, which reaches the shore in this portion of the coast (Mahiques et al. 1998).
According to Mahiques (1995), Ubatuba Bay shows very heterogeneous surface bottom sedi-ments. Coarse sediments are concentrated near the northern and eastern rocky margins of Ponta Suru-tuva, while fine sediments are deposited in the re-gion situated towards the northeast of Ponta Suru-tuva. The rest of the bay is covered by coarse and medium silt.
Water circulation is generally clock-wise, with the inflow from the south. The input of fluvial sed-iments is strongly dependent on the rainfall regime (Mahiques et al. 1998) leading to a higher contri-bution during the summer season. Four rivers flow into the bay and greatly influence its water qual-ity (CETESB 1996), especially during rainy periods when large amounts of untreated sewage are intro-duced from Ubatuba City.
MATERIALS AND METHODS
A total of 101 surface sediment samples were col-lected using a corer sampler on board the Research Vessel‘‘Veliger II’’. Of these 101 samples, 43 were collected during the austral summer of 1998 (Febru-ary) and the remainder taken bimonthly between De-cember/1999 and June/2000. The sampling design was based on the ‘‘Concentric Ring Sampling Pat-tern’’ (Mudrock and Macknight 1991), combined with depth distribution (Fig. 1).
Fig. 1 – Map of the study area with the 43 sampling stations (black dotes).
degree of dependence between organic carbon and organic matter content. The relationship between or-ganic matter content and oror-ganic carbon content was analyzed in detail in order to obtain an equation that allows the estimation of the organic carbon content from a known organic matter value. The data set ob-tained from the samples collected between Decem-ber/1999 and June/2000 (58 samples) was used to test the reliability of this equation. The differences
between the observed values and those estimated by the equation were tested using the Mann-Whitney non-parametric test.
order to avoid redundancy and perform a more real-istic ordination the variables with low percentage of contribution were eliminated. In this way, a second matrix was constructed using a total of seven vari-ables (organic matter, organic carbon, total nitrogen, sulfur, silt, very fine sand and medium sand). The program used was the Multivariate Statistical Pack-age (MVSP) (Kovach 1999).
The maps were constructed using Surfer 7.0 (Golden Software Inc.) and the interpolated data in the maps was made using the kriging method of gridding.
RESULTS
At the middle bay stations (12, 13, 14, 15, 16, 23, 24 and 25) as well as at several inner stations (10, 27, 29, 38, 44, 51 and 58) mud was the dominant sediment fraction, with values higher than 40%. Stations 1, 7, 8 and 9, near Ponta Surutuva, showed the highest heterogeneity in sediment composition with sand the dominant fraction. By contrast, the sediment of the river stations included high percentages of medium and fine sand (Table I). The contribution of very coarse and coarse sand fractions was generally very low, except for stations 1, 7, 61 and 66 where they ranged between 14 and 36% respectively.
Sulfur content was highest in the outermost sta-tions (Table II). Figure 2 presents the distribution of mud, carbon, nitrogen and sulfur content in the sed-iments. The highest values of organic matter and carbon content, as well as nitrogen and sulfur con-tent, were recorded in those stations with high per-centages of silt. Carbon-nitrogen ratios (C/N) in the study area ranged between 7.6 and 15.0 in the stations located within the bay, and between 6.67 and 16.56 in the river stations. Carbon-sulfur ratios (C/S) varied from 2.67 to 29.42, the lowest values found at the inner bay and river stations (Table II).
The highest correlation (r = 0.97, r2= 0.94) was
obtained between organic carbon and organic nitro-gen (Table III). Organic carbon content was posi-tively correlated(p<0.01)with organic matter, ni-trogen and sulfur content as well as with silt and mud
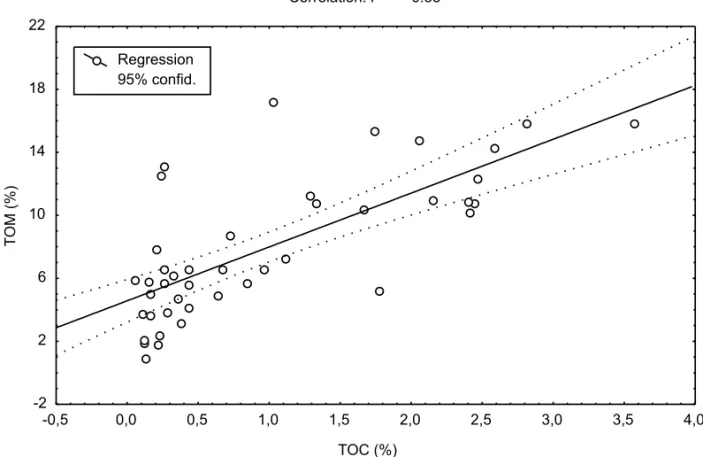
sediment fraction (Table III). A close correlation was observed between organic carbon and organic mat-ter, mud, silt and sulfur contents. The regression equation, which links organic matter with organic carbon content was:
% OC= −0.256+0.151×% OM (Fig. 3).
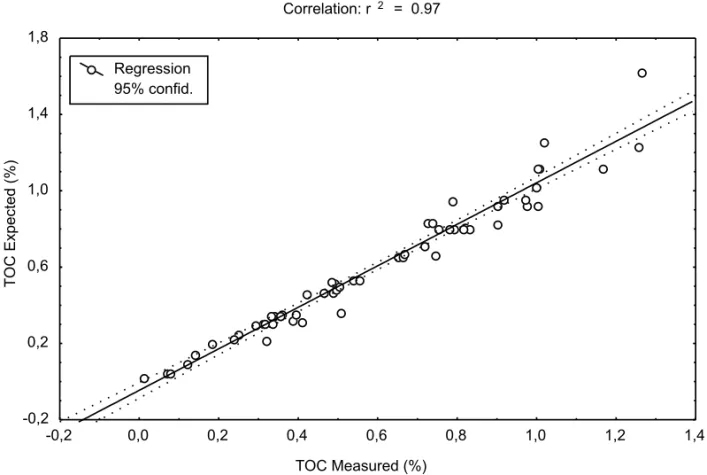
The two data sets used to obtain this
equa-tion are shown in figure 4. The Mann-Whitney
test showed no significant statistical difference(p> 0.05)between the observed and the predicted data.
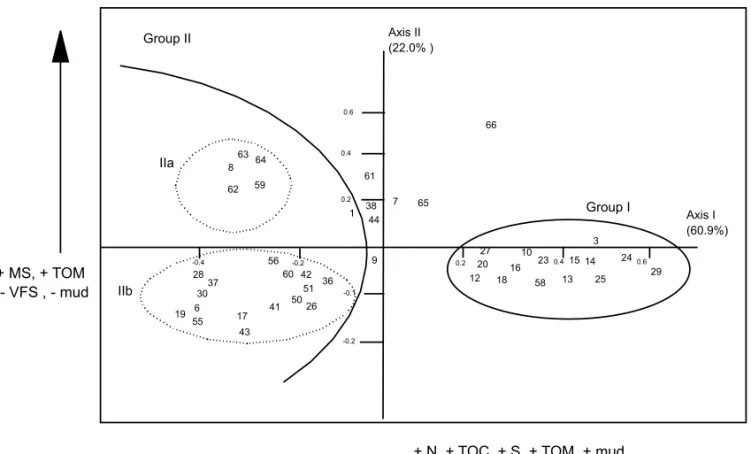
In the PCA ordination model the first and sec-ond components together explain 82.9% of the data variance; 60.9% can be explained by only the first component. Axis I is positively correlated with total nitrogen, organic carbon, sulfur, organic matter and mud content. Axis II is positively correlated with medium sand and organic matter, and negatively cor-related with very fine sand and mud content. We can differentiate two main groups of sampling stations according to the different environmental conditions within the study area (Fig. 5). The first group (I) is formed by those stations where mud was the domi-nant fraction, and the highest values of organic mat-ter, organic carbon, nitrogen and sulfur content were recorded. The second group can be divided in two sub-groups: IIa and IIb. The first sub-group (IIa) includes several river stations and station 8. It is principally characterized by samples with an impor-tant contribution of medium sand and low values of organic content. The second sub-group (IIb) com-prises the remaining stations with low to moderate values of organic carbon, nitrogen and organic mat-ter, and showing significant percentages of very fine sand and mud. Table IV shows mean values of the environmental variables studied for each one of the three groups of stations.
DISCUSSION
sed-TABLE I
Geographic positions, water depth and percentages of sediment fractions at the 43 sampling stations in February/1998 survey.VCS = very coarse sand; CS = coarse sand; MS = medium sand; FS = fine sand; VFS = very fine sand; Si = silt; Cl = clay.
TABLE I (continuation)
Stations latit. long. depth gravel VCS CS MS FS VFS Si Cl (S) (W) (m) (%) (%) (%) (%) (%) (%) (%) (%) 61 -23,45 -45,06 4 0 5.19 12.17 16.79 14.57 28.48 22.8 0 62 -23,45 -45,07 6 0 0 3.8 37.09 29.1 24.33 5.68 0 63 -23,40 -45,06 1 0 0 6.18 52.9 34.59 10.43 6.33 0 64 -23,40 -45,08 1.5 0 0 2.49 33.33 47.44 8.85 7.67 0.22 65 -23,42 -45,06 2 0 0 0.26 14.31 14.82 28.57 37.71 4.33 66 -23,42 -45,05 2 0.1 3.36 10.55 32.83 20.04 16.52 16.6 0
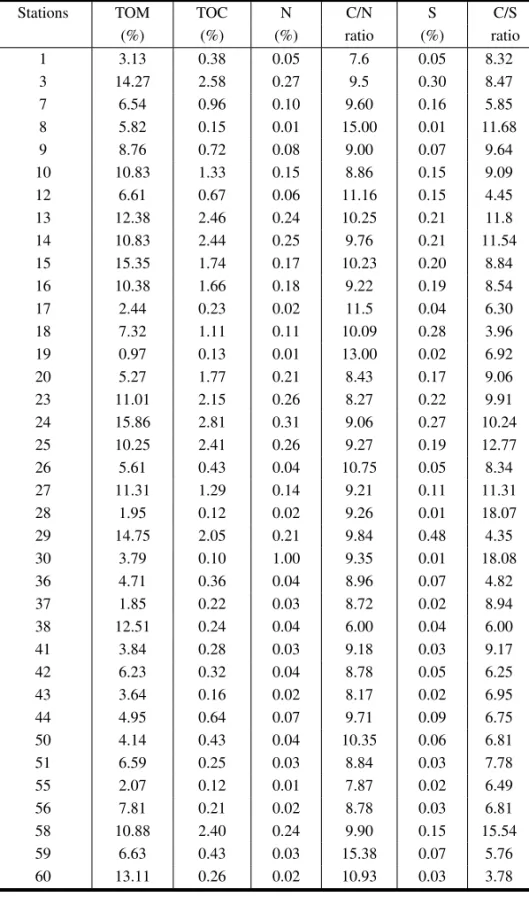
TABLE II
Organic matter, constituents and weight ratios of surface sediment for the 43 samples of the February/1998 survey. TOM = organic matter; TOC = organic carbon; N = total nitrogen and S = sulfur.
Stations TOM TOC N C/N S C/S
(%) (%) (%) ratio (%) ratio
1 3.13 0.38 0.05 7.6 0.05 8.32
3 14.27 2.58 0.27 9.5 0.30 8.47
7 6.54 0.96 0.10 9.60 0.16 5.85
8 5.82 0.15 0.01 15.00 0.01 11.68
9 8.76 0.72 0.08 9.00 0.07 9.64
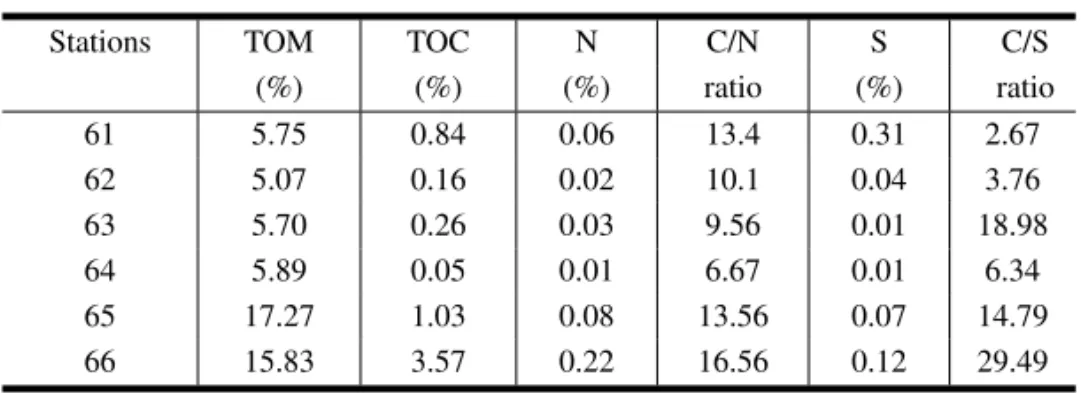
TABLE II (continuation)
Stations TOM TOC N C/N S C/S
(%) (%) (%) ratio (%) ratio 61 5.75 0.84 0.06 13.4 0.31 2.67 62 5.07 0.16 0.02 10.1 0.04 3.76 63 5.70 0.26 0.03 9.56 0.01 18.98 64 5.89 0.05 0.01 6.67 0.01 6.34 65 17.27 1.03 0.08 13.56 0.07 14.79 66 15.83 3.57 0.22 16.56 0.12 29.49
TABLE III
Pearson’s coefficients of correlation between components of the organic matter of the sediment, water depth and granulometric variables(∗P<0.01).
Variables TOC N S TOM C/N C/S Si Cl Mud VFS Depth TOC 1.00
N 0.97* 1.00
S 0.73* 0.76* 1.00
TOM 0.74* 0.70* 0.57* 1.00 C/N 0.16 0.05 0.05 0.14 1.00 C/S 0.41* 0.29 -0.15 0.25 0.28 1.00
Si 0.63* 0.68* 0.65* 0.63* -0.19 -0.06 1.00
Cl 0.52* 0.60* 0.62* 0.61* -0.22 -0.10 0.62* 1.00 1.00 Mud 0.68* 0.68* 0.66* 0.64* -0.20 -0.06 0.76* 0.90* 1.00 VFS -0.39* -0.37* -0.39* -0.50* -0.13 -0.15 -0.37* -0.31* -0.37* 1.00 Depth 0.32* 0.41* 0.43* 0.06 -0.02 -0.06 0.16 0.33* 0.19 -0.15 1.00
iment facies related principally to local hydrody-namic conditions.
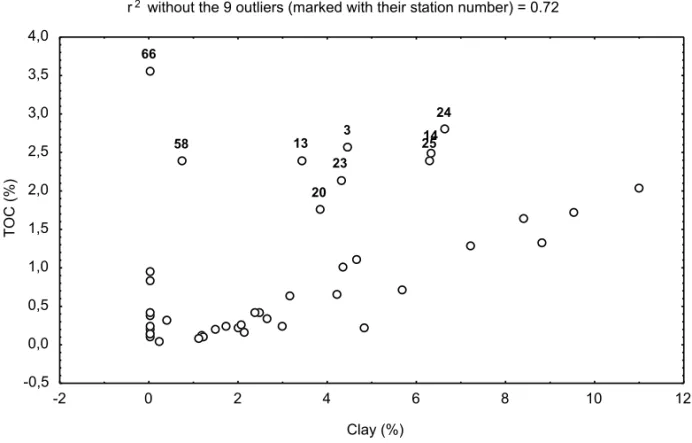
The northern central region is dominated by calm depositional conditions, where mud is the pre-dominant sediment fraction. As might be expected, this central region also exhibits the highest contents of organic carbon, total nitrogen and organic mat-ter (Fig. 2), and significant positive correlations were obtained between these parameters (Table III). Mahiques (1992) also observed high values of or-ganic carbon and nitrogen in this region, but in con-trast with our results, he recorded higher values of organic carbon (greater than 1%). If we examine a plot of organic carbon and clay content of the sed-iments (r = 0.52) (Fig. 6), we can note that nine stations are outliers of the general distribution. In general the distribution of organic carbon is closely
Fig. 3 – Regression of total organic matter content (TOM) and total organic carbon content (TOC) of the 43 sampling stations in Ubatuba Bay. The coefficient of determination (r2) is shown.
trend to anoxic conditions that can be confirmed by the H2S smell, the black layer near the surface and
the highest percentages of sulfur in the sediments (Table II).
Coarse sediments were dominant at the river stations with an important contribution of medium sand. Deposition of fine sediments is not possi-ble in areas with strong currents; accordingly, high percentages of coarse, medium and fine sand were recorded at the stations near Ponta Grossa. In this case, the negative correlation between organic com-pounds and coarser sediments can also be explained by the high porosity and permeability of this kind of bottom. The stations belonging to the sub-groups IIa and IIb (of the PCA model) have coarser sedi-ments and lower amounts of organic matter than the stations corresponding to the central region of the bay.
The innermost area of the bay showed interme-diate organic values (Fig. 2), but can be
character-ized as a low energy environment also. In this re-gion, the Ubatuba Bay exhibits a constriction in the coastline that induces wave refraction (Mahiques et al. 1998) and acts as a barrier for the intrusion of waves from the open sea. As it is known, wave action is one of the principal hydrodynamic phenomena re-sponsible for the bottom sedimentary processes in coastal areas (Furtado and Mahiques 1989) and can explain the features observed.
Fig. 4 – Regression of TOC measured and TOC expected of the 58 samples in Ubatuba Bay. The coefficient of determination (r2) is shown.
both marine and terrestrial organic components in the sediment. Despite some contradictions, the C/N ratios have been used largely as a parameter for the evaluation of the origin of the organic matter. Taking into account these opinions, the C/N ratios observed in surface sediments of the Ubatuba Bay seem to re-flect a mixed origin of the organic matter. The places near the river mouths showed the highest C/N ratios, indicating the input of terrestrial material into the area. These values show that in spite of the degree of impact caused by the rivers, there is no dilution of the natural organic matter in relation to the input of nitrogen by sewage, which can mask the C/N ratio (Bordovskiy 1965).
Iron sulfides have been used as an indicator of anoxic environmental conditions in bottom sed-iments. Berner and Raiswell (1984) and Raiswell and Berner (1985), among others, used the organic C/S ratio to discriminate normal marine (oxy-genated) depositional environment from anoxic or
semi-anoxic marine conditions. Our results indi-cated as a general trend for the study area an oxy-genated environment with the lowest values in the innermost region of the bay. However, the C/S val-ues founded at the stations from Acaraú River and at the Lagoa River were lower, around 3.0, tending to an anoxic condition of the sediments. In a pre-liminary analysis during the collect the sediments of those stations showed dark color and a strong smell of sulfides. In addition, CETESB (1996) recorded great amounts of domestic sewage introduced into the bay via these two rivers. During 1999 the waters of Acarau and Lagoa rivers presented the extreme value of 1.100.000 NMP/100ml of fecal coliforms (CETESB 2000), whereas the maximum permissi-ble by the law is 1000 NMP/100ml. Such a degree of fecal contamination is indicative of raw sewage (CETESB 2000).
Fig. 5 – PCA ordination diagram of sampling stations based on the selected sediment variables measured. The numbers of stations are the same as in figure 1. The two main sample groups are show (Group I and II).
(Jackson 1964, Emery and Uchupi 1984), the or-ganic carbon content can be multiplied roughly by 2 to give the relative total organic matter in recent bottom sediments. The inverse process, i.e., the es-timation of organic carbon content of the sediments from the total organic matter content may be ques-tionable because of the high variability in the or-ganic matter chemical constituents, and the oror-ganic matter to organic carbon ratios varies significantly depending upon the origin and diagenetic state of the sediment (Tyson 1995). However, as our data had shown, in a preliminary analysis this method can be useful since the determination of total or-ganic matter is less expensive, fast and easy. In ad-dition, this approximation is a good environmental tool when rapid evaluations are needed, as for ex-ample in monitoring sampling programs. The strong correlation between predicted and observed values of organic carbon content allows us to say that a good estimation of the organic carbon content can be
ob-tained just by determining the total organic matter. These data permit the estimation of the organic car-bon values for the Ubatuba Bay with a good level of accuracy, and perhaps for other similar coastal ecosystems also.
Fig. 6 – Relation between clay content and TOC content of surface sediments in Ubatuba Bay. The coefficient of determination (r2) is shown.
ACKNOWLEDGMENTS
Financial support was provided by ‘‘Fundação de Amparo à Pesquisa do Estado de São Paulo’’, Brazil (FAPESP, Proc. No. 97/12493-7 and 99/09739-0) and IAI (Interamerican Institute for Global Change Research, SACC-CRN Project). The Instituto Ocea-nográfico da Universidade de São Paulo are acknowledged by their field and laboratory facili-ties. The MS was enriched by the suggestions of two anonymous referees.
RESUMO
Foram realizadas análises de matéria orgânica, carbono orgânico, nitrogênio, enxofre e granulometria utilizando-se 101 amostras de utilizando-sedimentos superficiais na Enutilizando-seada de Ubatuba, SP, com a finalidade de investigar a origem e distribuição espacial da matéria orgânica, sua origem e as relações existentes entre seus componentes químicos. O material foi coletado com amostrador tipo ‘‘corer’’, em
profundidades compreendidas entre 1 e 15m, a bordo do B/Pq ‘‘Veliger II’’, em 5 coletas a cada dois meses. As amostras foram analisadas estatisticamente através de cor-relação linear de Pearson, regressão e análise de compo-nentes principais (PCA). Foram obtidas boas correlações entre a matéria orgânica e as frações finas do sedimento. O PCA revelou a existência de duas regiões principais dentro da enseada, que refletem diretamente as condições hidrodinâmicas locais. Foi estabelecida uma equação li-near simples para obtenção de boas estimativas de carbono orgânico, a partir de dados de matéria orgânica obtida por técnicas de calcinação. Considerando-se a rapidez e o baixo custo das análises de matéria orgânica quando comparadas às de carbono orgânico, o presente método mostrou-se útil em análises de rotina ou quando se fazem necessárias avaliações imediatas do conteúdo de matéria orgânica em ambientes impactados.
-45.07 -45.06 -45.05 -45.04 -45.03 -45.02 -45.01 -23.46
-23.45 -23.44 -23.43 -23.42 -23.41 -23.40
Indaiá River
Rio Grande River
Lagoa River
Acaru River
Grossa Point Respingador Point
LEGEND
GROUPS
I
IIa
IIb
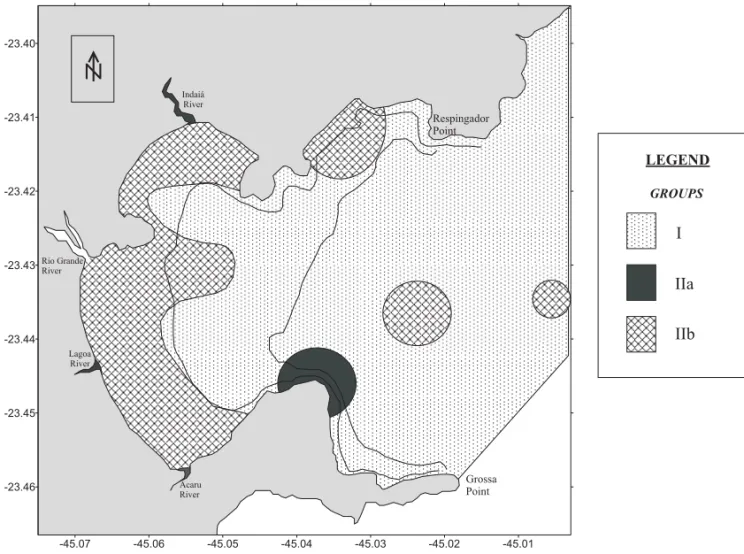
Fig. 7 – Map of the study area showing the two main groups of stations and the two subgroups, resulted of the PCA analysis.
REFERENCES
Berner RA and Raiswell R.1984. C/S method for
distinguishing freshwater from marine sedimentary rocks. Geology 12: 365-368.
Bordovskiy OK.1965. Accumulation of organic matter
in bottom sediments. Marine Geology 3: 33-82.
Byers S, Mills E and Stewart P.1978. Comparison
of methods of determining organic carbon in marine sediments, with suggestions for a standard method. Hydrobiologia 58: 43-47.
Carpenter EJ and Capone DJ.1983. Nitrogen in the
marine environment. Stony Brook, Marine Science Research Center. 900p.
CETESB (Companhia de Tecnologia de Saneamento
Ambiental).1996. Relatório de Baneabilidade das
Prais Paulistas-1995. Secretaria do Meio Ambiente, São Paulo, 1996. 112p.
CETESB (Companhia de Tecnologia de Saneamento
Ambiental). 2000. Relatório de Baneabilidade das
Prais Paulistas-1999. Secretaria do Meio Ambiente, São Paulo. 185p.
Emery KO and Uchupi E.1984. The geology of the
Atlantic Ocean. New York: Springer-Verlag. 1050p.
Faganelli J, Malej A, Pezdic J and Malacic V.1988.
C:N:P ratios and stable C isotopic ratios as indicator of sources of organic matter in the Gulf of Trieste (northern Adriatic). Oceanologia Acta 11: 377-382.
Furtado VV and Mahiques MM.1989. Distribution of
sediments in the northern coast and continental shelf of the State of São Paulo. Proccedings of Sympo-sium of Ecosystems of the southern and southeastern Brazilian Coast. Aguas de Lindoia, Brazil. Academy of Science of the State of São Paulo, vol. 1: 20-29.
Furtado VV, Bícego MC and Weber RR.1987.
Mod-elo de dispersão de óleo na região do Canal de São Sebastião. Publ. ACIESP 54: 371-388.
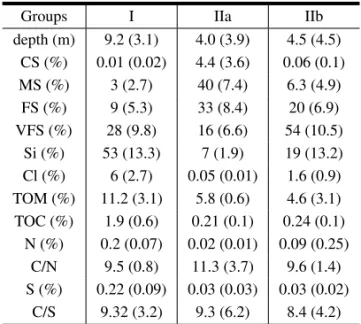
Sedimen-TABLE IV
Mean values of the environmental variables for each one of the three groups performed by the PCA. In parenthesis are given the value of one standar deviation. Abbreviations are the same of table I and II.
Groups I IIa IIb
depth (m) 9.2 (3.1) 4.0 (3.9) 4.5 (4.5) CS (%) 0.01 (0.02) 4.4 (3.6) 0.06 (0.1) MS (%) 3 (2.7) 40 (7.4) 6.3 (4.9)
FS (%) 9 (5.3) 33 (8.4) 20 (6.9) VFS (%) 28 (9.8) 16 (6.6) 54 (10.5)
Si (%) 53 (13.3) 7 (1.9) 19 (13.2) Cl (%) 6 (2.7) 0.05 (0.01) 1.6 (0.9) TOM (%) 11.2 (3.1) 5.8 (0.6) 4.6 (3.1) TOC (%) 1.9 (0.6) 0.21 (0.1) 0.24 (0.1)
N (%) 0.2 (0.07) 0.02 (0.01) 0.09 (0.25) C/N 9.5 (0.8) 11.3 (3.7) 9.6 (1.4) S (%) 0.22 (0.09) 0.03 (0.03) 0.03 (0.02)
C/S 9.32 (3.2) 9.3 (6.2) 8.4 (4.2)
tary diagenesis: organic perspectives with inorganic overlays. Chemical Geology 107: 487-492.
Jackson ML.1964. Análisis químicos de suelos.
Barce-lona: Editorial Omega, S.A, 1964. 662p.
Jørgensen B.1996. Material flux in the sediment. In:
Jørgensen B and Richardson K.(eds.). Coastal
and estuarine studies. American Geophysical Union. p: 115-135.
Kovach WL.1999. MVSP – A Multivariate Statistical
Package for Windows, ver. 3.1. Kovach Computing Services, Pentraeth, Wales, UK, 133p.
Mahiques MM. 1992. Variações temporais na
sedi-mentação quaternária dos embaiamentos da região de Ubatuba, Estado de São Paulo. Doctoral Thesis, Universidade de São Paulo, Instituto Oceanográfico, 2v. 352p.
Mahiques MM.1995. Sedimentary dynamics of the bays
of Ubatuba, State of São Paulo. Boletim do Instituto Oceanográfico, São Paulo 43: 111-122.
Mahiques MM, Tessler MG and Furtado VV.1998.
Characterization of energy gradient in enclosed bays of Ubatuba region, south-eastern, Brazil. Estuarine Coastal and Shelf Science 47: 431-446.
Mudrock A and Macknight SD.1991. CRC
Hand-book of techniques for aquatic sediment sampling. Boca Raton: CRC Press Inc. Boca Raton. Ann Ar-bor. 210p.
Raiswell R and Berner RA.1985. Pyrite formation
in euxinic and semi-euxinic sediments. American Journal of Science 285: 710-724.
Saito Y, Nishimura A and Matsumoto E.1989.
Trans-gressive sand sheet covering the shelf and upper slope off Sendai, Northeast Japan. Marine Geology 89: 245-258.
Stein R.1991. Accumulation of organic carbon in
ma-rine sediments. Results from the Deep Sea Drilling Project/Ocean Drilling Program. Lecture Notes in Earth Sciences, vol. 34. Berlin: Springer-Verlag. 217p.
Suguio K. 1973. Introdução à sedimentologia. São
Paulo, Edgar Blucher/ Editora da Universidade de São Paulo (EDUSP). 317p.
Tyson RV.1995. Sedimentary organic matter. Organic
facies and palynofacies. London: Chapman & Hall. 615p.
Zar JH.1996. Biostatistical analysis. New Jersey: