Printed in Brazil - ©2007 Sociedade Brasileira de Química 0103 - 5053 $6.00+0.00
Article
*e-mail: [email protected]; [email protected]
Distribution of Polycyclic Aromatic Hydrocarbons in Surface Sediments and
Waters from Guanabara Bay, Rio de Janeiro, Brazil
Taís Freitas da Silva, Débora de Almeida Azevedo* and Francisco Radler de Aquino Neto
Instituto de Química, Universidade Federal do Rio de Janeiro Ilha do Fundão, CT, Bl A, Sl 607, 21949-900, Rio de Janeiro, RJ, Brazil
Hidrocarbonetos policíclicos aromáticos (HPAs) foram identificados e quantificados em amostras de água e sedimento em 12 pontos da Baía de Guanabara. As amostras foram analisadas por CG-EM para verificar o grau de contaminação através do monitoramento do ecossistema afetado após o derramamento de óleo que ocorreu em 18 de janeiro de 2000. As concentrações totais de HPAs encontradas nas amostras de sedimento apresentaram valores na faixa de 77 a 7751 µg kg-1 em peso seco e de não detectado a 1592 ng L-1 em amostras de água. A maioria das amostras de sedimento foi classificada como altamente contaminada (HPA > 500 µg kg-1) enquanto a concentração nas amostras de água não apresentou valores suficientemente alto para causar alguma toxidez aos organismos aquáticos. A concentração de HPAs na Baía de Guanabara, quando comparada com outras regiões costeiras, está relativamente alta. Foi utilizada a razão entre HPAs de baixa massa molar/alta massa molar (BMM/AMM), fenantreno/antraceno e benzo[a]antraceno/criseno como indicadores da origem dos HPAs, os quais demonstraram que a grande parte da contaminação da Baía de Guanabara é derivada da queima de combustíveis.
Polycyclic aromatic hydrocarbons (PAHs) were identified and quantified in sediment and water samples from 12 sites in the north-northeast region of the Guanabara Bay. The samples were analyzed by GC-MS to assess the degree of contamination by monitoring the affected ecosystem after an oil spill that occurred in January 18, 2000. Total PAH concentrations ranged from 77 to 7,751 µg kg-1 dry weight in surficial sediment samples and from not detected to 1592 ng L-1 in water samples. The majority of sediment samples were classified as highly contaminated (total PAH > 500 µg kg-1) while for water samples the concentration of PAHs was not sufficiently high to induce acute toxicity to aquatic organisms. In comparison with other coastal areas, PAH concentrations in Guanabara Bay are relatively high. The ratios of low molecular weight/high molecular weight (LMW/HMW) PAHs, phenanthrene/anthracene and benzo[a]anthracene/ chrysene, are sensitive indicators of the origin of PAH pollution, which have shown to be mostly from fuel combustion in the Guanabara Bay.
Keywords: sediment, water, PAHs, Guanabara Bay, oil release, oil spill, water contamination
Introduction
Polycyclic aromatic hydrocarbons (PAHs) are ubiquitous pollutants whose environmental behavior has been investigated for more than 20 years.1 They have been detected in water, soils, sediments, aquatic organisms and food.2 PAHs introduced into the marine environment adhere tightly to sediments due to their low water solubility
and hydrophobic nature.3 Consequently, very high
concentrations of PAHs have been recorded in coastal sediments near urban and industrial cities.4,5
compounds are important in determining their toxicity. Characteristic ratios of individual PAH in sediments such as phenanthrene/anthracene and fluoranthene/pyrene have also been used to determine the dominant sources of PAH contamination.7-11
These hydrocarbons can become dangerous especially if they enter the food chain, since some of the higher PAHs, and their metabolites, can form DNA adducts and thus induce mutations.12,13 Hydrocarbons in sediments originate from several sources which could be summarized in the following categories: (i) petroleum inputs; (ii) hydrocarbons (specially PAHs) released as the result of incomplete combustion of fuels; (iii) PAHs originating from forest and grass fires (transported to the marine environment via eolian (atmospheric) and fluvial (riverine) processes); (iv) biosynthesis of hydrocarbons by marine or terrigenous organisms; (v) early diagenetic transformation from natural products to hydrocarbons; (vi) hydrocarbons diffusing from the mantle, petroleum source rocks or reservoirs.14 PAHs are rarely found as biosyntectic products and have a high toxicity for organisms due to their carcinogenic and mutagenic potential. Because of their low water solubility and hydrophobicity they tend to adsorb to particulate material or deposit in the sediments, where the degradation of PAHs with high molecular weights is particularly slow.15 Kinetic and/or thermodynamic criteria and the nature of organic matter govern the PAH distribution in the environment.16 The mixture of PAH present in a particular sample in many cases mirrors the source that produced the PAH. Several methods can be used to determine the probable sources of PAH. The common method is the calculation of the specific alkylated PAH/parent PAH or parent PAH/parent PAH ratios.17 Difficulties exist in identifying their origins, owing to the possible co-existence of several sources. In addition, physical-chemical properties of some PAH, like physical-chemical reactivity (photooxidation, oxidation), can contribute to modify the original distribution pattern of the emission sources.18
Despite safety efforts from the oil company, oil spill accidents are inevitable and indeed have occurred in the past. In January 18, 2000, when approximately 1,300 m3 of marine petroleum derived fuel oil were released into the Guanabara Bay, as a consequence of a pipeline transference accident at the Duque de Caxias Refinery of Petrobras, the Brazilian Oil Company.
Studies have been carried out regarding the distribution of PAH in waters and sediments of the Guanabara Bay, previous and just after an oil spill.18,19 Furthermore, the purpose of this study was to determine the distribution, the degree of contamination and the sources of sixteen referred PAHs by USEPA as priority pollutants, in sediments and
water samples from 12 sites, during three months, in the Guanabara Bay north-northeast region by means of gas chromatography-mass spectrometry. The data would help evaluate the recovery of the ecosystem before a major spill occurred 2.5 years. The oil spread over the water and reached islands and land shorelines situated at the north and northeast part of the bay, affecting approximately 100 km2 of mangroves and beaches.
Materials and Methods
Description of the studied area
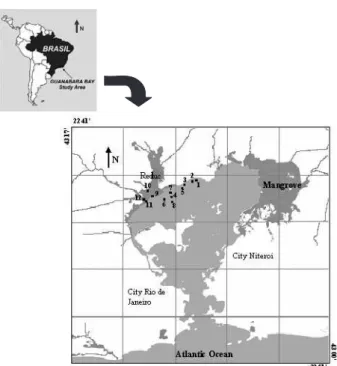
Guanabara Bay has an area of approximately 391 km2 and is between 22° 24’ and 22° 57’ south latitude and 42° 33’ and 43° 19’ west longitude (Figure 1). According to the Brazilian Geographic and Statistic Institute (IBGE) 2003 census data, more than 6 million inhabitants live in the area that directly influence the bay. Besides its high demographic concentration, the Guanabara Bay coastline includes one of the greatest industrial complexes of the country, one refinery (REDUC), two commercial harbours (Rio de Janeiro and Niteroi cities), 16 oil maritime terminals and 12 shipyards, which constitute potential sources of oil pollution.
Sampling
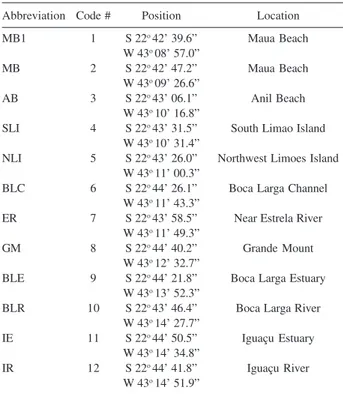
The sediment and water samples reported in this study were collected in July, August and September 2002. The sediment and water site locations are shown in Figure 1 Figure 1. Guanabara Bay map showing the 12 sampling stations next to the Duque de Caxias Refinary of Petrobras (Reduc).
and their coordinates are in Table 1. The twelve sites were sampled during each month, except IE and IR sites, that could not be sampled in September. Surface sediment samples (0-5 cm) were collected with a grab sampler and kept in an aluminum box. Upon return to the laboratory, the sediments were stored at –20 ºC until liophilization to dryness, extraction and analysis were performed.
Subsurface (0.5 m) water samples from the selected sites were collected in 1 L precleaned amber glass bottles and filtered through 0.45 mm glass filters in order to remove suspended particles to avoid degradation. Samples were kept at 4 °C in the dark until analysis.20-22
Chemical standards
Deuterated pyrene (pyrene-d10 98%, Cambridge
Isotope Laboratories, Andovar, USA) was used as an internal standard and a reference mixture of PAHs (EPA 610 Supelco, Bellefonte, USA) containing 100 mg L-1 of anthracene (Ant), benzo[a]anthracene (BaA), benzo[a]pyrene (BaP), benzo[k]fluoranthene (BkF), chrysene (Chry), indeno[1,2,3-cd]pyrene (InP),
phenathrene (Phe) and pyrene (Py); 200 mg L-1 of
benzo[b]fluoranthene (BbF), benzo[g,h,i]perylene (BPe), dibenzo[a,h]anthracene (DBA), fluoranthene (Flt), fluorene (Flu); 1000 mg L-1 of acenaphthene (Ace) and naphthalene (Nap) and 2000 mg L-1 of acenaphthylene
(Acpt) was used as an external standard. The PAH mixture was further diluted with hexane to prepare calibration solutions for GC-MS analyses in the range of 0.0025 to 4 µg mL-1. All solvents used for sample processing and analyses (dichloromethane, acetonitrile, hexane) were chromatographic grade from TediaBrazil (Rio de Janeiro, Brazil).
Sample extraction – water samples
Water samples were extracted using a solid-phase extraction (SPE) Oasis system (Waters, USA). Pyrene-d10 (100 µL at 1 ng mL-1) was added to each water sample previously to extraction. The Oasis SPE cartridges were first conditioned with 6 mL of dichloromethane followed by 6 mL of acetonitrile and 6 mL of distilled water. Water samples (200 mL) were passed through the cartridge under vacuum at a rate of approximately 6 mL min-1. Water residues from cartridges were eliminated by 30 min vacuum. Elution was carried out with 2.5 mL of acetonitrile-dichloromethane (1:1) followed by 3.2 mL of dichloromethane. The solvent was then removed at low temperature (< 35 ºC) by rotary evaporation.19-22
Sample extraction – sediment samples
PAHs were extracted from 10 g of dry sediment by ultrasonication in 50 mL dichloromethane for 20 min. Pyrene-d10 (100 µL at 1 ng mL-1) was added to each sediment sample previously to extraction. The samples were then centrifuged, the dichloromethane extract decanted, and the extraction process repeated two times more. The extracts were combined and concentrated by rotary evaporation. The concentrated extract was fractionated by a silica gel column. The column was eluted first with 6 mL of hexane to remove aliphatic hydro-carbons. Further elution with hexane/dichloromethane (1:1) yielded the PAHs.24 All the extracts were concen-trated, transferred to an autosampler microvial (250 µL), reduced to dryness and blow-down with N2 and finally made up to a volume of 100 µL in dichloromethane.
GC-MS conditions
Gas chromatographic Mass Spectrometric analyses (GC-MS) were carried out on a Hewlett-Packard Model 5972 MSD coupled to a HP5890 GC. Separations were achieved using a capillary column coated with DB-5 (J&W Scientific, 30 m × 0.25 mm i.d., 0.25 µm film thickness). The column temperature for analyses was programmed from 60 ºC to 300 ºC at a rate of 8 ºC min-1 and held at Table 1. Sampling areas identification
Abbreviation Code # Position Location
MB1 1 S 22o 42’ 39.6” Maua Beach
W 43o 08’ 57.0”
MB 2 S 22o 42’ 47.2” Maua Beach
W 43o 09’ 26.6”
AB 3 S 22o 43’ 06.1” Anil Beach
W 43o 10’ 16.8”
SLI 4 S 22o 43’ 31.5” South Limao Island
W 43o 10’ 31.4”
NLI 5 S 22o 43’ 26.0” Northwest Limoes Island
W 43o 11’ 00.3”
BLC 6 S 22o 44’ 26.1” Boca Larga Channel
W 43o 11’ 43.3”
ER 7 S 22o 43’ 58.5” Near Estrela River
W 43o 11’ 49.3”
GM 8 S 22o 44’ 40.2” Grande Mount
W 43o 12’ 32.7”
BLE 9 S 22o 44’ 21.8” Boca Larga Estuary
W 43o 13’ 52.3”
BLR 10 S 22o 43’ 46.4” Boca Larga River
W 43o 14’ 27.7”
IE 11 S 22o 44’ 50.5” Iguaçu Estuary
W 43o 14’ 34.8”
IR 12 S 22o 44’ 41.8” Iguaçu River
300 ºC for 15 min. The injector was heated at 290 ºC. Helium was used as carrier gas. Data acquisition was in electron impact (70 eV) and selected ion monitoring (SIM) mode was used. The standard PAH mixture was also analyzed in SCAN mode in the mass range of 50-400 Daltons. The samples were injected in splitless mode, injection volume of 1 µL. Two characteristic ions were selected for each compound, which together with their retention times, allowed for their identification in SIM mode. Before analysis, relevant standards (reference mixture of PAHs) were run to check column performance, peak height and resolution. With each set of samples to be analyzed, a solvent blank and a standard mixture were run in sequence to check for contamination, peak identification and quantification.
Recoveries
A marine water sample from a non-polluted site was used for recovery evaluation. Compounds were spiked in 200 mL water in three different concentrations (n = 5 each concentration) to give final concentrations in a range of 0.2-4 µg L-1, 0.5-10 µg L-1 and 1-20 µg L-1 for the PAH mixture.
Sediment previously exaustively extracted in a soxhlet apparatus was used for extraction recovery evaluation. The standards were spiked in 8 g of dry sediment to give final concentrations (n = 3 each concentration) in a range of 1-20 µg kg-1, 10-200 µg kg-1 and 100-2000 µg kg-1 for the PAH mixture.
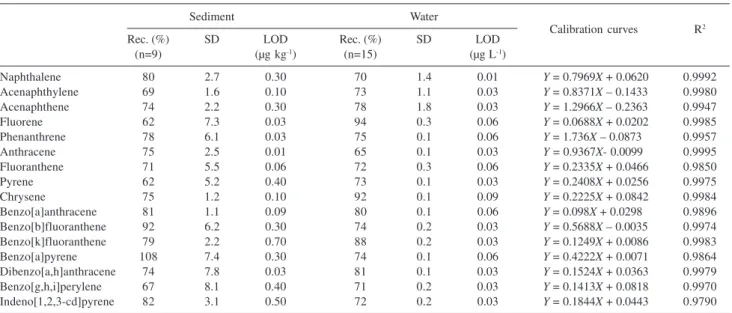
Internal calibration with pyrene-d10 was used for quantification of the extracts. Average recoveries, their
standard deviations and limits of detection (LODs) are presented in Table 2. Data used for the calculation of detection limits was obtained from non-polluted marine water or exhaustively extracted sediment spiked with five different concentrations.
Quantification
External standard calibration curves were used for quantification of the extracts in addition to the pyrene-d10 internal standard. Calibration graphs for SIM mode were plotted using four to six points in the range of concentration 0.0025-4 µg mL-1 for the standard solution mixture. Calibration equation obtained in SIM mode and R2 values are presented in Table 2.
Results and Discussion
Recoveries for each individual PAHs studied in water samples were in the range of 65-94%, with standard deviations of no more than 2% (Table 2). According to the US Environmental Protection Agency (EPA) methods guidelines, acceptable recovery values should be in the range from 70 up to 130% with a maximum relative standard deviation of 30% each.20,25
The calibration curves constructed were linear over the range of interest and correlation coefficients for the majority of compounds were greater than 0.99, indicating good performance of the chromatographic method (Table 2). As shown in Table 2, detection limits for the majority of the compounds in water samples were in the range of 0.01-0.09 µg L-1. Good results were also observed for
Table 2. Polycyclic aromatic hydrocarbons average recoveries (Rec), standard deviations (SD) and limits of detections (LODs), calibration equations and R2 values from sediment and water samples
Sediment Water
Calibration curves R2
Rec. (%) SD LOD Rec. (%) SD LOD
(n=9) (µg kg-1) (n=15) (µg L-1)
Naphthalene 80 2.7 0.30 70 1.4 0.01 Y = 0.7969X + 0.0620 0.9992
Acenaphthylene 69 1.6 0.10 73 1.1 0.03 Y = 0.8371X – 0.1433 0.9980
Acenaphthene 74 2.2 0.30 78 1.8 0.03 Y = 1.2966X – 0.2363 0.9947
Fluorene 62 7.3 0.03 94 0.3 0.06 Y = 0.0688X + 0.0202 0.9985
Phenanthrene 78 6.1 0.03 75 0.1 0.06 Y = 1.736X – 0.0873 0.9957
Anthracene 75 2.5 0.01 65 0.1 0.03 Y = 0.9367X- 0.0099 0.9995
Fluoranthene 71 5.5 0.06 72 0.3 0.06 Y = 0.2335X + 0.0466 0.9850
Pyrene 62 5.2 0.40 73 0.1 0.03 Y = 0.2408X + 0.0256 0.9975
Chrysene 75 1.2 0.10 92 0.1 0.09 Y = 0.2225X + 0.0842 0.9984
Benzo[a]anthracene 81 1.1 0.09 80 0.1 0.06 Y = 0.098X + 0.0298 0.9896
Benzo[b]fluoranthene 92 6.2 0.30 74 0.2 0.03 Y = 0.5688X – 0.0035 0.9974
Benzo[k]fluoranthene 79 2.2 0.70 88 0.2 0.03 Y = 0.1249X + 0.0086 0.9983
Benzo[a]pyrene 108 7.4 0.30 74 0.1 0.06 Y = 0.4222X + 0.0071 0.9864
Dibenzo[a,h]anthracene 74 7.8 0.03 81 0.1 0.03 Y = 0.1524X + 0.0363 0.9979
Benzo[g,h,i]perylene 67 8.1 0.40 71 0.2 0.03 Y = 0.1413X + 0.0818 0.9970
sediment samples, recoveries were between 62-108% and detection limits in the range 0.01-0.7 µg kg-1.
PAH in water
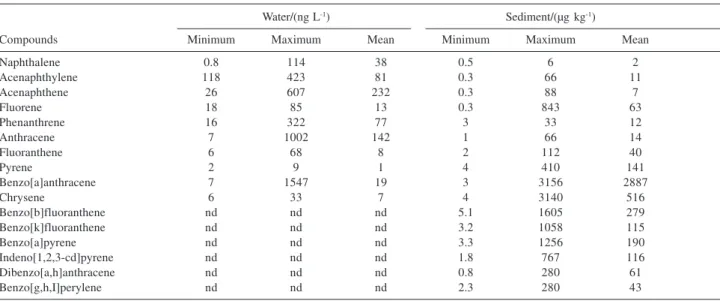
The concentration ranges of individual and total PAHs in water and sediment samples from Guanabara Bay are shown in Table 3.
The average total concentration of 16 PAHs from 34 water samples ranged from not detected at Maua Beach
(MB/July) to 1,592 ng L-1 at Grande Mount (GM/
September) as shown in Figure 2A. These concentration are in a similar range as reported previously by UV-fluorescence spectroscopy in Guanabara Bay to eight samples, 930-2,970 ng L-1 but much lower than those observed 10 days after the oil spill accident, 40-11,560 ng L-1 in chrysene equivalents;19 and also in a similar degree of contamination as São Sebastião, 320 to 2,500 ng L-1 (São Paulo, Brazil).26 Thus, the ecosystem recovery is observed besides the chronic anthropogenic input of PAH into this environment, as a reduction of seven times in the total PAH concentrations was detected.
While PAHs do not show extremely high acute toxicity to aquatic organisms, the lower molecular mass compounds tend to exhibit higher lethal toxicity than the larger PAHs.27 Moreover, lethal concentrations (LC
50) as low as 104 ng L-1 have been reported for certain organisms.24,25 It is clear from Figure 2A that the concentrations of total PAHs at each of the twelve sites are lower than 104 ng L-1, therefore, no acute toxicity is expected to have been caused to organisms. The highest levels, 1,592 ng L-1 and 1,491 ng L-1 were found in GM
and MB stations, respectively, and may be explained by a rainstorm that occurred a day before the September sampling, thus revolving the sediments and water column. In general, lower total PAH concentrations were observed in July (not detected to 893 ng L-1), followed by August (80 Figure 2. Total PAHs concentration in (A) water (ng L-1) and (B) sediment
(µg kg-1) samples from the twelve sites sampled on 3 consecutive months.
Table 3. Range of concentrations of parent PAHs in water and sediments from the twelve collection sites at the Guanabara Bay
Water/(ng L-1) Sediment/(µg kg-1)
Compounds Minimum Maximum Mean Minimum Maximum Mean
Naphthalene 0.8 114 38 0.5 6 2
Acenaphthylene 118 423 81 0.3 66 11
Acenaphthene 26 607 232 0.3 88 7
Fluorene 18 85 13 0.3 843 63
Phenanthrene 16 322 77 3 33 12
Anthracene 7 1002 142 1 66 14
Fluoranthene 6 68 8 2 112 40
Pyrene 2 9 1 4 410 141
Benzo[a]anthracene 7 1547 19 3 3156 2887
Chrysene 6 33 7 4 3140 516
Benzo[b]fluoranthene nd nd nd 5.1 1605 279
Benzo[k]fluoranthene nd nd nd 3.2 1058 115
Benzo[a]pyrene nd nd nd 3.3 1256 190
Indeno[1,2,3-cd]pyrene nd nd nd 1.8 767 116
Dibenzo[a,h]anthracene nd nd nd 0.8 280 61
Benzo[g,h,I]perylene nd nd nd 2.3 280 43
to 1,491 ng L-1), and later, by September (not detected to 1,592 ng L-1). Despite that, no significant temporal and spatial PAH trends were observed to these water samples.
The high-molecular mass PAHs such as benzo[b] fluoranthene, benzo[k]fluoranthene, benzo[a]pyerne, indeno[1,2,3-cd]pyrene, benzo[g,h,i]perylene and dibenzo[a,h] anthracene, were not detected in the water samples, this fact may be attributed to their lower water solubility. Benzo[a] anthracene and anthracene always showed the largest concentrations in water sample (Table 3).
Brazilian regulation (CONAMA Administrative Rule No. 357/2005)28 specifies that benzo[a]pyrene detection should not exceed 0.05 µg L-1 in drinking water, while the Brazilian Health Ministry (Regulation No. 518/2004)29 specifies a value of 0.70 µg L-1. Benzo[a]pyrene was not detected in any of the Guanabara water samples analyzed. The maximum admissible concentration of polycyclic aromatic hydrocarbons (sum 6 PAHs levels: fluoranthene, benzo[b]fluoranthene, benzo[k]fluoranthene, ben-zo[a]pyrene, benzo[g,h,I]perylene, indeno[1,2,3-cd]pyrene) in drinking water is 0.2 µg L-1 according to the European Community (EC) regulations,25 has been achieved only in one water sample, the SLI/September (0.38 µg L-1).
Comparison of total PAHs concentrations with other coastal areas is not the best approach because characteristics of the sampling area and number of PAH compounds analyzed in each study may not be the same. Total parent PAH concentration (ng L-1) in subsurface water from various marine sites in the world is shown in Table 4. Based on this limited comparison, it appears that the range of PAH level is similar to other locations shown in Table 4.
Sediment pollution levels
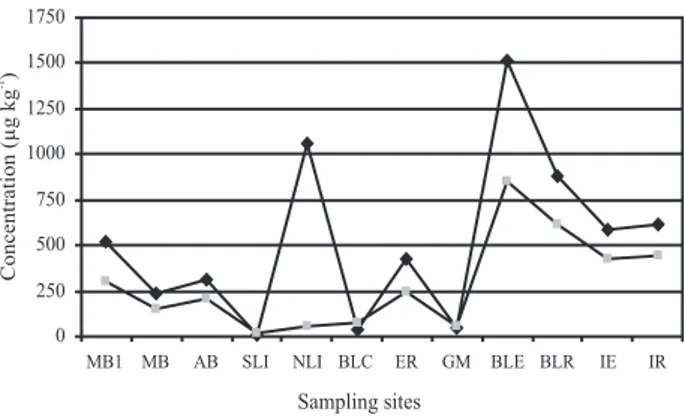
The concentration of individual PAH determined in 34 sediment samples collected for this study is also described in Table 3. The total concentration of PAH in Guanabara Bay sediments varied from 77 to 7,751 µg kg-1 dry weights. In general, the highest concentrations were
observed at Boca Larga Estuary (BLE, station 9) and Boca Larga River (BLR, station 10) nearest to the Oil Refinery (Figure 1), during the three months (Figure 2B). They were followed by Iguaçu River Estuary and Iguaçu River (station 5 and 6, respectively) and later by Estrela River Estuary (station 1). These five station are the nearest to the REDUC oil refinery. Samples may be classified as “highly contaminated” if total PAH concentrations are higher than 500 µg kg-1, “moderately contaminated” at 250 µg kg-1 to 500 µg kg-1 total PAH, and “slightly contaminated” if total PAHs are below 250 µg kg-1.16 Our data demonstrates that these sediment samples are classified as moderately to highly contaminated.
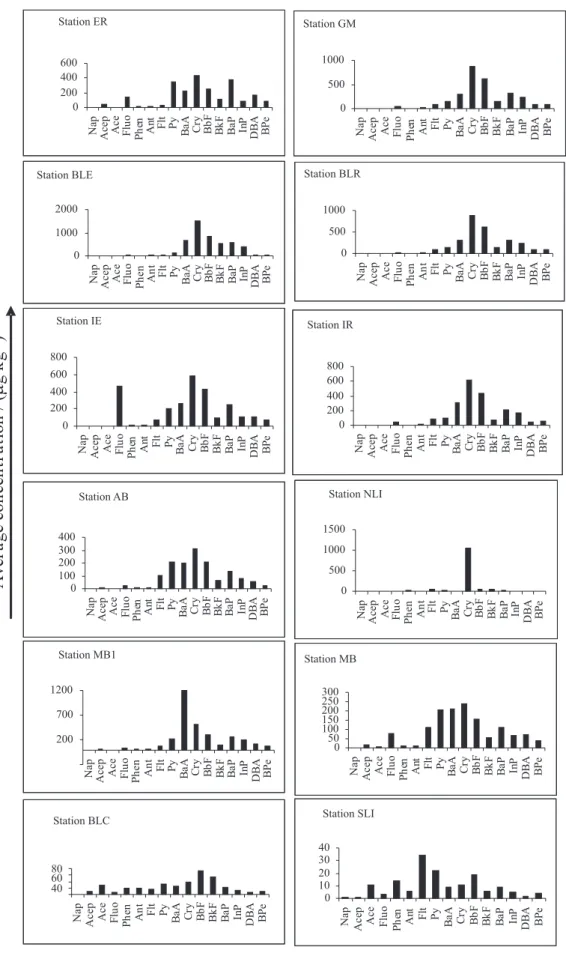
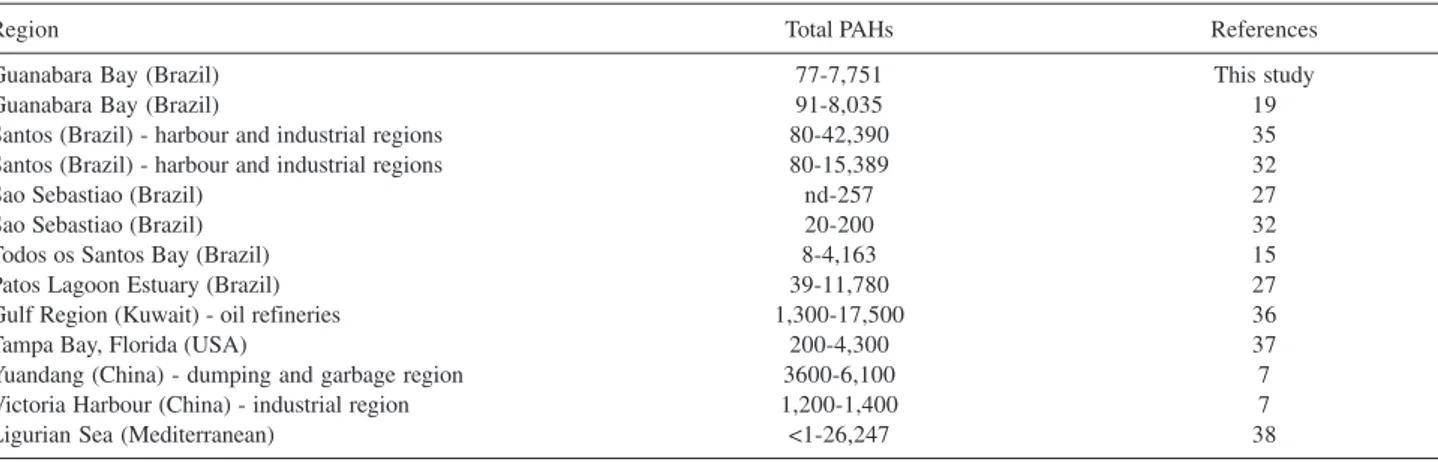
Chrysene and benzo[b]fluoranthene were the major PAH in the majority of the samples analyzed, showing the highest concentration in Boca Larga Estuary (BLE, station 9) and Boca Larga River (BLR, station 10), nearest to the Oil Refinery, as the total PAH trend, as illustrated in Figure 3. For all 16 PAH studied (Figure 4), the minimum concentration determined was 0.3 µg kg-1 dry weight for fluorene and 3,156 µg kg-1 for benzo[a] anthracene (Table 3). The concentration of individual PAHs was also lower than the sediment quality criteria proposed by USEPA (1993) for fluoranthene (3,000 µg kg-1 dry wt.), acenaphthylene (2,400 µg kg-1) and phenanthrene (2,400 µg kg-1). Thus, it appears that the concentrations of PAH in sediments, in this study, were insufficient to cause any major adverse biological effect. The analysis and comparison of the total sedimentary PAH levels in this study with coastal Brazilian sediments and worldwide data shows that the Guanabara Bay results, (77 to 7,751 µg kg-1)are similar to the observed in 2000, just 10 days after the oil spill accident, (91 to 8,035 µg kg-1) 19, and lower than the observed in Patos Lagoon Estuary30 (39 to 11,780 µg kg-1) and Santos31 (80 to 15,389 µg kg-1)as is illustrated in Table 5. A review of published studies of PAH Table 4. Concentration of total PAHs (ng L-1) in selected Brazilian and
worldwide waters
Region total PAHs Reference No.
Guanabara Bay (Brazil) 79-1,592 This study
Guanabara Bay (Brazil) 930-2,970 18
Guanabara Bay (Brazil) 40-11,560 19
Sao Sebastiao (Brazil) 350-2,500 27
Seawater around England nd-24,800 30
Xiamen Harbour (China) 106-945 24
Seine River and Estuary (France) 4-36 25
Balti Sea (France) 0.3-0.549 25
nd = not detected.
in near-shore surface marine sediments from Australia indicated concentrations of 4-rings PAH in the around of 102
µg kg-1, with concentrations of pyrene as high as 4970 µg kg-1 dry weight in urban and/or industrial catchments; such areas were considered to be highly polluted.32 In the present study, the maximum pyrene concentrations was 409.9 µg kg-1 dry weight in Estrela River (Figure 4), meaning that the studied area is to be considered slightly contaminated.
Sources of PAH contamination
The distribution of PAHs found in sediments gives information about the precursor sources. Molecular indices based on PAHs physical-chemical behavior covariability were developed to assess the origin of these pollutants; making use of these parameters it is possible to suppose which process generated such hydrocarbon in the studied matrices.12 The difficulty in identifying PAH origin is the possible coexistence of many contamination sources, and the transformation process that PAHs can undergo before deposition in the analyzed sediments.15 Nevertheless, some compounds could exhibit comparable evolution kinetics that could be used to identify the origin of organic matter in the environment. The use PAH ratios for source assignments in sediments requires an understanding of the relative discrimination ability (relative thermodynamic stability) of different parent PAHs, the characteristics of different PAH source and the changes in PAH composition between source and sediment (the relative stability of different PAH isomers
and PAHs from different sources).33 For example,
phenathrene/anthracene, fluoranthene/pyrene and benzo[a]anthracene/chrysene ratios have been commonly used to determine the dominant origin of PAHs.9,12 In general, no more than two criteria are used to determine possible sources, because using more criteria can lead to different and ambiguous interpretation of the results.17
To find the origin of the pollution in the Guanabara Bay sediment samples, we first examined the sum of the low molecular weight PAH concentrations over the sum of high molecular weight PAH concentrations (Low/High ratios), as demonstrated in Figure 5. Petrogenic contamination is characterized by the predominance of the low molecular weight (tri and tetra-aromatic PAHs), while the high molecular weight PAHs dominates the pyrolytic PAH distributions.12,16 The majority of the samples in this study yielded LMW/HMW ratios lower than 1, indicating a pyrolytic origin for the PAH contaminants.16 Only sampling area revealed LMW/HMW ratio values higher than 1 (SLI station), indicating that this station was contaminated mainly by petrogenic PAHs.
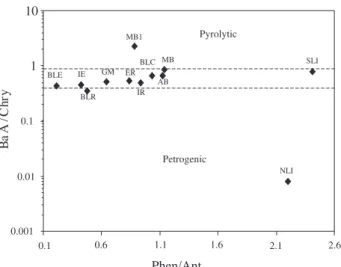
In order to further characterize the PAH inputs, the phenanthrene to anthracene (Phen/Ant) abundance ratio was plotted against BaA/Chry (benzo[a]anthracene to chrysene concentrations; Figure 6). The assessment based on the individual values of the Phen/Ant ratio did not indicate a petrogenic origin of PAH for any sample; all sites were characterized as being dominated by pyrolytic Table 5. Concentration of total PAHs (µg kg-1) in selected Brazilian and worldwide sediments
Region Total PAHs References
Guanabara Bay (Brazil) 77-7,751 This study
Guanabara Bay (Brazil) 91-8,035 19
Santos (Brazil) - harbour and industrial regions 80-42,390 35
Santos (Brazil) - harbour and industrial regions 80-15,389 32
Sao Sebastiao (Brazil) nd-257 27
Sao Sebastiao (Brazil) 20-200 32
Todos os Santos Bay (Brazil) 8-4,163 15
Patos Lagoon Estuary (Brazil) 39-11,780 27
Gulf Region (Kuwait) - oil refineries 1,300-17,500 36
Tampa Bay, Florida (USA) 200-4,300 37
Yuandang (China) - dumping and garbage region 3600-6,100 7
Victoria Harbour (China) - industrial region 1,200-1,400 7
Ligurian Sea (Mediterranean) <1-26,247 38
nd: not detected.
Figure 5. Plot of sum of low molecular weight PAH concentrations
versus sum of high molecular weight PAH concentrations for sediment samples in the 12 sampling sites.
LM
W
/H
M
W
MB1 MB AB SLI NLI BLC ER GM BLE BLR IE IR
Sampling areas
contamination (Phen/Ant < 10).14 On the other hand, 90% of the Flu/Py ratio (fluoranthene to pyrene concentrations) presented petrogenic input (Flu/Pyr > 1). The likely origins of these contaminants are emissions from fossil fuel combustion from the petrochemical industry nearby. However, if other PAH ratios such as BaA/Chry are taken into account, it can be seen that the majority of sediments present a mixture of both pyrolytic (BaA/Chry > 0.9) and petrogenic (BaA/Chry ≤ 0.4) inputs. The results therefore suggest that PAHs in the Guanabara Bay area are derived from both the combustion of fossil fuel together with some petrogenic inputs.
Based on the diagnostic PAH ratios, the great majority of 34 sediment samples present a mixture of petrogenic and pyrolytic inputs. This conclusion is in agreement with the previous published study undertaken 10 days later the oil spill accident.19 Thus, a significant background of chronic anthropogenic inputs to the area is observed.
Conclusions
The present work represents the study of the distribution and origin of PAHs in sediments and waters of Guanabara Bay, as being an economically important Brazilian region due to marine, industrial and tourism activities.
For the 34 sediment samples collected in July-September, 2002, total PAH concentrations ranged from 77 µg kg-1 to 7,751 µg kg-1 and are dominated by higher molecular weight compounds. The later indicates that the contamination may derive predominantly from combustion of biomass or fossil fuels. Furthermore, based on selected PAH ratios it was observed that the majority of sediments present a mixture of both pyrolytic and petrogenic inputs.
Therefore, the results suggest that PAHs in the Guanabara Bay area are derived from both the combustion of fossil fuel together with some direct petrogenic input.
For the water samples, the total PAH concentrations ranged from not detected to 1,592 ng L-1 and are dominated by low molecular weight compounds as acenaphthylene and anthracene. These values are well below the LD50 of 10,000 ng L-1. Even though, the majority of sediment samples were classified as moderately to highly contaminated, the PAH concentration in the water samples are not at a sufficient level to show acute toxicity. In comparison with waters from other urbanized coastal areas worldwide, the measured PAH content of the Guanabara Bay would indicate it to be moderately contaminated.
Acknowledgments
The authors acknowledge the fellowships from CNPq, the Brazilian Research Council. This study was supported by IBAMA (the Brazilian Environmental Institute), FAPERJ and FUJB.
References
1. Lopes, W.A.; Andrade, J.B.; Quim. Nova1996, 19, 497. 2. Kayal, S.; Connell, D.W.; Coast. Shelf Sci. 1995, 40, 475. 3. Varanasi, U.; Stein, J.E.; Nishimoto, M. In Biotransformation
and Disposition of PAH in Fish, Varanasi. U. ed., CRC Press: Boca Raton, Florida, 1995.
4. Lipitou, E.; Saliot, A.; Mar. Pollut. Bull. 1991, 22, 297. 5. Hong, H.; Xu, L.; Zhang, L.; Chen, J. C.; Wong, Y. S.; Wan, T.
S. M.; Mar. Pollut. Bull. 1995, 31, 229.
6. Pereira Netto, A.D.; Moreira, J.C.; Dias, A.E.X.O.; Arbilla, G.; Ferreira, L.F.V.; Oliveira, A.S.; Barek, J.; Quim. Nova2000,
23, 765.
7. Yang, S.Y.N.; Connel, D.W.; Hawker, D.W.; Kayal, S.I.; Sci.
Total Environ. 1991, 102, 229.
8. Budzinski, H.; Jones, I.; Bellock, J.; Piérard, C.; Garrigues, P.;
Mar. Chem. 1997, 58, 85.
9. Trapido, M.; Environ. Pollut. 1999, 105, 67. 10. Yang, G.P.; Environ. Pollut.2000, 108, 163.
11. Gomes, A.O.; Azevedo, D.A.; J. Braz. Chem. Soc.2003, 14, 358.
12. Magi, E.; Bianco, R.; Ianni, C.; Di Carro, M.; Environ. Pollut.
2002, 119, 91.
13. Chen, L.; Quim. Nova1980, 3, 152.
14. Readman, J. W.; Fillman, G.; Tolosa, I., Bartocci, J.; Villeneuve, J. -P.; Catinni, C.; Mee, L.D.; Mar. Pollut. Bull.2002, 44, 48. 15. Venturini, N.; Tommasi, L. R.; Mar. Pollut. Bull.2004, 48, 97. 16. Soclo, H. H.; Garrigues, P. H.; Ewald, M.; Mar. Pollut. Bull.
2000, 40, 387. Figure 6. Plot of the (Phen/Ant) versus (BaA/Chry) isomeric ratios for
the 12 studied sites 1
10
Phen/Ant
Ba
A
/C
h
ry
BLE
0.1 0.6 1.1 1.6 2.1 2.6
0.001 0.01 0.1
IE BLR
GM ER
IR MB1 BLC
AB
MB SLI
NLI
17. Notar, M.; Leskovsek, H.; Faganeli, J.; Mar. Pollut. Bull. 2001,
42, 36.
18. Hamacher, C.; Brito, A.P.X.; Bruning, I.M.R.A.; Wagener, A.; Moreira, I.; Rev. Bras. Ocean. 2000, 48, 167.
19. Meniconi, M. F. G.; Gabardo, I.T.; Carneiro, M. E. R.; Barbanti, S. M.; Manssone, C. G.; Silva, G. C.; Environ. Forens. 2002, 3, 303.
20. Azevedo, D.A.; Lacorte, S., Vinhas, T.; Viana, P., Barceló, D.;
J. Chromatogr. A.2000, 879, 13.
21. Azevedo, D.A.; Lacorte, S.; Viana, P.; Barceló, D.;
Chromatographia2001, 53, 113.
22. Azevedo, D.A.; Gerchon, E.; Reis, E. O.; J. Braz. Chem. Soc. 2004, 15, 292.
23. Winslow, S.D.; Prakash, B.; Domino, M.M.; Pepich, B.V.; Munch, D.J.; US EPA Method 526. Determination of selected semivolatile organic compounds in drinking water by solid phase extraction and capillary column gas chromatography/ mass spectrometry (GC/MS). National Exposure Research Laboratory office of Research and Development U.S., 2000. 24. Zhou, J.L.; Hong, H.; Zhang, Z.; Maskaoui, K.; Chen, W.; Water
Res. 2000, 7, 2132.
25. Zhou, J.L.; Maskaoui, K.; Environ. Pollut. 2003, 121, 269. 26. Hennion, M.C.; Richon, V.; Barceló, D.; Trends Anal. Chem.
1994, 13, 361.
27. Zanardi, E.; Bícego, M. C.; Miranda, L. B.; Weber, R. R.; Mar. Pollut. Bull. 1999, 4, 261.
28. CONAMA, Administrative Rule Nº 357, 17/03/2005, Ministério do Meio Ambiente, Conselho Nacional do Meio Ambiente, (available at www.mma.gov.br/conama/res/res05/res35705.pdf).
29. Health Ministry Administrative Rule MS Nº 518/2004, Ministério da Saúde, Secretaria de Vigilância em Saúde, Coordenação-Geral de Vigilância em Saúde Ambiental, Editora do MS: Brasília, 2005. 28p.
30. Law, R.J.; Dawes, V.J.; Woodhead, R.J.; Mattiessen, P.; Mar. Pollut. Bull. 1997, 34, 306.
31. Medeiros, P. M.; Bícego, M. C.; Castelao, R. M.; Rosso, C. D.; Fillmann, G.; Zamboni, A.; Environ. Internat.2005, 31, 77. 32. Medeiros, P. M.; Bícego, M. C.; Mar. Pollut. Bull.2004, 49,
761.
33. Maher, W.A.; Aislabie, J.; Sci. Total Environ. 1992, 112, 143. 34. Yunker, M.B.; Macdonald, R.W.; Vingarzan, R.; Mitchell, R.H.;
Goyette, D.; Sylvestre, S.; Org. Geochem. 2002, 33, 489. 35. Nishigama, F.W.; Weber, R.R.; Bícego, M.C.; Mar. Pollut. Bull.
2001, 11, 1064.
36. Fowler, S.W.; Readman, J.W.; Oregione, B.; Villeneuve, J.P.; Mckay, K.; Mar. Pollut. Bull. 1993, 27, 171.
37. Sherblom, P.M.; Kelly, D.; Pierce, R.H.; Mar. Pollut. Bull. 1995,
305, 68.
38. Bertolotto, R.M.; Ghioni, F.; Frignani, M.; Aguilar, D.A.; Bellucci, L.G.; Cuneo, C.; Picca, M.R.; Gollo, E.; Mar. Pollut. Sea Life2003, 46, 903.
Received: April 6, 2006