FILTERED MODIS NDVI AND NEURAL NETWORKS
Thomaz Chaves de Andrade Oliveira1, Luis Marcelo Tavares de Carvalho2, Luciano Teixeira de Oliveira3, Adriana Zanella Martinhago4, Fausto Weimar Acerbi Júnior5, Mariana Peres de Lima6
(received: March 30, 2009; accepted: February 26, 2010)
ABSTRACT: Multi-temporal images are now of standard use in remote sensing of vegetation during monitoring and classification. Temporal vegetation signatures (i. e., vegetation indices as functions of time) generated, poses many challenges, primarily due to signal to noise-related issues. This study investigates which methods generate the most appropriate smoothed curves of vegetation signatures on MODIS NDVI time series. The filtering techniques compared were the HANTS algorithm which is based on Fourier analyses and Wavelet temporal algorithm which uses the wavelet analysis to generate the smoothed curves. The study was conducted in four different regions of the Minas Gerais State. The smoothed data were used as input data vectors for vegetation classification by means of artificial neural networks for comparison purpose. A comparison of the results was ultimately discussed in this work showing encouraging results and similarity between the two filtering techniques used.
Key words: Remote sensing, signal processing, time series, wavelets analysis, Fourier.
MAPAMENTO DE FLORESTAS DECÍCUAS ATRAVÉS DE REDES NEURAIS ARTIFICIAIS E SÉRIES TEMPORAIS DE NDVI MODIS
RESUMO: Imagens multitemporais são de pronominal uso no Sensoriamento Remoto, para o monitoramento e classificação da vegetação. As decorrentes assinaturas temporais da vegetação possuem muitos desafios na sua utilização em razão da elevada relação sinal/ruído. Este estudo investigou dois métodos para gerar assinaturas temporais suavizadas de vegetação do índice de vegetação de diferença normalizada (NDVI), sendo estas originadas do sensor MODIS. As técnicas de filtragem utilizadas foram o algoritmo baseado em Fourier HANTS e algoritmo Wavelet Temporal que utiliza análise Wavelet. O estudo foi conduzido em 4 diferentes conjuntos de dados, correspondente a áreas separadas geograficamente no estado de Minas Gerais. Para realizar a comparação entre as séries temporais filtradas pelos diferentes algoritmos, as séries filtradas foram utilizadas como entradas de dados para classificação da vegetação em diferentes fitofisionomias. A Classificação foi feita por meio das redes neurais artificiais. O resultado dessa classificação mostrou similaridade entre os métodos de filtragem de séries temporais NDVI comparados neste trabalho.
Palavras-chave: Sensoriamento remoto, processamento de sinais, análise wavelets,Fourier.
1 INTRODUCTION
Mapping land cover by means of remotely sensed data has been a research of growing interest in the past decades. Its peculiarities and state of art of computer aided methods and studies go beyond conventional cartographical tools (CARVALHO, 2001). The advances
of computer science, engineering, and all sciences surrounding remote sensing, continue to present new technologies to map land cover.
Some objects on the Earth´s surface reflect the electromagnetic energy in the same way when sensed with a multi-spectral scanner, in addition ‘objects’ reflectance may vary according to growth stage, phenology, humidity,
1Barchelor in Computer Science, DS candidate in Eletrical Engineering – Faculdade de Engenharia Elétrica e de Computação –
Universidade Estadual de Campinas/UNICAMP – Av. James Clerck Maxwell, Cidade Universitária “Zeferino Vaz” – 3013083-868 – Campinas, SP, Brasil – thomazchaves@gmail.com
2Forest Engineer, Professor DS in Geoscience and Environment – Departamento de Ciências Florestais/DCF – Universidade Federal de
Lavras/UFLA – Cx. P. 3037 – 37200-000 – Lavras, MG, Brasil – passarinho@dcf.ufla.br
3Forest Engineer, DS candidate in Forest Engineering– Departamento de Ciências Florestais/DCF Universidade Federal de Lavras/UFLA –
Cx. P. 3037 – 37200-000 – Lavras, MG, Brasil – oliveiralt@yahoo.com.br
4Barchelor in Computer Science, DS candidate in Forest Engineering – Departamento de Ciências Florestais/DCF – Universidade Federal
de Lavras/UFLA – Cx. P. 3037 – 37200-000 – Lavras, MG – dricazm@gmail.com
5Forest Engineer, Professor MS in Environmental Management – Departamento de Ciências Florestais/DCF – Universidade Federal de
Lavras/UFLA – Cx. P. 3037 – 37200-000 – Lavras, MG, Brasil – fausto@dcf.ufla.br
6 Forest Engineer, Professor MS in Forest Engineering– Universidade Federal do Mato Grosso – Campus Sinop – 78550-000 – Sinop,
atmospheric transparency, illumination conditions, etc. These drawbacks led to a search for alternative attributes to enable the discrimination of land cover classes with similar reflectance behavior (CARVALHO et al., 2004).
These attributes, especially temporal information, are very useful for characterizing deciduous forests in the Cerrado biome, due to their pronounced dynamics. This can be noticed in the official forest map of Minas Gerias state, carried out by Carvalho (2008), which does not capture a deciduous forests fragments present in the region of the Triângulo Mineiro, due to the time of acquisition of the available images. For example, there is a 25ha fragment of dry Deciduous Forests on the margins of Rio Paranaíba, in fazenda Bonanza, municipality of Santa Vitória (OLIVEIRA-FILHO et al., 1998), which was misclassified as semideciduous forest. Research however, suggests that remotely sensed time series data could possibly improve misclassification and the accuracy of mapping deciduous forests (OLIVEIRA, 2004).
Deciduous Forests are characterized by an alternating cycle of dry and wet seasons. More than 70 % of deciduous forests leaves are off in the dry season (OLIVEIRA-FILHO, 2006). The period of dryness occurs from mid April until September. The wet season starts in October and goes up to March. This leads to an intensified variation of greenness in vegetation and landscape characterization throughout time. The variation of greenness of the semi-deciduous forests is not so intense, due to their occurrence in regions of intensified humidity (OLIVEIRA, 2004).
According to Zhang et al. (2003), field-based ecological studies have demonstrated that vegetation phenology tends to follow relatively well defined temporal patterns. For example, in deciduous vegetation and many crops, leaf emergence tends to be followed by a period of rapid growth, followed by a relatively stable period of maximum leaf area. Different types of vegetation have different temporal growth patterns (i.e., different growth and senescence rates) (BRUCE et al., 2006). Vegetation dynamics indicate important short and long-term ecological process. Continuous temporal observations of land surface parameters using remote sensing reveal seasonal and inter-annual developments. Vegetation indices have been extensively applied to characterize the state and dynamics of vegetation, in particular multiple NDVI (Normalized
Difference Vegetation Index) datasets of the Advanced Very
High Resolution Radiometer (AVHRR) instrument used during the last 25 years (COLDIZ et al., 2007; JENSEN, 2000).
Different vegetation types exhibit distinctive seasonal patterns on NDVI variation (YU et al., 2004). A vegetation index should maximize sensitivity to plant biophysical parameters; normalize or model external factors such as sun angle, viewing angle, and the atmosphere for consistent spatial and temporal comparisons; normalize internal effects such as canopy background variations; and couple with measurable biophysical parameters such as biomass, LAI, or APAR (JENSEN, 2000).
Spatial and temporal variability in vegetation indices arise from several vegetation related properties, including LAI, canopy structure/architecture, species composition, land cover type, leaf optics, canopy crown cover, understory vegetation, and green leaf biomass (HUETE et al., 2002).
The main objective of this work was to develop a methodology to map the deciduous forests present in the Cerrado biome based on the use of temporal attributes. The research seeks to find whether MODIS filtered NDVI (Normalized Difference Vegetation Index) time series can generate accurate mapping to deciduous forests in different regions. This study also had the goal of testing which of two filtering techniques produced the best map.
2 MATERIAL AND METHODS 2.1 The MODIS sensor
MODIS Vegetation Indices (VI) products are appropriate for vegetation dynamics studies and characterization. MODIS-VI are found to be sensitive to multi-temporal (seasonal) vegetation variations and to be correlated with LAI across a range of canopy structure types, species and life forms, land cover variations. The MODIS NVDI demonstrates an appropriate dynamic range and sensitivity for monitoring and assessing spatial and temporal variations in vegetation amount and condition. The seasonal profiles outperform in sensitivity and fidelity the equivalent AVHRR-NDVI profiles, particularly in atmosphere with water vapor contents (HUETE et al., 2002) 2.2 Study site
For generalization purposes, the processes applied in this work, filtering and mapping were conducted in four geographically different regions, thus resulting in four different data sets for comparison purposes.
The widespread occurrence of deciduous forests in the state of Minas Gerais led to the choice of study areas (Figure 1) according to the locations of deciduous forest fragments extracted from the Treeatlan data base
(OLIVEIRA-FILHO, 2009a). Treeatlan is essentially an interactive database created in the Access environment which contains binary information on the occurrences of arborous species in pre selected areas of South America. It also contains descriptive data surrounding these areas, and their environmental conditions. Treeatlan has also sources of information for the compiling species lists. The resulting images have 98 by 98 pixels that correspond to 4,9 km² areas. 2.3 Data acquisition
The NDVI time series was derived from the MOD13 product, which has a spatial resolution of 250m, and has a 16-day compositing period. This product is freely available for download from the MODIS website via FTP protocol. The original data was reprojected using MRT(MODIS Reproduction Tool). A set of temporal images from the Landsat TM sensor were also used as auxiliary data. These images were collected from summer and winter dates to each area and were used so that the exact locations of the deciduous forests fragments and other types of vegetation were known in advance. The data set has 23 images per year and included the years of 2003, 2004 and 2005.
Figure 1 – The location of the four different data subsets.
2.4 Signal denoising
In order to extract pertinent features from time signatures for potential target applications, the signals must first be denoised. Authors have investigated automated methods for denoising, including straightforward methods such as median filters and moving-average filtering, as well as more advanced methods such as wavelet denoising (BRUCE et al., 2006). Curve fitting parameterization using logistic functions have also succeeded in generating time signatures of MODIS VI (ZAHNG et al., 2003).
2.4.1 Fourier AnSalysis HANTS
The Fourier Analyses or Harmonic analyses have been used traditionally to solve differential and partial equations in the fields of mathematics and physics. Its main objective is to approximate a function in the time domain by a linear combination of harmonics (sinusoids) (MORETTIN & TOLOI, 2006).
The most basic property of the sinusoids that makes them suitable for the analysis of time series is their simple behavior under a change in time scale (BLOOMFIELD, 1976).
Fourier analysis have been traditionally used for denoising and curve fitting in MODIS VI data sets (BRUCE et al., 2006; COLDITZ et al., 2007; WANG et al., 2004; YU et al., 2004). If the original data is discrete rather than continuous, the discrete Fourier transform (DFT), which requires regular spacing on samples within the temporal domains, should be applied (WANG et al., 2004).
There is a drawback in this approach, since the NDVI images are composite images of different dates. The pixels have different acquiring dates that lead unequal time spacing. However, the HANTS (Harmonic Analysis of Time Series) algorithm was developed to deal with time series of irregularly spaced observations and to identify and remove cloud contaminated observations (ROERINK et al., 2000; VERHUEF, 1996).
The HANTS algorithm considers only the most significantcant frequencies expected to be present in the time profiles (determined, for instance, from a preceding FFT analysis), and applies a least squares curve fitting procedure based on harmonic components (sines and cosines) (ROERINK et al., 2000; VERHUEF, 1996). For each frequency the amplitude and phase of the cosine function is determined during an iterative procedure. Input data points that have a large positive or negative deviation from the current curve are removed by assigning a weight of zero to them. After recalculation of the coefficients on
the basis of the remaining points, the procedure is repeated until the maximum error is acceptable or the number of remaining points has become too small (ROERINK et al., 2000).
Many different phenological indicators have been defined in various satellite-based studies. The advantage of the HANTS algorithm is that the output consists of a completely smoothed NDVI profile which is convenient for calculating derivatives (WIT & SU, 2005) The calculations of derivates are very important for the estimation the start of growing season and senescence dates (SAKAMOTO et al., 2005).
The version of HANTS used was implemented in IDL by (WIT, 2005) and is under the GNU General Public License. The data set of temporal NDVI images, which contained a series of 23 samples per year was input to the HANTS algorithm. The output is a similar time series but smoothed and containing only the annual, 6 months and 3 months frequencies of the signal. The resulting different data sets were used as input data sets for image classification.
2.4.2 Wavelet transform
Fourier series are ideal for analyzing periodic signals, since harmonics modes used in the expansions are themselves periodic. In contrast, the Fourier integral transform is a far less natural tool because it uses periodic functions to expand nonperiodic signals. Two possible substitutes are the windowed Fourier transform (WFT) and the wavelet transform. The windowed Fourier transform can, however, be an inefficient tool to analyze regular time behavior that is either very rapid or very slow relative to the size of the analyzing window. The Wavelet transform solves both problems by replacing modulation with scaling to achieve frequency localization. The WFT might also be an inefficient tool when very short time intervals are of interest. On the other hand, a similar situation occurs when very long and smooth features of the signal are to be reproduced by the WFT (KAISER, 1994).
Different from the infinite sinusoidal waves of the Fourier transform, a wavelet is a small wave localized in time or space. Since a wavelet has compact support, which means that its value becomes 0 outside a certain interval of time, the time components of time-series can be maintained during the wavelet transformation (SAKAMOTO et al., 2005).
procedures in NDVI time series (BRUCE et al., 2006; GALFORD et al., 2007; SAKAMOTO et al., 2005).
For the present work, it was used the methodology proposed by (CARVALHO, 2001). In remote sensing outliers caused by clouds and shadows (noise) appear as peaks with narrow bandwidth in the temporal spectrum. They appear similar in the spatial domain, but with variable bandwidth. If we consider the presence of clouds and shadows as signal response against a “noisy” background, a framework for their detection can be based on noise modeling in transformed space. The discrete wavelet transform was implemented with the ‘à trous’ algorithm with a linear spline as the wavelet prototype. A discrete approach to the classical continuous wavelet transform is represented by the ‘à trous’ algorithm. The input signal is analyzed by using the coefficients of a properly chosen low-pass filter, but in contrast to the latter, all frequency sub bands are retained with full resolution. It produces a vector of wavelet coefficients d at each scale j, with j=0,…,J. The original function f(t) was then expressed as the sum of all wavelets scales and the smoothed version aj. The input signal was decomposed using one scale, two scales and three scales. The resulting different data sets were used as inputs for image classification, described in the following section.
2.5 Image classification
One way to compare the two filtering techniques is to use the output smoothed NDVI time series as input vectors to automated image classification procedures.
For Moreira (2003) automatic image identification and classification can be understood as the analyses and the manipulation of images through computational techniques, with the goal of extracting information regarding an object of the real world.
2.6 Image classification using artificial neural networks Humans and other animals process information with neural networks. These are formed from trillions of neurons (nerve cells) exchanging brief electrical pulses called action potentials. Computer algorithms that mimic these biological structures are formally called artificial neural networks to distinguish them from the squishy things inside of animals (SMITH, 1998). These biological inspired models are extremely efficient when the pattern of classification is not a simple and trivial one. Theses networks have shown to be helpful in the resolution of problems of practical scope. Problems such as voice recognition, optical character
recognition, medical diagnosis and other practical scope problems are by no means complex problems to the human brain and sensor as they are for a computer to resolve.
Even though, some researchers do not recognize the artificial neural networks as being the general natural solution surrounding the problems of recognizing patterns on processed signals, it can be noticed that a well trained network is capable of classifying highly complex data. The use of artificial neural networks in pattern recognition and classification has grown in the last years in the field of remote sensing (KANELLOPOLOUS, 1997).
This work proceeded with 2 filtered data sets per region, these data sets included one HANTS filtered time series and one Wavelets filtered time series. The Artificial Neural Network parameters were extracted from literature based on standard applications of neural to remote sensing image classification: Sigmoidal activation function, 0.01 learning rate, momentum factor of 0.5, sigmoid constant of 1.0, 14 hidden layers, with 69 neurons per layer. For training the network, 10000 iterations were used, with RMS error of 0.0001.
3 RESULTS AND DISCUSSION
Classification results as shown in Table 1 confirm that no time series filtering technique necessarily produces a more accurate classified map. In some cases the classified maps produced from HANTS filtered time series generated more accurate results. In others cases it produced less accurate results. The kappa coefficient for the classification results can be either classified as substantial or almost perfect (LANDIS & KOCK, 1977). Different from our findings, previous work carried out by Burce et al. (2006), who have also used filtered time series from Wavelet and Fourier transforms for image classification, showed that the former produced more accurate results. This can be partly explained by the fact that the HANTS algorithm have some enhancements over traditional Fourier based algorithms which was present in the cited work.
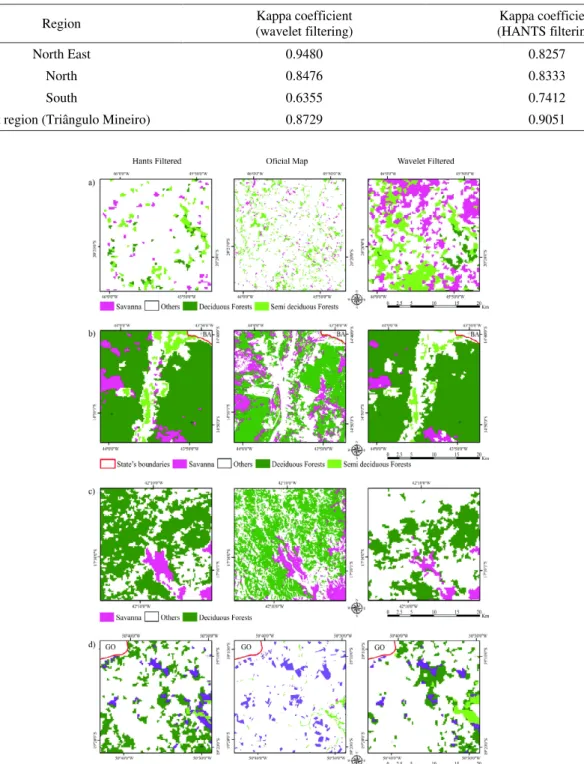
Table 1 – Classification results of the filtered time series.
Tabela 1 – Resultados de classificação das series temporais filtradas.
Region (wavelet filtering) Kappa coefficient (HANTS filtering) Kappa coefficient
North East 0.9480 0.8257
North 0.8476 0.8333
South 0.6355 0.7412
West region (Triângulo Mineiro) 0.8729 0.9051
Figure 2 – Classification results: a) Southern area; b) Northern area; c) North East area; d) Western area (Triângulo Mineiro).
In the North East area, the classification results resemble the general “shape” of forest fragments. In this case, the HANTS and Wavelet filtering techniques did not capture the same fragments in the same locations, but some of the fragments have similar shapes in the three maps. The HANTS filtered dataset and the Wavelet filtered data set of the Northern area have similar patterns when compared to the official state map. The Southern area and the Western area, however, do not show these similarities with the general shape of forest fragments when compared to the official map, especially in the southern area. Note that the spatial resolution has important implications in the map comparisons. The Northern areas have a more accurate “shaping” of vegetation classification.
This work developed an efficient methodology to map the deciduous forests present in the Cerrado biome using MODIS temporal attributes and artificial neural networks algorithm.
4 CONCLUSIONS
This study concluded that MODIS filtered NDVI (Normalized Difference Vegetation Index) time series can generate accurate maps of deciduous forests in different regions. The maps generated from both HANTS and wavelet transformation curve smoothing procedures showed near similar numerical high accuracy, indicating that any of these procedures can be used to denoise similar data sets. In the Northern areas, the maps generated from temporal features resemble the general “shape” of forest fragments, having similar patterns when compared to the official state map. This methodology was capable of detecting fragments of deciduous forests in the Triângulo Mineiro region where the official state map did not.
Future research on this topic could be enhanced by the use of soft classifiers, such as Fuzzy logic which considers the possibility of one location belonging to various classes of vegetation. Oliveira-Filho (2009b) criticizes the “rigidness” of the forest classification systems and is also concerned about the authenticity of trueness regarding these assessments and presents ‘new’ and ‘flexible’ method that could be coupled with the fuzzy logic. There is, however, the possibility of a chaos injection as predicted by the author, as the necessity of naming complex structures is ever present and useful.
5 BIBLIOGRAPHICAL REFERENCES BLOOMFIELD, P. Fourier analysis of time series. New York: J.Wiley, 1976. 257 p.
BRUCE, L. M.; MATHUR, M.; BYRD JUNIOR, J. D. Denoising and wavelet-based feature extraction of MODIS multi-temporal vegetation signatures. GIScience & Remote Sensing, New York, v. 43, p. 170-180, 2006.
CARVALHO, L. M. T. Mapping and monitoring forest remnants: a multi-scale analysis of spatio-temporal data. 2001. 140 p. Thesis (Doctor in Resources Conservation and Production Ecology) - Wageningen University, Wageningen, 2001.
CARVALHO, L. M. T.; CLEVERS, J. G. P. W.; SKIDMORE, A. K.; JONG, S. M. de. Selection of imagery data and classifiers for mapping Brazilian semideciduous Atlantic forests. Internacional Journal of Applied Earth Observation and Geoinformation, Enschede, v. 5, p. 173-186, 2004.
CARVALHO, L. M. T.; SCOLFORO, J. R. Inventário florestal de Minas Gerais: monitoramento da flora nativa 2005-2007. Lavras: UFLA, 2008. 312 p.
COLDITZ, R. R.; GESSNER, U.; CONRAD, C.; ZYL, D. van; MALHERBE, J.; NEWBY, T.; LANDMANN, T.; SCHMIDT, M.; DECH, S. Dynamics of MODIS time series for ecological applications in southern África. In: INTERNATIONAL WORKSHOP ON THE ANALYSIS OF MULTITEMPORAL REMOTE SENSING IMAGES, 14., 2007, Leuven. Proceedings... Leuven: Multitemp, 2007. p. 18-20.
GALFORD, G. L.; MUSTARD, J. F.; MELILLO, J.; GENDRIN, A.; CERRI, C. C.; CERRI, C. E. P. Wavelet analysis of MODIS time series to detect expansion and intensification of row-crop agriculture in Brazil. Remote Sensing of the Environment, New York, v. 112, n. 2, p. 576-587, 2007.
HUETE, A.; DIDAN, K.; MIURA, T.; RODRIGUEZ, E. P.; GAO, X.; FERREIRA, L. G. Overview of the radiometric and biophysical performance of the MODIS vegetation indices.
Remote Sensing of Environment, New York, v. 83, n. 1, p. 195-213, Nov. 2002.
KAISER, G. A friendly guide to wavelets. Boston: Springer-Verlag, 1994. 175 p.
KANELLOPOULOS, G. G.; WILKINSON, F.; ROLI, J. Neuro-computation in remote sensing data analysis. New Jersey: Springer, 1997. 284 p.
LANDIS, J. R.; KOCH, G. G. The measurement of observer agreement for categorical data. Biometrics, Washington, v. 33, p. 159-174, 1977.
MOREIRA, M. A. Fundamentos de sensoriamento remoto e metodologias de aplicação. 2. ed. rev. e ampl. Viçosa, MG: UFV, 2003. 295 p.
MORETTIN, P. A.; TOLOI, C. M. Análise de séries temporais. 2. ed. São Paulo: E.Blucher, 2006. 433 p.
OLIVEIRA, L. T. Fusão de imagens de sensoriamento remoto e mineração de dados geográficos para mapear as fitofisionomias do bioma Cerrado. 2004. 131 p. Dissertação (Mestrado em Manejo Ambiental) - Universidade Federal de Lavras, Lavras, 2004.
OLIVEIRA-FILHO, A. T. Classificação das fitofisionomias da América do Sul cisandina tropical e subtropical: proposta de um novo sistema - prático e flexível - ou uma injeção a mais de caos?
Revista Rodriguésia, Rio de Janeiro, 2009a. No prelo.
OLIVEIRA-FILHO, A. T. TreeAtlan 1.0: flora arbórea da Mata Atlântica e domínios adjacentes: um banco de dados envolvendo geografia diversidade e conservação. Available at: <http:// www.treeatlan.dcf.ufla.br/>. Access in: 10 jan. 2009b.
OLIVEIRA-FILHO, A. T.; CURI, N.; VILELA, E. A.; CARVALHO, D. A. Effects of canopy gaps, topography and soils on the distribution of woody species in a central Brazilian deciduous dry forest. Biotropica, Washington, v. 30, n. 3, p. 362-375, 1998.
ROERINK, G. J.; MENENTI, M.; VERHOEF, W. Reconstructing Cloudfree NDVI composites using Fourier analysis of time series. International Journal of Remote Sensing, Basingstoke, v. 21, n. 9, p. 1911-1917, 2000.
SAKAMOTO, T.; YOKOZAWA, M.; TORITANI, H.; SHIBAYAMA, M.; ISHITSUKA, N.; OHNO, H. A crop phenology detection method using time-series modis data. Remote Sensing of Environment, New York, v. 96, p. 366-374, 2005.
SMITH, S. W. The scientist and engineer’s guide to digital signal processing. San Diego: California Technical, 1998. 626 p.
SOARES, J. V.; BATISTA, G. T.; SHIMABUKURO, Y. E. Histórico e descrição. In: RUDORFF, B. F. T.; SHIMABUKURO, Y. E.; CEBALLOS, J. C. (Orgs.). O sensor MODIS e suas aplicações no Brasil. São José dos Campos: Parêntese, 2007. cap. 1, p. 2-22.
VERHOEF, W. Application of harmonic analysis of NDVI time series (HANTS). In: AZZALI, S.; MENENTI, M. (Eds.).
Fourier analysis of temporal NDVI in the Southern African and American continents. Wageningen: DLO Winand Staring Centre, 1996. p. 19-24. (Report 108).
WANG, Q.; TENHUNEM, J.; DINH, N. Q.; REICHSTEIN, M.; VESALA, T.; KERONEN, P. Similarities in ground and satellite-based NDVI time series and their relationship to physiological activity of a Scots pine forest in Finland. Remote Sensing of Environment, New York, v. 93, n. 2, p. 225-237, 2004.
WIT, A. de; SU, B. Deriving phenological indicators from spot-vgt data using the Hants algorithm. Wageningen: Centre for Geo-Information, 2005. Available at: <http://www.vgt.vito.be/ vgtapen/pages/fullpapers/Dewit_full.pdf>. Access in: 8 Feb. 2009.
YU, X.; ZHUANG, D.; CHEN, H.; HOU, X. Forest classification based on MODIS time series and vegetation phenology.
International Geoscience and Remote Sensing Symposium, Toulouse, v. 4, p. 2369-2372, 2004.
ZHANG, F.; WU, B.; LIU, C. An advanced tool for real-time crop monitoring in China. International Geoscience and Remote Sensing Symposium, Toulouse, v. 4, p. 2242-2244, July 2003.